 Research Article
Abstract
Anthropogenic marine debris is permeating in the marine environment and World’s shores present a major sink. This study assessed the anthropogenic marine debris on four beaches along the South West Nigeria shoreline was sampled between November to December 2019. The marine debris was categorized into eight categories: Plastic, Glass, Metal, Wood, Fishing Aquaculture, Cotton fiber, paper and styro foam. The relationship among the abundances of each category were examined. The abundance of each anthropogenic marine debris category were; 2331/m², 504/m², 625/m², 474/m², 508/m², 518/m², 1044/m² and 826/m² (Plastic, Glass, Metal, Wood, Fishing Aquaculture, Cotton Fiber, Paper and styrofoam) respectively. Plastic was most abundant item across the beaches shoreline, it had highest loading value (0.92) among all the AMD categories. The study area was non-significantly related abundance of AMD. Similarity evidence was recorded in the pooled data set of hierarchical analysis showed the site had a related cluster across the sites.
Keywords: Beaches; Anthropogenic Marine Debris; Shoreline
Introduction
Ecosystems and its delivery services in various ways are
affected by marine debris and tar contamination which have
dexterous effects on the wildlife and habitat quality, economy,
aesthetics, human health and safety [1]. The global and persistent
environmental problem that has considerably increased over the
last decades has been characterized as anthropogenic marine
debris (AMD) mostly composed of plastics [2]. The accretion of
AMD has multiple impacts that can be categorized into three types;
biological, ecosystemical and socio economical (Kuo and Huang,
2014). Entanglement and consumption of Marine debris by marine
organisms can be affected biologically [3,4]; this can lead to physical
and chemical damage and even death [5,6]. Based on ecosystems
and biogeography, AMD may serve as dispersal vehicle for invasive
species, which can modify local ecosystems [7-9]. Coastal marine
debris is aesthetically detrimental, it can affect the perception of
beach users and coastal tourism, requiring high beach cleaning
costs, causing losses in revenue which eventually lower the socioeconomic
values [10-12].
Packaging is a major environmental concern for many decades;
due to waste associated with packaging, particularly plastic [13-16].
Escape of plastic packaging disposed to into natural environment
due to its size, high dispersion rate and low residual value, thus are commonly identified debris [17]. There is variety of causes
of leakage including direct dumping, littering, as well as wind or
water-borne transport such as via storm water runoff, from open
dumps and landfills [17,18]. The underlying and common use of
plastic for diverse applications, light weight nature, durability and
low price made it commonly used [19]. Annual plastics production
has increased greatly over the globe. Enormous quantities plastic
is consigned to landfill, recycled, or are still in use. Nevertheless,
huge volumes end up as marine debris as a result of insufficient
treatment capacity, accidental inputs, littering, or illegal dumping
[17]. The primary compositions of plastics are mostly polyethylene
and polypropylene, recorded on the survey sand Island, Midway
Atoll [20]. Marine debris can be categorized according to two
main source categories: Ocean and Land-based debris, depending
on where Anthropogenic Marine Debris entered the marine
environment [2].
Ocean-based AMD sources include waste from shipping,
fishing, oil platforms and aquaculture [21-24]. Land based AMD
might enter the marine environment by rivers, outflow from
industries, harbors, unmanaged landfills, sewage waters, extreme
events (tsunamis hurricanes), or through direct littering by beach
visitors [25-29]. The studies of Jamback, et al. [30] estimated
over 8.4 million tons of plastic waste entering the ocean annually
from land based sources. The composition of marine litter is very
diverse consisting of plastics ( such as bags, bottles), wood (boxes
and fragments), glass(bottles), metals (cans, aerosol containers),
rubber (tires, boots), cigarette butts, etc [31]. The primary plastic
items of marine litter consist of bottles, plastic bags and packaging
materials. Wood and glass correspond to another 10% of total
marine litter each, some of the most common items of marine litter
between 1989 and 2007 (at the global level) included plastic bags
(9.4%), caps/lids (9.1%),food wrappers (8.9%), cups and cutler
(7.2%) and small (less than 2.1), plastic beverage bottles (5.5%)
[32]. Island Morphology can be affected by wind and ocean currents,
it influences plastic debris accumulation and deposition [33].
Variations of AMD abundance over a period of time might be linked
to the socio-economic and educational conditions of a country;
pro-environmental behavior such as adequate waste disposal is
generally higher in developed countries [34]. Developing countries
focus on economic growth, often at the expense of environmental
care. Environmental degradation might increase as the economy
grows, up to a point where economic development leads to higher
environmental awareness, thus, identification of the sources of
Anthropogenic Marine Debris is indispensable for satisfactory
mitigation strategies, since it is of global concern [35].
Nigeria has a coastline of 853Km, a maritime area of 46,500km2
and an exclusive economic zone of 210,900km. Nigeria covers
a total of 923,768km2 along the West African Gulf of Guinea. The
coastal areas stretch inland for a distance of about 15km in Lagos
in the West, which is the commercial capital of Nigeria. For a busy
commercial activities in Lagos Nigeria, thus the amount of AMD
of beaches are expected to be high, with a trend to increase over
period. The data collected in this study will provide base-line
information on Anthropogenic marine debris in four beaches along
the coastline of south-West Nigeria, to
a. Determine composition,
b. Estimate abundance and spatial patterns on the four beaches.
Materials and Methods
The study was conducted on four sandy beaches, along the Nigerian coastline, the Gulf of Guinea, Eastern Atlantic Ocean, South- West Nigeria. The four beaches were located in Lagos coastline of Nigeria. New Lekki Beach (6.4589⁰N; 3.6015⁰E), Elegushi beach (6.4221⁰N;3.48666⁰E), Oniru beach (6.4230⁰N;3.4429⁰E) and Alpha beach (6.4225⁰N;3.5236⁰E). Five stations each were generated from each beach, New-Lekki (N1, N2, N3, N4 and N5), Elegushi beach (E1,E2,E3,E4 and E5), Oniru beach (O1, O2, O3, O4, and O5), Alpha beach (A1,A2,A3,A4 and A5).The survey at the four beaches were conducted during the period of November to December 2019, at each sampling site, five random stations were established with the aid of GPS(Garmin GPSmap62st, Switzerland). 10m x 10m larger quadrats (placed in locations that visually appeared to have the maximum and minimum amount of debris [36]. All natural and artificial debris with a depth of 5cm in the quadrats was sieved out. All AMD items found at each station were collected and counted after classifying them according to the following categories: Plastics, Stryofoam, Papers (cigarette butts), cotton(fibre), fishing aquaculture, woods, metals, and glass. Summary statistics were calculated overall and by site. Items making up 1% or more of the debris category mean total were tabulated. ANOVA was used to test for site differences in total debris, Duncan and Fisher’s Least significant Difference was used to compare among sites. Principal coordinate Analysis and Cluster Analysis were done to compare relationship of marine debris among sites (Figure 1).
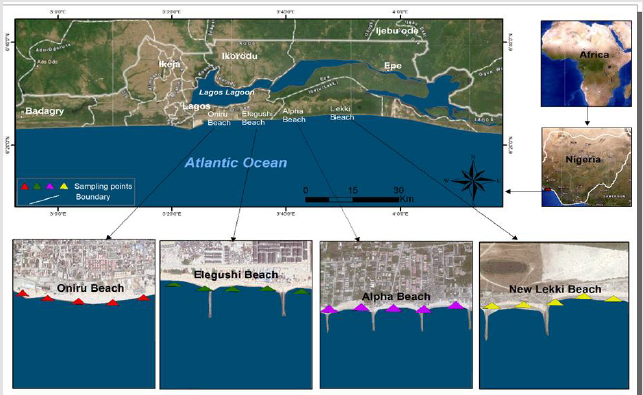
Figure 1: Map of the study area showing the sites.
Results
The mean value (mean value ±STE) of AMD surveys across the sites were 41.30± 4.99, 47.62± 5.78, 43.77 ±7.71 and 38.07± 5.17 ( Elegushi, Oniru, New-Lekki and Alpha Beach) respectively. Oniru beach had the highest AMD during the survey. The highest mean value was also registered in Oniru beach, there were no significant difference in the composition of different marine debris at the different sites (Table 1), plastics dominated New lekki beach (34.40%),and Papers Cigarette butts in Elegushi beach (31.13%). Metal presented a higher percentage in Oniru Beach the Shannon weiner diversity of each classified AMD was > 2 across the sites, evenness was > 0.7, it implies high composition and abundance of AMD during the period of survey. The proportions of the different items of AMD found in this study are relatively similar among the sandy beaches (Table 1). Plastics dominated the shoreline, most common plastics belong to household and fishing Aquaculture such as shopping bags, plastic bottles, plastic lids, plates, spoons, pieces of hard and soft plastic (> 30%). Paper (cigarette butts) and Styrofoam also had high percentage of the total (>10%), other items were glass, metals, wood cotton fiber were moderately abundance along the shoreline in the four beaches. There are no clear differences found in the composition of AMD among the sites. The ANOVA revealed no significant difference (P<0.05) in the composition of AMD across the study sectors. All the marine debris contributed to the similarities among the stations in the beaches (Figures 2-6).
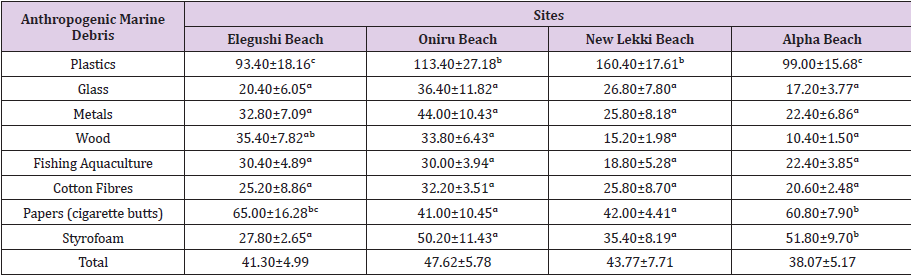
Table 1: Mean value of different anthropogenic marine debris in the four Beaches.
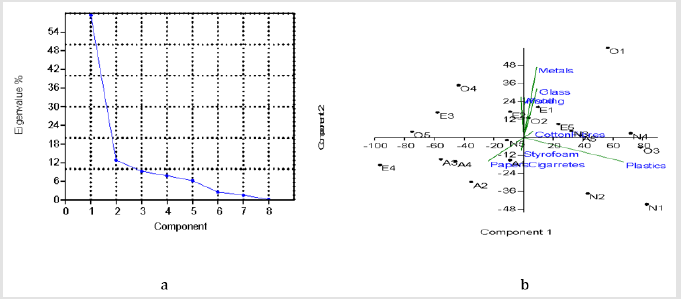
Figure 2:
a. The scree plot showing the eight components
b. Principal Component Analysis Scatter Diagram.
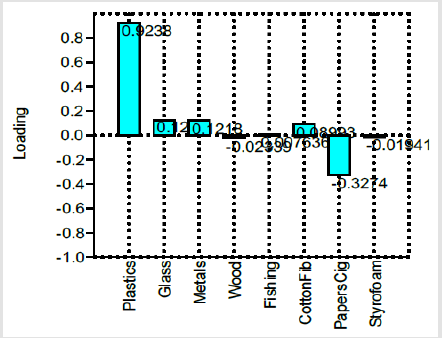
Figure 3: The loading values of different anthropogenic marine debris in the four beaches.
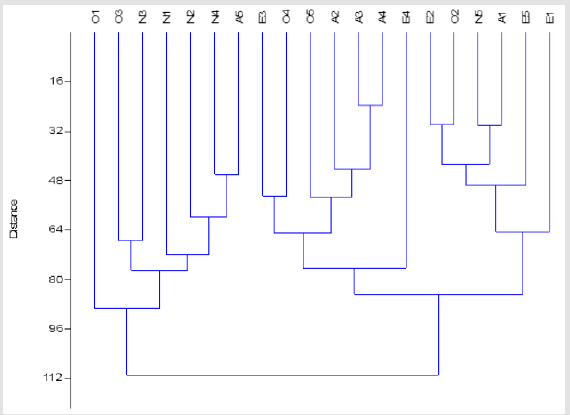
Figure 4: The Hierarchical Cluster analysis. (E1, E2, E3, E4, E5= five stations in Elegushi Beach; O1,O2,O3,O4,O5= five stations in Oniru Beach; N1,N2,N3,N4, N5= Five stations in New-Lekki Beach; A1,A2,A3,A4,A5= five stations in Alpha Beach).
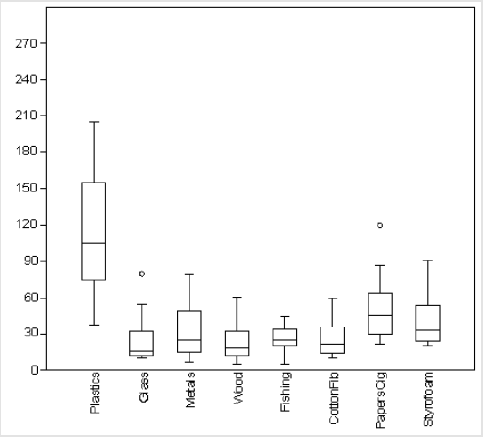
Figure 5: Box plot of the Anthropogenic marine debris categories.
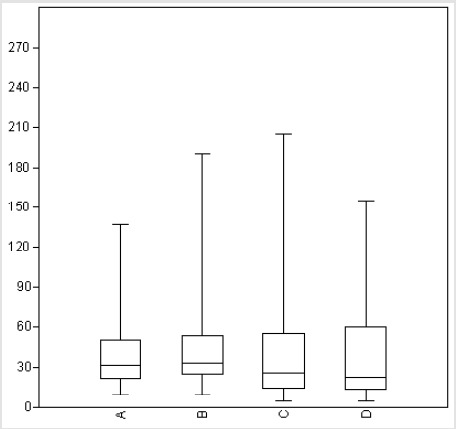
Figure 6: Box plot of the Anthropogenic marine debris in the different sites
A. Elegushi beach,
B. Oniru beach,
C. New Lekki beach,
D. Alpha beach.
The numeric abundance of the anthropogenic marine debris ascending order is Plastics> papers (cigarette butts)> Styrofoam> metals> cotton Fibres> Fishing Aquaculture> Glass> Wood. Plastics and papers (cigarette butts) had very high abundance along the shoreline beaches over 1000/m2. The mean densities of plastics were higher across the four sites than paper. The Styrofoam had high abundance after the order of plastics and paper, which can still be classified under rubber. 2331 prospective plastic particles were found during the period of survey across the shoreline of the four beaches (Elegushi, Oniru, New-Lekki and Alpha Beach), 98.9% of the particles were identified as plastic debris. This resulted in an average abundance of 116.55±40.62 plastic marine debris (mean ± standard deviation). The mean values were 93.40±18.16, 113.40±27.18, 160.40±17.6, and 99.00±15.68, across the four beaches ( Elegushi, Oniru, New-Lekki and Alpha Beach) respectively. The plastic abundance was highly variable between the four sites. At Oniru and New Lekki > 500/m2 were registered, whereas at Elegushi and Alpha beach fewer than 500/m2.
The scree plot (Figure 2) shows that the first two principal components are significant for the variation among the stations based on their Anthropogenic marine debris compositions. This is because the plot starts to flatten out at third component. Approximately 72.2% variation among the stations based on their debris composition is explained by the first two principal components. The principal coordinates Analysis clearly separated stations from the four different beaches in the ordinations space, where negative values of the first axis (PCO1) were attributed to Apha and New-Lekki beach (A1,A2,A3,A4, N1,N2, and N5) and the positive values (PCO2) to the Oniru and Elegushi beaches (E1, E2, E3, E4, E5,O1,O2, O4 and O5). The PC1, on the positive axis , plastics showed high loading and positive association with station ( under New-Lekki and Oniru beaches), on the contrary, the PC 1 negative axis, Paper Cigarettes marine debris (paper Cigarettes ) showed weak association with E4,A2,A3and A4 (Elegushi and Alpha beach). The PC2 axis on the bi-plot, stations under Elegushi and Oniru beaches showed positive association with marine debris (metals, glass, and fishing Aqua culture). Metals, glass fishing Aquaculture debris showed high loadings on the axis. The five stations each in the four beaches clustered together according to their marine debris composition (Figure 5).
Discussion
The abundance and composition of Anthropogenic marine
debris across the four beaches (Elegushi, Oniru, New-Lekki and
Alpha beaches) shorelines along the Atlantic Coast were spatially
variable. The sites were generally more diverse in terms of plastic
litter, dominated by expanded polystyrene, Styrofoam, and small
foil fragments. The different categories of AMD collected during
this study in the coastal system shoreline of the south-west Nigeria
agreed with the report of Thiel, et al. [37] who found considerably
high proportions of plastics, Styrofoam that are categorized under
household, fishery and aquaculture sources; which was contrary
to the findings in Chilean coast by Bravo, et al. [38], that stated
significantly higher quantities of metal and glass. The sampling
done in this work were on beaches in coastal city, which might
receive higher numbers of visitors, this was similar to the study
conducted and reported by Bravo, et al. [38]. Plastic particles and
fragmentation relocated by wind may have influence on the local
plastic debris abundance of small and light weight plastic including
Styrofoam, plastic bottles, expanded polystyrene which have a
good windage such as large surface area combined with low weight
[39,40]. Meanwhile, glass and metal might last longer in the upper
zone of the beach than paper and plastic which are blown away by
strong onshore winds; that usually occur along (Nigerian coast),
thus ending up in the dunnes or behind shoreline [37,41-43]. Plastic
are practically always dominant on shores worldwide, where they
often reach correspondingly high proportion as recorded in this
study (>30%).
The foremost cause for this is the extensive use of plastic for a
diversity of purposes and its long persistence in marine environment
[44]. The type and similarity of AMD composition across the local
shore found herein intensely indicate that it has local sources which
point mostly at recreational beach visitors, fishing and aquaculture
activities. Other studies from (Golik and Gertener, 1992; Madzena
and Lasiak, 1997; Martinez-Ribes et al., 2007; Thiel et al., 2013)
reiterated sources of AMD composition on beaches from local
sources such as tourism. This similarity was evident in the pooled
data set of hierarchical analysis (Figure 4) showed the sites had
a related cluster across the stations, this result aligned with the
result of Honorato-Zimmer et al., 2019 as the different geographical
zones surveyed in Chile and Germany shoreline showed strong
grouping tendencies according to their main economic activities
(tourism, shipping, fisheries/ aquaculture) as major litters. Fishing
and Aquaculture activities such as landing sites was observed in the
beaches of this study, however, fishing and aquaculture contributed
noticeably to the Anthropogenic marine debris, but did not reach
the high input observed from previous reports of (Thiel et al., 2013)
, most likely due to high contributions from other sources (beach
users) in the south west Nigerian coastline [45-53]. Similarly no
indication was found that some of the shorelines accumulated AMD
than others.
Conclusion
The results propose that a high proportion of the AMD on local shores has been directly deposited there by beach user. The abundance of the marine debris on those beaches evidently specified sources from anthropogenic activities such as recreational tourism, fishing and aquaculture, shipping. This emphasizes the strong need for local solutions in the pursuit for keeping local beaches along the Nigerian coastline clean.
References
- (2006) UNEP. Marine litter in the wider Caribbean p. 18.
- Galgani F, Hanke G, Maes T (2015) Global distribution, composition and abundance of marine litter. In: Bergmann M, Gutow L, Klages M (Eds.,)., Marine Anthropogenic Litter. Springer Verlag, Berlin pp. 29-56.
- Gregory MR (2009) Environmental implications of plastic debris in marine settings-entanglement, ingestion, smothering, hangers-on, hitch-hiking and alien invasions. Philos Trans R Soc Lond Ser B Biol Sci 364(1526): 2013-2025.
- Kühn S, Rebolledo ELB, van Franeker JA (2015) Deleterious effects of litter on marine life. In: Bergmann M, Gutow L, Klages M (eds.) Marine Anthropogenic Litter. Springer Verlag, Berlin pp. 75-116.
- Rochman CM, Hoh E, Kurobe T, Teh SJ (2013) Ingested plastic transfers hazardous chemicals to fish and induces hepatic stress. Sci Rep 3: 3263.
- Vegter AC, Barletta M, Beck C, Borrero J, Burton H, et al. (2014) Global research priorities to mitigate plastic pollution impacts on marine wildlife. Endanger Species Res 25: 225-247.
- Amaral Zettler LA, Zettler ER, Slikas B, Boyd GD, Melvin DW, et al. (2015) The biogeography of the Plastisphere: implications for policy. Front Ecol Environ 13(10): 541-546.
- Kiessling T, Gutow L, Thiel M (2015) Marine litter as habitat and dispersal vector. In: Bergmann M, Gutow L, Klages M (Eds.)., Marine Anthropogenic Litter. Springer Verlag, Berlin, Germany, pp. 141-181.
- Thiel M, Gutow L (2005) The ecology of rafting in the marine environment I The floating substrata. Oceanogr Mar Biol Annu Rev 42: 181-264.
- Jang YC, Lee J, Hong S, Lee JS, Shim WJ, et al. (2014) Sources of plastic marine debris on beaches of Korea: more from the ocean than the land. Ocean Sci J 49: 151-162.
- Newman S, Watkins E, Farmer A, Ten Brink P, Schweitzer JP (2015) The economics of marine litter. In: Bergmann M, Gutow L, Klages M (Eds.,)., Marine Anthropogenic Litter. Springer Verlag, Berlin, Germany, pp. 367-394.
- Santos IR, Friedrich AC, Wallner Kersanach M, Fillmann G (2005) Influence of socio-economic characteristics of beach users on litter generation. Ocean Coast Manag 48(9-10): 742-752.
- Rundh B (2005) The multi-faceted dimension of packaging: marketing logistic or marketing tool? Br Food J 107(9): 670-684.
- Rokka J, Uusitalo L (2008) Preference for green packaging in consumer product choices- do consumers care? Int J Consum Stud 32(5): 516-525.
- Williams H, Wikström F, Löfgren M (2008) A life cycle perspective on environmental effects of customer focused packaging development. J Clean Prod 16(7): 853-859.
- Venter K, Van der Merwe D, De Beer H, Kempen E, Bosman M (2011) Consumers perceptions of food packaging: an exploratory investigation in Potchefstroom, South Africa. Int J Consum Stud 35(3): 273-281.
- Barnes DK A, Galgani F, Thompson RC, Barlaz M (2009) Accumulation and fragmentation of plastic debris in global environments. Philos Trans R Soc Lond Ser B Biol Sci 364(1526): 1985-1998.
- Chitaka TY, Blottnitz HV (2019) Accumulation and characteristics of plastic debris along five beaches in Cape Town. Marine Pollution Bulletin 138: 451-457.
- Thompson RC, Swan SH, Moore CJ, vom Saal FS (2009a). Our plastic age. Phil Trans R Soc B: Biologic Sci 364(1526): 2153-2166.
- Ribic CA, Sheavly SB, Klavitter J (2012) Baseline for b Beached marine Debris on Sand Island, Midway Atoll. Marine pollution Bulletin 64(8): 1726-1729.
- Astudillo J, Bravo M, Dumont C, Thiel M (2009) Detached aquaculture buoys in the SE Pacific: potential dispersal vehicles for associated organisms. Aquat Biol 5(3): 219-231.
- Edyvane KS, Dalgetty A, Hone PW, Higham JS, Wace NM (2004) Long-termmarine litter monitoring in the remote Great Australian Bight, South Australia. Mar Pollut Bull 48(11-12): 1060-1075.
- Hinojosa IA, Thiel M (2009) Floating marine debris in fjords, gulfs and channels of southern Chile. Mar Pollut Bull 58: 341-350.
- Sheavly SB (2007) National Marine Debris Monitoring Program: Final Program Report, Data Analysis and Summary. Prepared for US Environmental Protection Agency by Ocean Conservancy, Grant Number X83053401-02. p. 76.
- Aguilera MA, Broitman BR, Thiel M (2016) Artificial breakwaters as garbage bins: structural complexity enhances anthropogenic litter accumulation in marine intertidal habitats. Environ Pollut 214: 737-747.
- Goto T, Shibata H (2015) Changes in abundance and composition of anthropogenic marine debris on the continental slope off the Pacific coast of northern Japan, afterthe March 2011 Tohoku earthquake. Mar Pollut Bull 95(1): 234-241.
- Green DS, Boots B, Blockley DJ, Rocha C, Thompson R O (2015) Impacts of discarded plastic bags on marine assemblages and ecosystem functioning. Environ Sci Technol 49(9): 5380-5389.
- Khordagui H, Abu Hilal A (1994) Industrial plastic on the southern beaches of the Arabian Gulf and the western beaches of the Gulf of Oman. Environ Pollut 84(3): 325-327.
- Rech S, Macaya Caquilpán V, Pantoja JF, Rivadeneira MM, Jofre Madariaga D, et al. (2014) Rivers as a source of marine litter - a study from the SE Pacific. Mar Pollut Bull 82(1-2): 66-75.
- Jambeck JR, Geyer R, Wilcox C, Siegler TR, Perryman M, et al. (2015) Plastic waste inputs from land into the ocean. Science 347(6223): 768-771.
- Fanshawe T, Everand M (2002) The Impacts of Marine Litter. Marine Pollution Monitoring Group Report of the Marine Litter Task Team.
- (2009) UNEP. Marine litter: A Global Challenge. Report. UNEP Nairobi Kenya Walls M 2011. Deposit-refund Systems in Practice and Theory. Discussion Paper p. 11-47.
- Imhof HK, Laforsch C, Wiesheu AC, Schmid J, Anger PM, et al. (2016) Pigments and plastic in limnetic ecosystems: a qualitative and quantitative study on microparticles of different size classes. Water Res 98: 64-74.
- Morren M, Grinstein A (2016) Explaining environmental behavior across borders: a meta-analysis. J Environ Psychol 47: 91-106.
- Honorato Zimmera D, Kruseb K, Knickmeierb K, Weinmannb A, Hinojosaa IA, et al. (2019) Inter-hemispherical shoreline surveys of anthropogenic marine debris - A binational citizen science project with schoolchildren. Marine pollution Bulletin 138 (2019): 464-475.
- Lee J, Hong S, Song YK, Hong SH, Jang YC, et al. (2013) Relationships among the abundances of plastic debris in different size classes on beaches in South Korea. Marine pollution Bulletin 77(1-2): 349-354.
- Thiel M, Hinojosa IA, Joschko T, Gutow L (2011) Spatio-temporal distribution of floating objects in the German Bight (North Sea). J Sea Res 65(3): 368-379.
- Bravo M, Gallardo MA, Luna Jorquera G, Núñez P, Vásquez N, et al. (2009) Anthropogenic debris on beaches in the SE Pacific (Chile): results from a national survey supported by volunteers. Mar Pollut Bull 58(11): 1718-1726.
- Imhof HK, Sigl R, Brauer E, Feyl S, Giesemann P, et al. (2017) Spatial and temporal variation of macro, meso- and microplastic abundance on a remote coral island of the Maldives, Indian Ocean. Marine pollution Bulletin 116(1-2): 340-347.
- Browne MA, Galloway TS, Thompson RC (2010) Spatial patterns of plastic debris along estuarine shorelines. Environ Sci Technol 44(9): 3404-3409.
- Garrity SD, Levings SC (1993) Marine debris along the Caribbean coast of Panama. Mar Pollut Bull 26: 317-324.
- Cunningham DJ, Wilson SP (2003) Marine debris on beaches of the greater Sydney Region. J Coast Res 19(2): 421-430.
- Portz L, Rogério P, Manzolli J, Ivar do Sul A (2011) Marine debris on Rio Grandedo Sul north coast, Brazil: spatial and temporal patterns. J Integr Coast Zone Manage 11(1): 41-48.
- Derraik JGB (2002) The pollution of the marine environment by plastic debris: a review. Mar Pollut Bull 44(9): 842-852.
- Adolphe O Debrot, AO Rijn, JV Bron, PS, De León R (2013) A baseline assessment of beach debris and tar contamination in Bonaire, Southeastern Caribbean. Marine pollution Bulletin 71(1-2): 325-329.
- Claereboudt MR (2004) Shore litter along sandy beaches of the Gulf of Oman. Mar Pollut Bull 49(9-10): 770-777.
- Galgani F, Leauté JP, Moguedet P, Souplets A, Verin Y, et al. (2000) Litter on the sea floor along the European coasts. Mar Pollut Bull 40(6): 516-527.
- Kiessling T, Salas S, Mutafoglu K, Thiel M (2017) Who cares about dirty beaches? Evaluating environmental awareness and action on coastal litter in Chile. Ocean Coast Manag 137(1): 82-95.
- Ong S, Lee J, Jang YC, Kim YJ, Kim HJ, et al. (2013) Impacts of marine debris on wild animals in the coastal area of Korea. Mar Pollut Bull 66(1-2): 117-124.
- Rochman CM (2015) The complex mixture, fate and toxicity of chemicals associated with plastic debris in the marine environment. In: Bergmann M, Lars G, Klages M (Eds.,)., Marine Anthropogenic Litter. Springer International Publishing pp. 117-140.
- Silva Iñiguez L, Fischer DW (2003) Quantification and classification of marine litter on the municipal beach of Ensenada, Baja California, Mexico. Mar Pollut Bull 46(1): 132-138.
- Thompson RC, Moore CJ, vom Saal FS, Swan S (2009) Plastics, the environment and human health. Phil Trans R Soc 364(1526): 2153-2166.
- Velander K, Mocogni M (1999) Beach litter sampling strategies: is there a ‘‘best’’ method? Mar Pollut Bull 38: 1134-1140.
