 Research Article
Abstract
In the present analysis, 30 compounds were selected as novel type 1 diabetes inhibitors to combat diabetes mellitus resistance and were subjected to 2D-QSAR and 3D-QSAR studies using CoMFA (ffdsel) and CoMFA (uvepls). In the 2D-QSAR study, multiple linear regression was used. A decent relationship was found between the experimental activity and those got by model 1 and model 2 such as (r2 = 0.7616 and q2 = 0.6327) and (r2 = 0.7721 and q2 = 0.5834), respectively. Model 1 with a low standard error of estimate and high valve of q2 seen promising than model 2. In the 3D-QSAR study, docking-based alignment was used. The results showed that CoMFA (uvepls) (q2 = 0.6897; r2 = 0.9999) have good stability and predictability. The internal validation indicated that CoMFA (uvepls) MIFs possess good predictive power than COMFA (ffdsel). The molecular docking study showed that conventional hydrogen bonding, hydrophobic (pi-Alkyl) and van der Waals interactions are key residues such as Glu50, Ser271, Arg 266, Pro270 and Tyr66 play an important role in ligandreceptor binding. MD simulation analysis showed that compound 17 formed hydrophobic (pi-Alkyl) and conventional hydrogen bonds with the residues (Glu50, Ser271, Arg 266, Pro270 and Tyr66), and binds more closely to type 1 diabetes. These results provide useful insights into the discovery and design of a new generation of type 1 diabetes inhibitors.
Keywords: Type 1 diabetes; 2D-QSAR; Open3DALIGN; Open3DQSAR; 3D-QSAR; Pharmacophore mapping; Molecular Docking; Molecular Dynamics
Introduction
Diabetes, otherwise known as blood sugar is a stipulation that vitiates the body’s power to process blood glucose [1]. There are three (3) main types of diabetes: type 1, type 2 diabetes and gestational diabetes. Other less prevalent are monogenic diabetes and cystic fibrosis-related diabetes. Type 1 diabetes, also known as juvenile diabetes, occurs because the body does not produce insulin [2]. Individuals with type I diabetes are insulin-subordinate, which means that they can take false insulin every day to stay alive has been one of the serious issues jeopardizing human life since it was accounted for in 1988 [3,4]. World health organization (WHO) anticipated that 347 million individuals have blood sugar (diabetes), which is anticipated to be the seventh driving reason of deaths by 2030 [5], while Wild and his co-worker projected approximately 400 million cases in 2030 contrasted with 170 million out of 2000 [6,7]. Diabetes is a term used to depict a gathering of metabolic issues portrayed by hyperglycemia [8]. Chronic hyperglycemia in diabetes prompts the demolition of kidneys, pancreas, sensory system, foundational lupus erythematosus, stroke, eyes, joints or skin, heart, veins, visual impairment, and sudden passing [9,10]. Intense myocardial dead tissue and lethal reinfections are regular with blood sugar patients in the intense stage and during the main year of follow-up [11-15].
In any case, to repay the lesser level of insulin in the blood, the organization of insulin infusion followed by serious treatment with multi-dose subcutaneous insulin can lessen up to 30% of mortality in diabetic patients with intense myocardial localized necrosis [16-18]. To grow new, more powerful (more naturally open, less poisonous, without symptoms/ side effect) is significant as found out by Boukarai, et al. [7], utilized use of principal components analysis (PCA), multiple linear regression (MLR), multiple non-linear regression (MNLR) and the artificial neural network (ANN) to plan 2D QSAR model of Flavonoid subordinates as in vitro inhibitors operators of Aldose Reductase (ALR2) protein for diabetic difficulties. They revealed good internal and external predictions. The measurable outcomes demonstrate that the model is factually critical and shows excellent soundness towards information variety in leave-one-out (LOO) cross-validation. Vitthal, et al. [19] who estimate the 3D QSAR and pharmacophore modeling on substituted cyanopyrrolidines as future dipeptidyl peptidase-IV inhibitors of type II antidiabetic agents. They reported that the inhibition provides useful information on the structural characteristics that provide the cyanopyrrolidine inhibitory potency. Pharmacophore modeling was used in addition to their work to identify the structural features of cyanopyrrolidines which are essential to the structure’s biological activity. In this work, we perform 2D-QSAR, 3D-QSAR (CoMFA), docking, and molecular dynamics (MD) modeling study of 30 compounds as LYP inhibitors (type 1 diabetes). The model can be successfully employed to design selective diabetes type 1 inhibitors and to discover novel frameworks through screening of compound databases.
Methodology
The dataset used in this study was taken from the PubChem [https://pubchem.ncbi.nlm.nih.gov/bioassay/435024].The studied materials of this research work are 30 compounds. These compounds’ structure and their PubChem-CID, experimental, and predicted binding values (-log(IC50 * 10 ^ -6) are available in Table 1. Before anything else, the structures of all the compounds have been optimized and then encrypted the structural features (descriptors) of the molecules. We used Spantan’s version 14 program with a semi-empirical PM3 basis set for geometrical optimization. Finally, chemical descriptors were revealing for each molecule that was obtained from the PaDEL-Descriptor [20] output. Molecular descriptors calculated with PaDEL-Descriptor [20] were subsequently subjected to variable reduction using a Data Pre- Treatment Tool (V-WSP Tool) [21]. The data set was then separated into two groups: training and test sets using the [http:/dtclab.webs. com/software-tools] technique of Kennard Stone. For the model generation, the training set, consisting of 18 molecules, was used and the test set, consisting of 6 molecules, was used to take care of the overtraining and evaluate the predictive power using multiple linear regression (MLR) of the produced model.
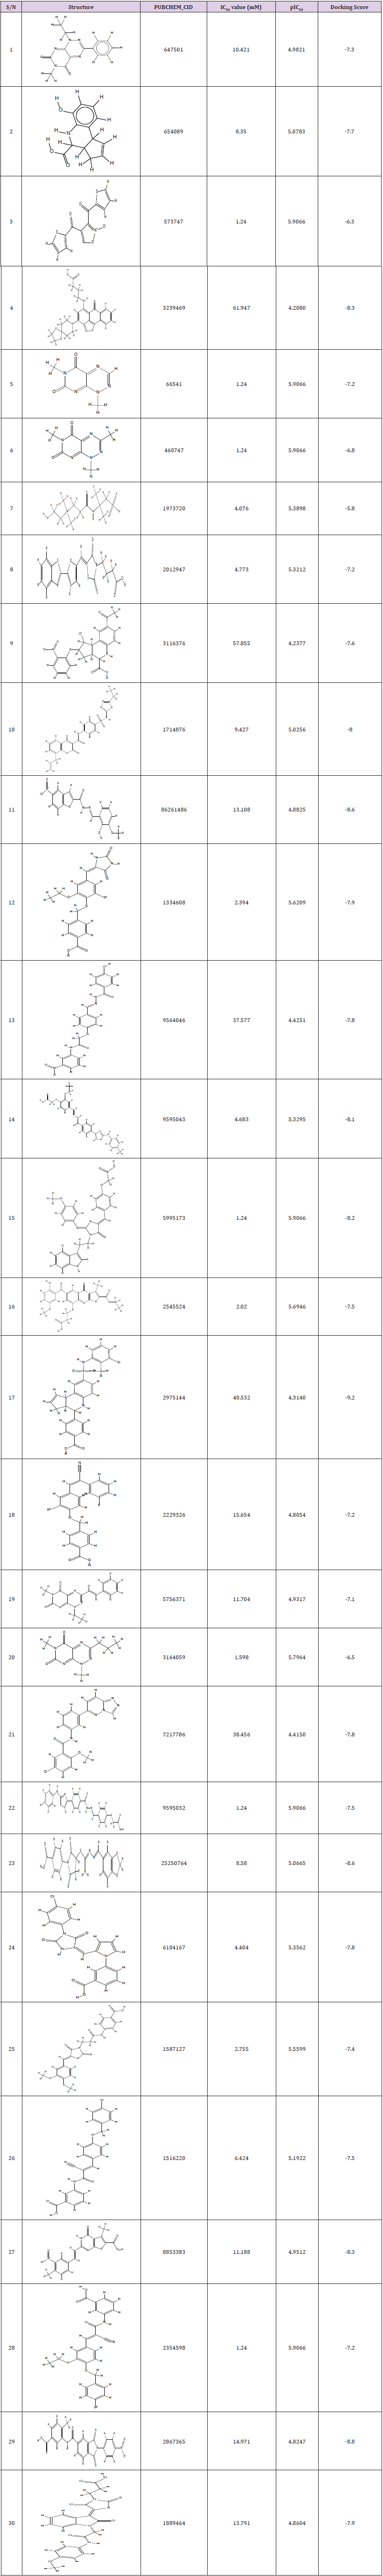
Table 1: Structures of 30 compounds, bioactivity, and docking results of the studied compounds.
In the development of CoMFA (FFDSEL and UVEPLS) studies, alignment of the chemical structure is of crucial importance. The precision of the CoMFA model forecasts and the stability of the contour models are highly dependent on the structural orientation of the molecules [22]. As a prototype for superimposition, the most active stable compound was used, assuming its conformation is the most bioactive conformation at the level of the active receptor site. In Open3DALIGN [23], the fragment was chosen from the docking-base alignment method and the majority of the molecules had been matched with it. In Figure 1, the compatible compounds are shown. The 3D descriptors were used as independent variables and the pIC50 as the dependent variable to derive 3D-QSAR models. Open3DQSAR, a free software, is used today for highthroughput MIFs analysis for pharmacophore exploration [24]. This Open3DQSAR method is useful for the pharmacophore evaluation and drug formulation based on ligand [24]. Recent studies show that the findings obtained using this technique are comparable to CoMFA / CoMSIA [22]. Molecular interaction fields (MIFs) for van-der-Waals and electrostatic field interactions for Open3DQSAR analysis were measured using a grid box around the aligned structures with a phase size of 1.5Å and a distance of 5.0Å [22], similar to the CoMFA report. Max / min cut-off (level= 30), zeroing (level=0.05), standard deviation cut-off (level= 2.0), N-level variable exclusion and block unscaled weighting (BUW) were pretreated with these MIF descriptors. Finally, to compare the MIFs with the pIC50 operation, the PLS approach was employed. Using the uninformative variable elimination-partial least square (UVEPLS) variable selection technique where the least informative variables were eliminated, this model was further enhanced.
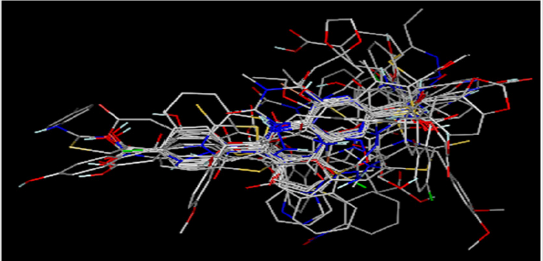
Figure 1: Superposition of 30 molecules in the training collection, including substances, and test collection on the prototype compound 4.
Formulation of Target Proteins and Selection of Novel Drugs
The 3D Structure of Lyp with inhibitor I-C11 receptor protein (PDB code: 2QCT) crystal structure [25] used in this study was extracted from the Protein Data Bank (PDB) of the RCSB (Research Collaboratory for Structural Bioinformatics). Using the Discovery Studio 2016 client [http:/accelrys.com/products/discoverystudio/], the heteroatom was removed from the 2QCT protein PDB files. The 2QCT polypeptide chains (A, B, C, D, E, and F) were deleted and only the Homo sapiens chain A was saved for further study as a PDB file format. Insulin receptor 2QCT chain A has been used successfully to monitor and discover unique molecules for the treatment of type 1 diabetes. The resolution of this entry mentioned is 1.85 Å.
Molecular Docking
We used PyRx-Visual Screening Tool v0.8 docking program from the Scripps Research Institute. The Autodock Vina [26] was used to obtain the insulin receptor protein’s affinity energy and binding mode with the compounds (Table 1). Exhaustiveness = 8, center_x = -13.5487, center_y = -163.312, center_z = 29.2265, size_x = 53.7915888596, size_y = 64.9246322632, and size_z = 47.2789107299.
Molecular Dynamic Simulations
Molecular dynamics calculations are performed using VMD [27] and NAMD [28] and the CHARMM force field [29]. The interaction parameters were computed using the CHARMM27 force field. The periodic boundary condition was used and the system was immersed in a cubic water box of extended simple point charge water molecules to calculate the solvated protein. The protein was solvated with explicit water with 0.1M NaCl salt concentration for neutralization. To maximize the initial structure of the protein, the minimization was performed. After that, the system temperature was steadily heated up by 100ps from 0 K to 310 K. Finally, at 310 K for 100ps with the NVT ensemble, the system was balanced. The system was simulated for 1ns (50,000 steps) of chemical time. The MD simulation and results from the analysis were performed on the DELL INSPIRON; Pentium® Dual-Core CPU T4500 @ 2.30GHz and 3GB of RAM, 64-bit-Operating System, x64-based processor. A full summary of the input parameters is given in the NAMD documentation (www.ks.uiuc.edu/Research/namd/).
Results and Discussion
To discover the structure-activity relationship (SAR) of 24 different compounds acting as antidiabetics, a 2D-QSAR study was performed. Generally, an important and distinguishing attribute of a model is expressed in a 2D-QSAR analysis by its fitting and prediction capacity. A training set of 18 compounds used for the construction of the model and a test set of 6 compounds used for the evaluation of the constructed model. The stepwise selection and variable elimination MLR analysis resulted in the derivation of two models, with 3 and 4 descriptors, respectively. With the selected descriptors, using the training set data, we developed the linear model and obtained the following equation, as shown below:
Model 1
pIC50=5.59766(+/-0.27231)+0.42687(+/-0.1445) nAcid-0.00396(+/-0.0006)ATS3e+0.08317(+/-0.01376)bpol -Model 1
Internal Validation Parameters: SEE:0.2430; r^2 :0.7616; r^2 adjusted :0.7106; F :14.91158 (DF :3, 14) Leave-One-Out(LOO) Result: Q2 :0.6327; PRESS :1.2732; SDEP :0.2660
External Validation Parameters: r^2 :0.6389; r0^2 :0.6385; reverse r0^2:0.4084; rm^2(test) :0.6268;
reverse rm^2(test) :0.33218 ; average rm^2(test) :0.4795; delta rm^2(test) :0.2946; rmsep:0.2873; rpred^2 :0.633; Q2f1 :0.633; Q2f2 :0.6290
Golbraikh and Tropsha acceptable model criteria’s:
Q^2 = 0.63274; r^2 = 0.63886; |r0^2-r’0^2| = 0.23008; |r0^2-r’0^2|<0.3; k = 0.99086; [(r^2-r0^2)/r^2] = 0.00056; k’ = 1.00597; [(r^2-r’0^2)/r^2] = 0.36071
Model 2
pIC50=5.6178(+/-0.27756)+0.46502(+/-0.15474) nAcid-0.03162(+/-0.04098)ALogP-0.00393(+/-0.00061) ATS3e+0.08148(+/-0.01414)bpol___________________________Model 2
Internal Validation Parameters: SEE: 0.2465; r^2 :0.7721; r^2 adjusted :0.7020; F :11.00922 (DF :4, 13)
Leave-One-Out(LOO) Result: Q2 :0.5834; PRESS :1.4443; SDEP :0.2833;
External Validation Parameters: r^2 :0.6408; r0^2 :0.6407; reverse r0^2:0.4292; rm^2(test) :0.6354; reverse rm^2(test) :0.3460; average rm^2(test) :0.4907; delta rm^2(test) :0.2894; rmsep:0.2847; rpred^2 :0.6396; Q2f1 :0.6396; Q2f2 :0.6357
Golbraikh and Tropsha acceptable model criteria’s:
Q^2 = 0.5834; r^2 = 0.64077; |r0^2-r’0^2| = 0.21152; |r0^2-r’0^2|<0.3; k = 0.99332; [(r^2-r0^2)/r^2] = 0.00011;k’ = 1.0035; [(r^2-r’0^2)/r^2] =0.33021
Model 3
along with the corresponding statistical parameters shows the positive contribution of nAcid (4.79%) (Number of acidic groups) indicating the importance of [O;H]-[C,S, P]=O and [NH] (S(=O)=O)C(F)(F)F) groups at the portion of the ring compounds. The other descriptor, ATS3e (-54.83%) is inversely proportional, suggesting that the increase in the number of lag 3 (log function) autocorrelations of Broto-Moreau weighted by Sanderson electronegativity decreases activity. The direct relationship of bpol descriptor (40.37%) reveals the importance of Sum of the absolute value of the difference between all the bonded atoms (including implicit hydrogens) in the molecule’s atomic polarizability for selective potent molecule design. Moreover, to identify the cofactor effective with the bpol descriptor, the tetra-parametric equation has been developed and among the tetra-parametric models, the best one was found to be model 2 in addition to the corresponding mathematical parameters. The models obtained also have a strong forecast in terms of r2 and q2. In the above equation, the Number of acidic groups (nAcid) (5.24%) and Sum of the absolute value of the difference between atomic polarizabilities of all bonded atoms in the molecule (including implicit hydrogens) (bpol) (39.74%) descriptors has a beneficial effect on the compounds’ inhibitory activity values. The next relevant independent descriptor is AlogP (-0.37%) and (ATS3e) (-54.65%) which can be defined as the Ghose-Crippen LogKow and Broto-Moreau autocorrelation of lag 3 (log function) weighted by Sanderson electronegativity, respectively. It reveals that lipophilic auxochrome and Broto- Moreau autocorrelation groups should not be connected directly to the compound ring.
The independent descriptor nAcid, ATS3e, and bpol, respectively, are common between model 1 and model 2 but the amount of contribution varies from each other. The introduction of the AlogP descriptor in model 1 increases the percentage of contribution of nAcid and reduce the percentage contribution of the bpol descriptor in model 2. Among these two models, Model 1 came up with a very positive outcome compared to Model 2. The observed and predicted pIC50 is shown in Figure 2, a list of the descriptors that led to the current analysis and the predicted behavior is shown in Table 2. By measuring their variance inflation factors (VIF), which can be interpreted mathematically as
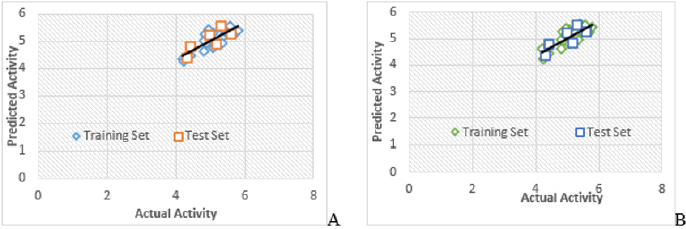
Figure 2: Graph of actual vs. predicted activities for training and test set molecules
(A) Model 1
(B) Model 2
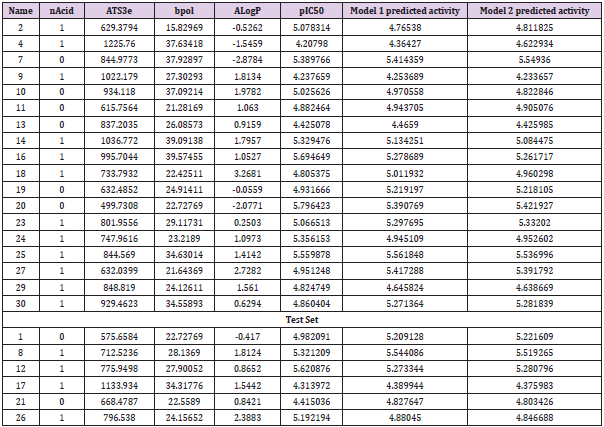
Table 2: Descriptors and predicted activity of training and test set using.

the multi-collinearity between the above descriptors was observed, where r2 is the multiple regression correlation coefficients between the variables within the model. If VIF = 1, there is no inter-correlation for each variable; if VIF falls within 1–5, the model concerned is acceptable; and if VIF is above 5, the model concerned is dysfunctional and a re-examination is required. [30,31]. The corresponding VIF values for the descriptors are seen in Tables 3 & 4. All descriptors have VIF values of less than five, meaning that the relevant effect has statistical importance, and the descriptors detected in models 1 and 2 are quite orthogonal. The mean effect (MF) value represents the relative importance of the descriptor compared to the other descriptors in the formula [32,33]. The mean effect indicates the contribution of each descriptor to the model and its values are shown in Table 3 for Model 1 and Table 4 for Model 2 respectively. Its sign shows the way of variance in task values as a function of the rise or decrease in descriptor values. As seen in Tables 3 & 4, ATS3e and bpol descriptors have high mean effect values relative to other descriptors, which indicates that these descriptors have a significant impact on the pIC50 of the compounds studied.
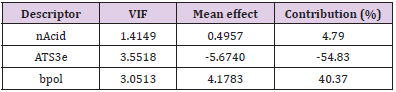
Table 3: Linear model 1 is based on the three parameters selected by the SW-MLR method.
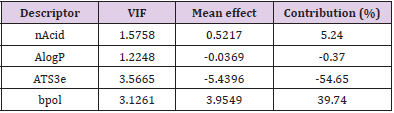
Table 4: Linear model 2 is based on the four parameters selected by the SW-MLR method.
The Y-randomization test was used to determine the robustness of the model. The Y-randomization test supports whether the model has a chance association or a true structure-activity relationship to verify the adequacy of the molecule training set [34]. The steps followed during the randomization test are
A. Continuously clamping action data in the training set of molecules,
B. Using randomized data to produce 2D-QSAR equations, and
C. Connecting the resulting scores to the initial 2D-QSAR equation generated with non-randomized data. If the expected behavior of the random experiment is equivalent to that of the original equation, the observation set is not adequate to endorse the hypothesis. The new 2D-QSAR models (after multiple repetitions) are predicted to have low r2 and q2LOO values. If the reverse is the case, an appropriate 2D-QSAR model for the particular modeling system and data cannot be collected. The results obtained (Tables 5 & 6) suggest that an appropriate 2D-QSAR model is obtained by the MLR approach and that the model is statistically valid and stable in Models 1 and 2. Leverage values can be determined for each compound and plotted vs. standardized residues and allow for the graphical identification of both the outliers and the influential compounds in the model. Figure 3, shows the Williams map, the applicability domain is centered in a squared / rectangular region in ±2 bound for residuals and the threshold value h * which can be mathematically expressed as h*= (3k+1)/n, where k is the number of model parameters and n is the number of compounds [35,36]. Figure 3 has shown that all the components of the training set and the test set are within this square / rectangular region. There are no outlier compounds with normal residues > 2d for both training and test sets. In comparison, both substances have a value smaller than the alert value h * of 0.56 (~0.60) for Model 1 and h * of 0.7 for Model 2.
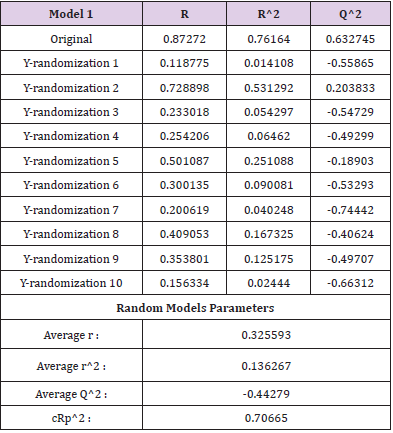
Table 5: R2 train, Q2 LOO, and cRp2 values after several Y-randomization tests for model 1.
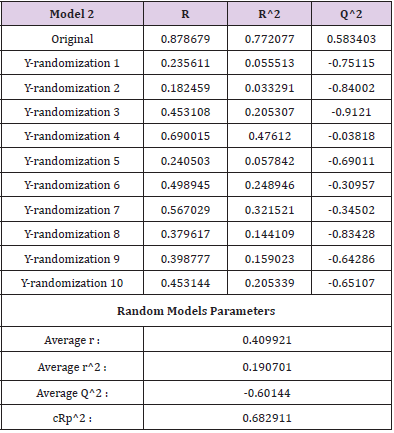
Table 6: R2 train, Q2 LOO, and cRp2 values after several Y-randomization tests for model 2.
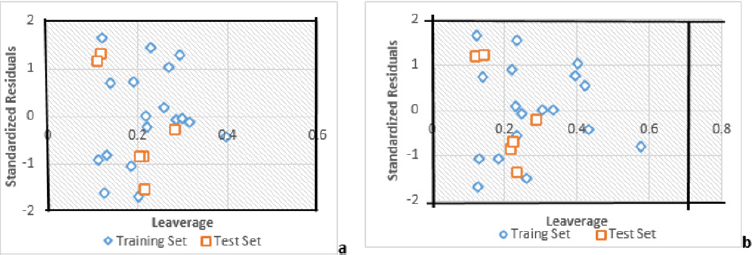
Figure 3: The Williams plot, the plot of the standardized residuals versus the leverage value
(a) Model 1
(b) Model 2.
Results of the 3D-QSAR Models
Interpretation of 3D-QSAR Polyhedrons: The plot of actual and predicted activity obtained from CoMFA (ffdsel) and CoMFA (uvepls) analyses are shown in Figure 4. The best statistical analysis obtained by the CoMFA (ffdsel) and CoMFA (uvepls) are listed in Table 7, which indicated that the obtained 3D-QSAR model is reliable and able to predict binding affinities of the new compound. In CoMFA (ffdsel), the van der Waals (steric) and Coulomb (electrostatic) contributions were found to be 52% and 48%, respectively. In CoMFA (uvepls), the van der Waals and Coulomb contributions were found to be 54% and 46%, respectively. Thus, the steric field had a larger effect than the electrostatic field, indicating that the steric interactions of the molecules with the receptor could be an important factor for anti-diabetes activity. The van der Waals and Coulomb contributions were also evaluated by LOO, LTO, and LMO cross-validation and test set evaluation. These models showed good correlative and predictive values which indicated that the CoMFA (ffdsel) models were less in need of the fields engaged. The statistical importance of the CoMFA (uvepls) 3D-QSAR models is far greater than that of the QSAR models developed using the 2D method, as shown by stronger q2 values and smaller standard error estimates [37]. Furthermore, the QSAR models developed using 3D methods offer an opportunity to describe the observed behavior variance in terms of contour maps as discussed below. The contour maps created during docking-based Open3DQSAR analyses are depicted in Figure 5-8 respectively.
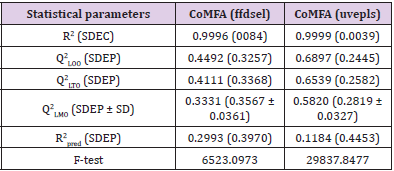
Table 7: Summary of 3D-QSAR models parameters.
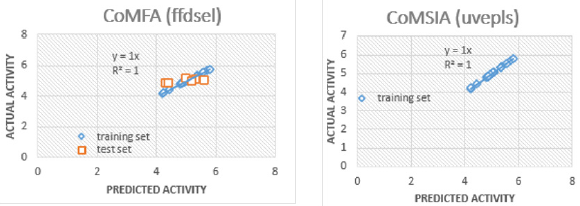
Figure 4: Scatter plots of pIC50 3D-QSAR models for the training sets and test set validation.
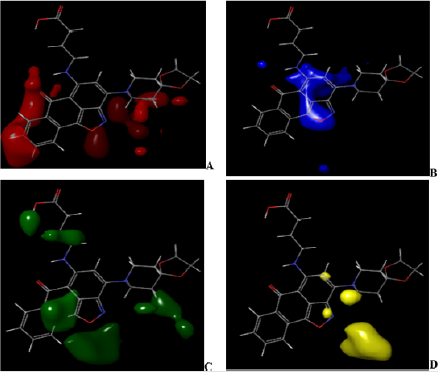
Figure 5: CoMFA (ffdsel) steric and electrostatic interactions contour maps with the highest binding affinity (compound 4).
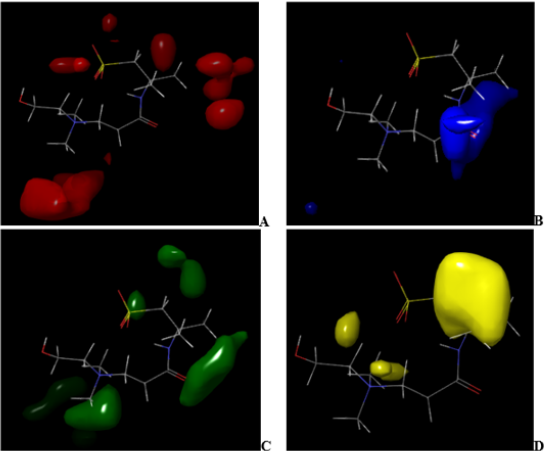
Figure 6: CoMFA (ffdsel) steric and electrostatic interactions contour maps with the highest binding affinity (compound 7).
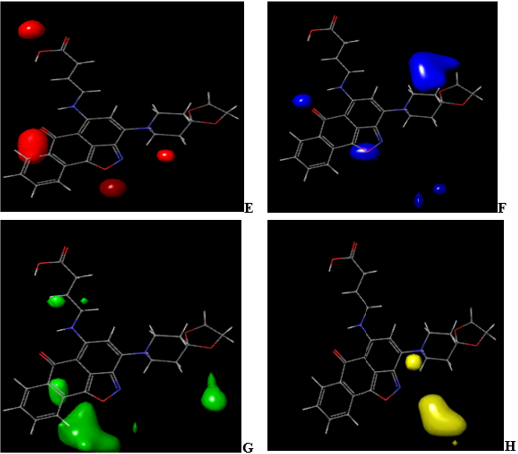
Figure 7: CoMFA (uvepls) steric and electrostatic interactions contour maps with the highest binding affinity (compound 4).
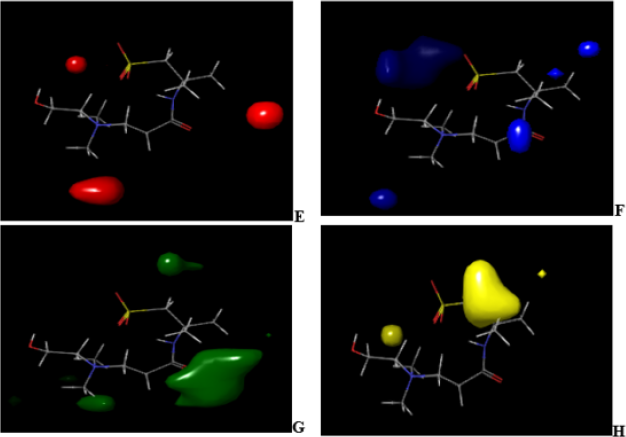
Figure 8: CoMFA (uvepls) steric and electrostatic interactions contour maps with the highest binding affinity (compound 7).
A visual representation of CoMFA (ffdsel) steric and electrostatic contour maps with compound 4 and compound 7 shown in Figures 5 & 6. In (Figures 5A & 5B) and (Figures 6A & 6B) of CoMFA steric interactions contour maps with compound 4 and compound 7, respectively. The red and blue color represent regions where an increase or decrease of steric bulk, respectively, are predicted to enhance binding affinity. In the CoMFA (ffdsel) steric contour map of compound 4, this steric bulk (red color) was found making interaction with the compound base on the auxochrome that is attached to cyclohexane and benzene rings (Figure 5A). The steric contour map of compound 7, the large red coloration scattering around the compound indicating increased steric bulk located around compound 7 (Figure 6A) will enhance the activity. These contours are represented in Figure 5B. Sterically unfavorable contours are localized on the ring. Therefore, the unfavorable contours represent the limitation of the binding pocket. The fact that unfavorable contours (compound 7) are placed –CH2CONH (Figure 6B) suggests that a planar group, like an aromatic moiety, is required for increasing the inhibitory activity. The CoMFA (ffdsel) electrostatic contour map of antidiabetics compound 4 with the highest binding affinity and lowest binding affinity compound 7.
The green and yellow coloration (contour map) indicates a region of higher electron density with high binding affinity and lower electron density with less binding affinity, respectively. Five electrostatic interaction favorable contours are localized on ring and auxochrome of compound 4 as shown in Figure 5C. Lowering the electron density or electronegative substituents (yellow contour maps) in this region (Figure 5D), predict the highest binding activity enhancement. Increased electron density/ electropositive substituents (Figure 6C) and decreased in electron density/electropositive substituents (Figure 6D) increases the binding affinity of compound 7. This may be why compound 4 with more auxochrome attached, is more potent as antidiabetics than compound 7. In Figure 7 and Figure 8, CoMFA (uvepls) steric interactions are represented with red and blue colors, while the electrostatic interactions are represented with green and yellow colors. The bulky substituents are much favored around red regions (Figure 7E), while blue regions (Figure 7F) means that bulky groups are disfavored. The green zones (Figure 7G) exhibit that high electron-dense or electropositive substituents are favored, and yellow (Figure 7H) regions (lower electron density) increase activity only with electronegative substituents at these positions in compound 4. A small red contour (Figure 7E) position was found close to the compound 4, while the red contour map was located away from the compound 7 (Figures 8E-8H). This means that the substituents around these regions should be bulky, that is why compound 4 has the highest binding affinity than compound 7, another green zone is found close around compound 4, indicating that electron-donating character is favored and would exhibit high diabetic inhibitory activity. An increase in the electron density/ electropositive (green contour maps) in this region as shown in Figure 8G and decrease in electron density (yellow contour maps) in this region will increase the potency of compound 7.
Interpretation of Molecular Docking Results
The derivatives were docked to the receptor (PDB: 2QCT) and the energy values were computed using PyRx (Autodock vina). The outcome of docking studies is presented in Table 1. The energy values obtained were ranged from -5.8 to -9.2 Kcal/mol. The results indicate that compound 17 (-9.2 Kcal/mol) exhibited promising inhibitory activity in comparison to other compounds. The compounds interact with structure of Lyp with inhibitor I-C11 drives type 1 diabetes by binding with Glu50, Ser271, Arg266, Pro270, Tyr66, Asp41, Thr43, Arg33, Gln34, Lys32 etc. amino acid residues as shown in Figure 9. The inhibitory assay and molecular docking study reveal that compound 4 inhibits insulin epitope drives type 1 diabetes may be because of its hydrogen bond interactions with Gln63, Tyr7, and Tyr171 amino acid residues (Table 8).
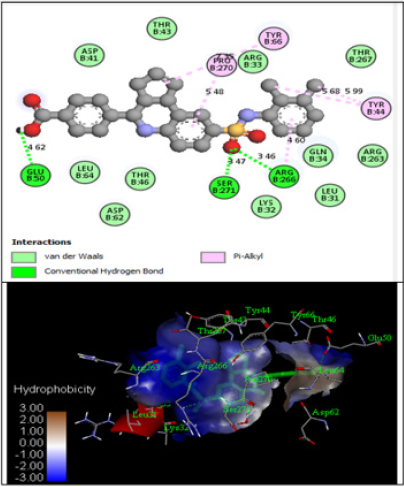
Figure 9: Docking interaction of the strongest active compound (Cpd 17).
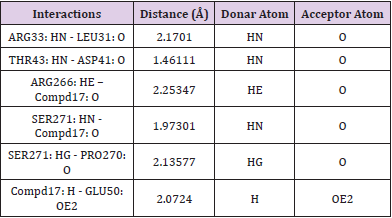
Table 8: Hydrogen bonding interaction of compound 17.
Interpretation of MDs Simulation
By examining the results of 2D-QSAR, 3D-QSAR, and molecular docking, compound 4 was utilized as the lead compound, and the predominant changed area dictated by the above outcomes was almost altered. The root means square deviation (RMSD) plot, temperature, kinetic energy, and potential energy plot of protein during the MD simulations are shown in Figure 10. The simulation result reveals that the RMSD tends to be steady and wavered approximately at 2.0 Å, the kinetic and potential energy is fluctuated approximately at 28,896.58 and -104,501 kcal/mol, respectively, after running 50000 steps (1ns), which implies that the structure of the complex is basically in a stable state. Molecular docking analysis of compound 4 was performed on the A-chain of simulated protein (PDB ID: 2QCT) as shown in Figure 10 using the 2016 discovery studio client, this did not result in an improvement in the number of hydrogen bond interactions (Figure 11). This was fundamentally similar to the underlying docking systems, thereby showing the efficiency of the docking. It also proposed that compound 4 formed a stable protein complex when protein was simulated to or beyond 301.48 K (Figures 10A- 10C).
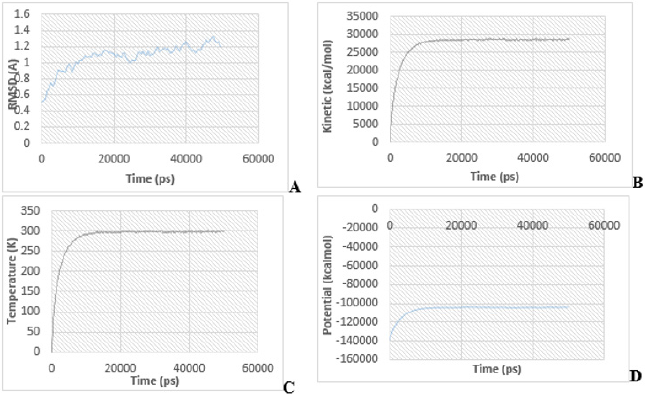
Figure 10: The product of molecular dynamic simulations during the 50000 steps NVT package.
A. the RMSD value of the protein diagram.
B. The kinetic energy plot of the protein.
C. The temperature value of the protein map.
D. The future energy content of the protein.
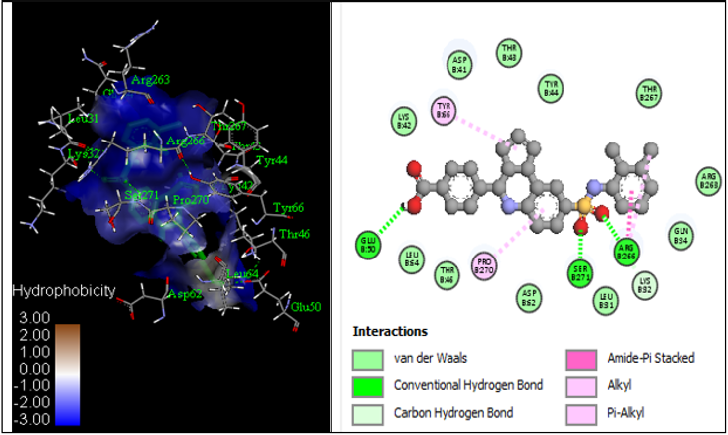
Figure 11: Molecular docking interactions of compound 17 with simulated protein structure.
Conclusion
In this study, a molecular modeling study was performed on 30 compounds as type 1 diabetes inhibitors using 2D-QSAR, 3D-QSAR, molecular docking, and MD simulations. The 2D-QSAR, CoMFA, and CoMSIA approaches were used to conduct the QSAR analysis and the final models were adequate based on the findings of the statistical validation. The contour maps obtained described the structural activity relationship (SAR) of the studied compounds and were capable of predicting the activity of the compound training set reliably (Figure 10D). The molecular docking analysis was then used to describe the effects of 3D-QSAR and to investigate the interactions between compound 4 and ligands; Tyr7, Gln63, and Tyr171 were identified as essential residues for inhibitory activity. However, under realistic conditions, the findings of molecular docking are refined by MD simulations to show the consistency of the association between protein and ligand. The proteinligand interactions described in the molecular docking phase are almost stable under dynamic conditions. We thus had a greater understanding of the SAR and the binding properties of compound 4 as a type 1 diabetes regulator using molecular simulation. We assume that these findings may be useful in the production of new type 1 diabetes inhibitors.
Acknowledgments
The authors gratefully acknowledge the Department of Chemistry, Ahmadu Bello University, Zaria (Samaru, Zaria-Nigeria); for computational studies, and as part of the Ph.D. thesis.
References
- Karri VVSR, Kuppusamy G, Talluri SV, Yamjala K, Mannemala SS (2016) Current and emerging therapies in the management of diabetic foot ulcers. Current medical research and opinion 32(3): 519-542.
- Kahn CR (1994) Insulin Action, Diabetogenes, and the Cause of Type II Diabetes. Diabetes 43(8): 1066-1085.
- Kahn CR, White MF (1988) The Insulin Receptor and the Molecular Mechanism of Insulin Action. The Journal of Clinical Investigation 82: 1151-1156.
- Hossain MU, Khan Md A, Rakib Uz Zaman SM, Ali MT, Md Islam S, et al. (2016) Treating diabetes mellitus: pharmacophore-based designing of potential drugs from Gymnema sylvestre against insulin receptor protein. BioMed Research International 14.
- (2015) WHO. WHO Factsheets.
- Wild S, Roglic G, Green A, Sicree R, King H (2004) Global prevalence of diabetes: estimates for the year 2000 and projections for 2030. DIABETES CARE 27(5): 1047-1053.
- Tabish SA (2007) Is Diabetes Becoming the Biggest Epidemic of the Twenty-first Century?. International journal of health sciences 1(2): V-VIII.
- Abuhammad A, Taha MO (2015) QSAR studies in the discovery of novel type-II diabetic therapies. Expert Opinion on Drug Discovery p. 1-43.
- Mayfield JA (1998) Diagnosis and classification of diabetes mellitus: new criteria. American family physician 58(6): 1355-1362.
- Bibi S, Sakata K (2016) Current status of computer-aided drug design for type 2 diabetes. Current computer-aided drug design 12(2): 167-177.
- Lerut J, Mathys J, Verbaandert C, Talpe S, Ciccarelli O, et al. (2008) Tacrolimus monotherapy in liver transplantation: one-year results of a prospective, randomized, double-blind, placebo-controlled study. Annals of surgery 248(6): 956-967.
- Malmberg K, Ryden L (1988) Myocardial infarction in patients with diabetes mellitus. European Heart Journal 9(3): 259-264.
- Herlitz J, Malmberg K, Karlson BW, Rydén l, Hjalmarson A (1988) Mortality and morbidity during a five‐year follow‐up of diabetics with myocardial infarction. Acta Medica Scandinavica 224(1): 31-38.
- Savage MP, Krolewski AS, Kenien GG, Lebeis MP, Christlieb AR, et al. (1988) Acute myocardial infarction in diabetes mellitus and significance of congestive heart failure as a prognostic factor. The American journal of cardiology 62(10): 665-669.
- Karlson BW, Herlitz J, Hjalmarson Å (1993) Prognosis of acute myocardial infarction in diabetic and non‐diabetic patients. Diabetic medicine 10(5): 449-454.
- Malmberg KA, Efendic S, Rydén LE (1994) Feasibility of insulin-glucose infusion in diabetic patients with acute myocardial infarction: a report from the multicenter trial: DIGAMI. Diabetes Care 17(9): 1007-1014.
- Malmberg K, Rydén L, Efendic S, Herlitz J, Nicol P, et al. (1995) Randomized trial of insulin-glucose infusion followed by subcutaneous insulin treatment in diabetic patients with acute myocardial infarction (DIGAMI study): effects on mortality at 1 year. Journal of the American College of Cardiology 26(1): 57-65.
- Malmberg K, Ryden L, Hamstent A, Herlitz J, Waldenström A, et al. (1996) Effects of insulin treatment on cause-specific one-year mortality and morbidity in diabetic patients with acute myocardial infarction. European heart journal 17(9): 1337-1344.
- Vitthal UB, Pratapro GS (2016) 3D QSAR and pharmacophore modeling on substituted cyanopyrrolidines as type-II anti-diabetic agents potential dipeptidyl peptidase-IV Inhibitors. Pharmacophore 7(5): 342-348.
- Yap CW (2011) PaDEL‐descriptor: An open source software to calculate molecular descriptors and fingerprints. Journal of computational chemistry 32(7): 1466-1474.
- Ballabio D, Consonni V, Mauri A, Claeys Bruno M, Sergent M, et al. (2014) A novel variable reduction method adapted from space-filling designs. Chemometrics and Intelligent Laboratory Systems 136: 147-154.
- Adhikari N, Amin SA, Saha A, Jha T (2017) Understanding chemico-biological interactions of glutamate MMP-2 inhibitors through rigorous alignment-dependent 3D-QSAR analyses. Chemistry Select 2(26): 7888-7898.
- Tosco P, Balle T, Shiri F (2011) Open3DALIGN: an open-source software aimed at unsupervised ligand alignment. Journal of computer-aided molecular design 25(8): 777-783.
- Tosco P, Balle T (2011) Open3DQSAR: a new open-source software aimed at high-throughput chemometric analysis of molecular interaction fields. Journal of molecular modeling 17(1): 201-208.
- Rizkallah PJ, Cole DK (2015) Weak TCR binding to an unstable insulin epitope drives type 1 diabetes.
- Trott O, Olson AJ (2010) AutoDock Vina: improving the speed and accuracy of docking with a new scoring function, efficient optimization, and multithreading. Journal of computational chemistry 31(2): 455-461.
- Humphrey W, Dalke A, Schulten K (1996) VMD: visual molecular dynamics. Journal of molecular graphics 14(1): 33-38.
- Phillips JC, Braun R, Wang W, Gumbart J, Tajkhorshid, et al. (2005) Scalable molecular dynamics with NAMD. Journal of computational chemistry 26(16): 1781-1802.
- Mac Kerell AD, Bashford D, Bellott MLDR, Dunbrack RL, Evanseck JD, et al. (1998) All-atom empirical potential for molecular modeling and dynamics studies of proteins. The journal of physical chemistry B 102(18): 3586-3616.
- Shapiro S, Guggenheim B (1998) Inhibition of oral bacteria by phenolic compounds. Part 1. QSAR analysis using molecular connectivity. Quantitative Structure‐Activity Relationships 17(04): 327-337.
- Jaiswal M, Khadikar PV, Scozzafava A, Supuran CT (2004) Carbonic anhydrase inhibitors: the first QSAR study on inhibition of tumor-associated isoenzyme IX with aromatic and heterocyclic sulfonamides. Bioorganic & medicinal chemistry letters 14(12): 3283-3290.
- Pourbasheer E, Aalizadeh R, Ardabili JS, Ganjali MR (2015) QSPR study on solubility of some fullerenes derivatives using the genetic algorithms-Multiple linear regression. Journal of Molecular Liquids 204: 162-169.
- Riahi S, Pourbasheer E, Ganjali MR, Norouzi P (2009) Investigation of different linear and nonlinear chemometric methods for modeling of retention index of essential oil components: Concerns to support vector machine. Journal of hazardous materials 166(2-3): 853-859.
- Tropsha A, Gramatica P, Gombar VK (2003) The importance of being earnest: validation is the absolute essential for successful application and interpretation of QSPR models. QSAR & Combinatorial Science 22(1): 69-77.
- Netzeva TI, Worth AP, Aldenberg T, Benigni R, Cronin MT, et al. (2005) Current status of methods for defining the applicability domain of (quantitative) structure-activity relationships: The report and recommendations of ecvam workshop 52. Alternatives to Laboratory Animals 33(2): 155-173.
- (2007) OECD, Guidance Document on the Validation of (Quantitative) Structure-Activity. Relationships [(Q)SAR] Models, Organisation for Economic Co-Operation and Developent, Paris, France.
- Aher YD, Agrawal A, Bharatam PV, Garg P (2007) 3D-QSAR studies of substituted 1-(3, 3-diphenylpropyl)-piperidinyl amides and ureas as CCR5 receptor antagonists. Journal of molecular modeling 13(4): 519-529.
