 Research Article
Abstract
Purpose: To assess the role of CT-textural features for differentiation of hepatocellular carcinoma (HCC) from intrahepatic peripheral cholangiocellular carcinoma (CCC) on single portal-venous phase contrast-enhanced CT whilst identifying the most significant discriminatory features.
Methods: 61 consecutive patients (mean age, 66.7 years; range, 38.0-88.7 years; 45 males) with newly diagnosed, biopsy-proven HCC (n=33) and CCC (n=28), who all received a portal-venous phase contrast-enhanced CT (CECT) for primary staging, were evaluated in this study. Using a standardized imaging protocol, volumes of interests (VOIs) were set in the tumor tissue excluding adjacent structures. Based on pyradiomics library, a total of 35 textural features were extracted from the VOIs, including 1st, 2nd and higher order features, and then compared between HCC and CCC. Additionally, a tumor-to-liver ratio was calculated using ROIs set in the same position as for CT-textural analysis.
Results: A highly significant difference (p<0.005) between HCC and CCC was observed for 1st order features Mean and Median. First order feature Maximum and 2nd order feature grey-level co-occurrence matrix inverse difference moment normalized (glcm Idmn) differed also significantly (p<0.05). Most combinations of the primarily highly significant features (Mean, Median) with other textural features also showed very good significance levels (p<0.005). Thresholds calculated for Mean, Median, Maximum and glcm Idmn resulted in sensitivities of 0.84/0.84/0.78/0.36, specificities of 0.55/0.55/0.58/0.68, PPVs of 0.68/0.69/0.68/0.57 and NPVs of 0.76/0.76/0.70/0.48, respectively. Specificity slightly improved for 2 feature combinations to 0.62 for 1st order Maximum + gldm Dependence NonUniformity. The 3-feature combination Maximum + Median + ngtdm Strength which demonstrated already significance on a standalone basis, yielded combined a considerably smaller p-value (p<0.008). Median tumor-to-liver attenuation ratio was 0.84(95% CI of 0.74-0.90) for CCC and 0.85(95% CI of 0.81-0.91) for HCC.
Conclusions: Our data indicates that CT textural analysis may aid differentiation of HCC from CCC in the single portal-venous enhancement phase compared to direct calculation of tumor-to-liver attenuation ratio showing significantly higher tumor attenuation and tissue homogeneity in HCC.
Main points:
a. Extract more information from a single portal-venous contrast phase.
b. Attempting to employ CT textural features to differentiate HCC and CCC.
c. Finding quantifiable parameters to assist clinicians in analysing the tumor’s tissue composition.
d. May enable an educated evaluation of an otherwise non-differentiable hepatic lesion.
Introduction
Hepatocellular carcinoma (HCC) and cholangiocellular carcinoma (CCC) are the most frequent primary hepatic malignancies [1]. Differentiation between HCC and intrahepatic CCC is achieved by considering clinical, laboratory and imaging findings [2]. In the typical clinical setting (e.g., liver cirrhosis, elevated alpha-fetoprotein and typical enhancement patterns) the diagnosis of HCC can be set already non-invasively [3]. However, clinical settings for occurrence of both HCC and CCC may overlap or be clinically ambiguous, also tumor markers may be found negative [4]. In these cases of clinical dilemmas, imaging has evolved to a major diagnostic tool with some morphologic and enhancement patterns being considered suggestive for each of these two entities [5-8]. Computed tomography (CT) is mostly the first imaging technique used for classification of lesions which have been newly detected by e.g., ultrasound or suspected clinically; it is also the modality which most frequently detects incidental hepatic lesions. As the best tissue contrast for abdominal CT-imaging is achieved in the portal-venous phase, most examinational protocols are constrained only to this phase. However, the portal-venous phase is at least capable to make the differentiation between HCC and CCC. HCC typically exhibits early enhancement (wash-in in the arterial phase) and early wash-out (in the late portal phase) in relation to liver parenchyma, whereas CCC mostly shows late post-equilibrium enhancement [9-11]. However, in the portal-venous phase both tumors are expected to increase their attenuation by >100% as a considerable overlap in tumor attenuation is the consequence and thus distinction between the two may be severely hampered [12]. Morphologic features like capsule formation, portal vein infiltration, radiologic evidence of cirrhosis, etc. are unable to distinguish between these tumors and therefore most of these tumors need to be differentiated histologically [12].
A novel non-invasive approach for tissue characterization has been increasingly tested and reported in the last years consisting of radiomics texture analysis [13]. Based on different textural features, differences in tumor attenuation as well as tumor heterogeneity, including those derived from the vascular network, are quantifiable and thus potentially beneficial for more accurate, profound tumor characterization. Due to the mentioned diagnostic challenges, we decided to retrospectively apply radiomics analysis to portalvenous CT image data in our own patient cohort consisting of both intrahepatic CCC and HCC that have been histologically proven to investigate potential discriminatory features.
Methods
This was a retrospective analysis of CT-image data in 61 consecutive patients (mean age, 66.7 years; range, 38.0-88.7 years; 45 males) with newly diagnosed, biopsy-proven HCC (n=33) and CCC (n=28); identified by a patient chart search at our institution between January 2014 and December 2018. Combined HCC and CCC were not included since too small of a number was available. Patients gave informed consent and our institutional ethic board committee approved the retrospective data evaluation and registered this study under the number 536/2019BO2. All patients who underwent contrast-enhanced CT in the portal-venous enhancement phase (65-75s delay) using thin-slice image data acquisition were included. Following CT-examinational parameters were used: 120kV photon energy, 200-250 mAs tube current, a soft tissue image reconstruction kernel, and 1-3 mm slice thickness for image reconstruction. Patients received 100 mL iodine contrast agent (Ultravist 370, Bayer Vital GmbH) which was given intravenously at a rate of 2mL/s followed by a 30 mL saline chaser.
Radiomics Analysis
Radiomics analysis was performed using radiomics software (Siemens Healthineers, Forchheim, Germany) that is based on the pyradiomics package, a python package for the extraction of radiomics features from medical imaging [14]. Radiomics evaluation was applied on thin-slice portal-venous image data sets. Volumes of interest (VOIs) were drawn in a manual fashion on the transversal scans using the largest cross-section diameter avoiding partial volume averaging due to neighboring blood vessels, calcifications or visible necrotic areas Figure 1 and Figure 2. The procedure of VOI setting was performed by a junior radiologist with 3 years of experience together with a senior radiologist with 25 years of experience in abdominal and oncologic imaging; in ambiguous cases a consensus was reached. The textural features used (n= 35) belonged to 1st order (energy, total energy, entropy, minimum, maximum, mean, median, interquartile range, mean absolute deviation, robust mean absolute deviation, standard deviation, skewness, kurtosis, variance, uniformity as well as 2D and 3D features) as well as their customized features (squared, squared root, logarithmic, exponential, log. sigma and wavelet data); 2nd and higher order features (grey-level co-occurrence matrix, greylevel size zone matrix, grey-level run length matrix, neighboring grey-tone difference matrix and grey-level dependence matrix), the latter including sub features described by the pyradiomics library (supplementary Table 1).
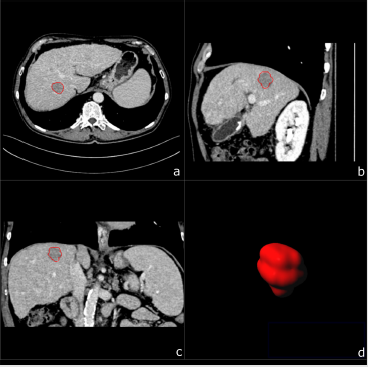
Figure 1: A 67-year-old male patient with biopsy confirmed HCC. Multiplanar image annotation in axial
a) sagittal
b) coronal
c) 3D reformats.
d) of the HCC lesion. From the resulting volume of interest CT textural features are extracted.
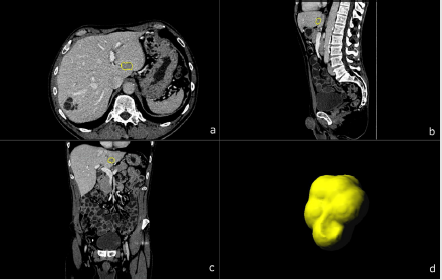
Figure 2: A 69-year-old male patient with biopsy confirmed CCC. Multiplanar image annotation in axial
a) sagittal
b) coronal
c) 3D reformats.
d) of the CCC lesion. Assessing figure 1 (HCC) and figure 2 (CCC) side by side highlights the difficulty of visual differentiation in a single (portal venous) phase.
Ratio Analysis
Median attenuation of the hepatic tumor in comparison to the liver was measured manually in Hounsfield units (HU) drawing a standardized region of interest (ROI) of minimum 3cm in diameter in the liver parenchyma excluding vessels as well as tumor. The ROI for the hepatic lesion was set in the same level as for the texture analysis whilst adapting its size individually.
Statistical Analysis
Statistical analysis was performed using Python 3.7.3. All parameters were tested by Kolmogorov-Smirnov test against a normal distribution with mean and standard deviation derived from the parameter values. The corresponding p-values are reported in line 1 of the Kolmogorov-Smirnov Test (Table 1). For some parameters the null hypothesis of normal distribution had to be rejected and thus the Wilcoxon rank sum test was used to compare features between HCC and CCC. A p-value <0.05 was considered to indicate statistical significance.
Receiver-operating characteristic (ROC) curves were generated by computing sensitivity and specificity at each observed cut-off. The optimal cut-off values were derived from the point on the ROC curve with the maximum Youden index, which was calculated as sensitivity+specificity 1. For these optimal cut-off values, sensitivity, specificity, positive and negative predictive values (PPV and NPV) as well as the area under the curve (AUC) in thresholds are listed in (Table 2). To test whether a weighted sum of two features could infer further predictions, the weighted sum for each possible combination of attributes (textural features) was calculated. The feature values were normalized in dividing by the maximum value of each textural feature obtaining feature weights as coefficients from a logistic regression against the chosen features.
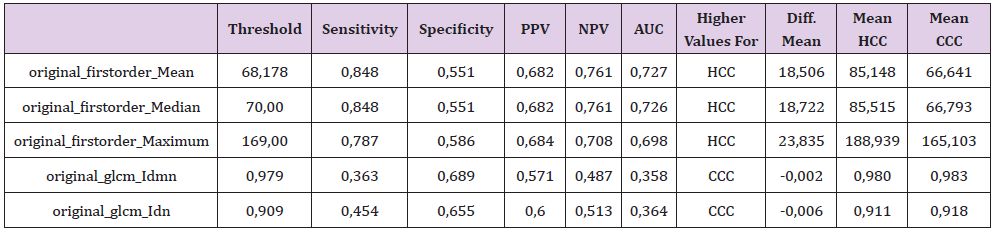
Table 1: Kolmogorov-Smirnov testing for the significant features with their corresponding p-values.
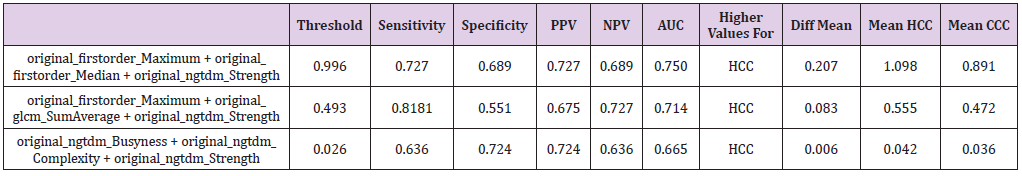
Table 2: The significant features with their corresponding sensitivity, specificity, positive and negative predictive values (PPV and NPV) as well as the area under the curve (AUC) at their optimal cut-off values calculated from the ROC curve with the maximum Youden index.
For a combination of two features, we used the equation given by
In( p / (1− p)) = a + b* X _1+ c* X _ 2
For a combination of three features, we used the equation given by
In( p / (1− p)) = a + b* X _1+ c* X _ 2 + d * X _ 3
In the study all feature combinations have been investigated. Therefore, also the repetition of multiple features with high similarity was analyzed. In order to include as much information as possible but not having features with high similarity in the final equations we ruled out feature combinations with high correlations.
Furthermore, to overcome the low number of lesions several in sample out of sample calculations have been performed with different test and train samples in terms of size and observations.
Results
A highly significant difference between HCC and CCC at the significance level alpha (p<0.005) was observed for the 1st order features Mean and Median. 1st order feature Maximum showed significant difference at the level alpha (p<0.05) whereas for glcm Idmn and glcm Idn we observed differences at the significance level alpha (p< 0.005) and (p<0.006), respectively (Table 2). Thresholds calculated for Mean, Median, Maximum and glcm Idmn yielded following values 68.1, 70, 169 and 0.97 resulting in sensitivity of 0.84/0.84/0.78/0.36, specificity of 0.55/0.55/0.58/0.68, PPV of 0.68/0.69/0.68/0.57 and NPV of 0.76/0.76/0.70/0.48, respectively. Most combinations with the features 1st order Mean and 1st order Median showed very good significance levels. Other combinations showed significant p-values <0.005 but low correlation values between the attributes, e.g., 1st order Maximum + original gldm DependenceNonUniformity, 1st order Maximum + ngtdm Contrast or glcm Idmn + glrlm RunEntropy. Thus, the equations below were devised to investigate statistical significance of two textural feature combinations:
Option 1 =0.905364/266* 1st order Maximum -0.1914/12436.77* gldm DependenceNonUniformity
Option 2 = 0.88499/266* 1st order Maximum - 0.17929/6.08E- 05* ngtdm Contrast
Option 3 = 0.04228/0.99* glcm Idmn - 0.00140/3.96* glrlm RunEntropy
According to the procedure above, threshold values were calculated for two feature combination for 1st order Maximum + gldm DependenceNonUniformity, 1st order + ngtdm Contrast and lastly glcm Idmn + glrlm RunEntropy resulting in threshold levels of 0.571, 0.593 and 0.040 yielding AUC of 0.713, 0.711 and 0.335 with sensitivity of 0.727, 0.727 and 0.454 and specificity of 0.620, 0.620 and 0.655. In addition, a three weighted textural feature combination was calculated analogously to above executed method. For the case of three textural feature combinations 1st order Maximum + 1st order Median + ngtdm Strength, 1st order_Maximum + glcm SumAverage + ngtdm Strength and ngtdm Busyness + ngtdm Complexity + ngtdm Strength showed strong p-values while also having relatively low correlations (Table 3). The first of these three feature combinations is of special interest as it contains both the attribute 1st order Median, which shows good significance on a standalone basis (p<0.005) as well as the combination of attributes 1st order_Maximum, and ngtdm_Strength, which only had a p-value of 0.005 and p<0.5 on a standalone basis each, but a considerably smaller p-value (p<.0007) in this combination. Here, the formula is calculated analogously to the two textural feature combinations:
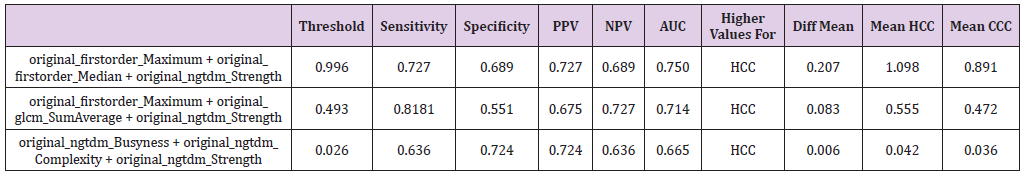
Table 3: Combination of three textural features with their corresponding sensitivity, specificity, positive and negative predictive values (PPV and NPV) as well as the area under the curve (AUC) at their optimal cut-off values calculated from the ROC curve with the maximum Youden index. For the explanation of the equations used, refer to the Results sections.
Option 1 = 0.52016/266 *original_firstorder_Maximum + 1.108768/129 *original_firstorder_Median - 0.04918/ 0.36806 *original_ngtdm_Strength
Ratio analysis
Median tumor-to-liver attenuation was 0.84 (95% CI of 0.74- 0.90) in CCC and 0.85 (95% CI of 0.81-0.91) in HCC Figure 3.
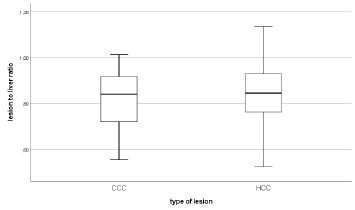
Figure 3: Median lesion to liver attenuation in CCC with 0,84 HU (95% CI of 0,74-0,90) and 0,85 HU (95% CI of 0,81- 0,91) for HCC.
Discussion
One central aspect of this retrospective evaluation of textural features consisted of the possibility to overcome the limitations related to one-phase portal-venous CT-protocols in the differentiation of HCC and CCC (refer to Figure 1 and Figure 2) whilst avoiding unnecessary radiation exposure due to multi-phase protocols required for accurately classifying their enhancement patterns. Our data shows that four of the thirty-five calculated radiomics features derived from the portal-venous enhancement phase proved significant for differentiation of HCC from CCC on a standalone basis. Whereas three of them represent differences in tumor tissue attenuation (1st order Mean, Median and Maximum) one is a measure of local tissue homogeneity (glcm Idmn). All of them yielded significantly higher absolute values for HCC compared to CCC. The use of combinations of features resulted in additional significances. Hence, the use of a combination of two textural features like 1st order Maximum and grey-level dependency matrix dependence non-uniformity or neighboring grey-tone difference matrix (ngtdm) contrast resulted in a slight increase in sensitivity, but also a slight decrease in specificity. The same was observed for the gray-level co-occurrence matrix (glcm) combined with the gray level run length matrix run entropy.
The grey-level dependency matrix dependence non-uniformity as well as the neighboring grey-tone difference matrix contrast is a measure of tissue homogeneity whereas the gray level run length matrix run entropy reflects tissue heterogeneity highlighting structural differences in particular of the vascular tumor network. With the additional use of three feature combinations strong significances were found for some additional textural features (1st order Maximum + 1st order Median + ngtdm Strength, 1st order_Maximum + glcm SumAverage + ngtdm Strength and ngtdm Busyness + ngtdm Complexity + ngtdm Strength) which as standalone proved not significant while showing relative low feature correlations. Except for the 1st order Maximum, the other textural features found significant in 3-features combinations reflect either tissue homogeneity (neighboring gray tone difference matrix strength or uniformity (neighboring gray tone difference matrix complexity). Notably, the higher order feature neighboring gray tone difference strength was present in all three-feature combination which proved significant. The 3-feature combination Maximum + Median + ngtdm Strength which demonstrated already significance on a standalone basis, yielded combined a considerably smaller p-value.
Interestingly, the feature ngtdm Strength proved in all three combinations significant. Based on these results, thresholds can be calculated for all these parameters for better discrimination between the two tumor entities. On the other side, the use of attenuation ratios between the tumor entities and the liver parenchyma yielded almost identical results with no discriminatory trend. Differentiation between HCC and CCC is critical as these two primary liver malignancies are the most frequent with different treatment strategies and prognoses. Many previous reports have addressed the role of imaging for HCC and CCC characterization. Besides tumor morphology and their accompanying features such as lymph node enlargement, presence of ascites or portosystemic venous collaterals, the main differences in the microvascular network and tumor architecture are beneficial for diagnosis as they are responsible for differences in enhancement patterns and tissue heterogeneity. Previous reports suggested the use of quadruple phase CT for assessment of the evolution of the relative CT attenuation of HCC and CCC for sufficient differentiation [12]. These are in line with the conclusions of the Barcelona-2000 EASL Conference where three- or four-phase CT imaging protocols or dynamic contrast-enhanced MRI examinations has been recommended for non-invasive diagnosis of HCC [3].
Accordingly, a 66% increase in detection of HCC foci by using triphasic CECT scanning was reported by Oliver [15]. However, multiphase protocols presume elective liver diagnosis and are negatively afflicted by increased radiation dose. Moreover, the optimal delay time for assessment of both wash-in and washout contrast kinetics as well as of post-equilibrium delayed enhancement vary considerably among HCC and CCC patients [10,12]. Additionally, atypical enhancement patterns have been reported in patients with CCC and liver cirrhosis where tumors may exhibit a nodular arterial enhancement followed by washout suggesting HCC [16]. This has been observed especially in smaller CCCs. Conversely, progressive or stable enhancement on postcontrast scans has been observed in a notable proportion of small HCCs which can challenge radiologists [17]. Moreover, cirrhosis due to a hepatitis B or C virus infection and accompanying nodular changes in liver parenchyma are important risk factors not only for development of HCC but also for CCC development [18,19] further blurring the etiological boundaries. Besides, the attenuation of the liver parenchyma itself depends on the degree of steatosis, fibrosis or iron deposition (all of them known for their oncogenic effects) having a direct impact on the relation to tumor attenuation. The ancillary, morphologic findings of HCC/CCC overlap also considerably. Invasion of the portal vein reaches >40% in both HCC and CCC and is therefore inadequate for discrimination between these two primaries [8,12]. Cholestasis is more common in CCC but can occur also with larger HCCs. Some of these tumors are isoattenuated to liver parenchyma and some others do not objectively enhance [12]. reported 26% of CCCs in their study to have experienced no substantial late enhancement and correlated these findings with the degree of tumor differentiation and amount of intratumoral fibrosis [10].
All these particularities limit to some extent the use of morphologic features and such that are based only on visual assessment of enhancement-patterns, proving in particular problematic for one-phase (portal-venous) examinational CTprotocols which are very frequent in the primary imaging diagnosis. Therefore, we aimed to evaluate the potential of radiomics feature analysis for accurate differentiation between HCC and CCC irrespective of their imaging characteristics. To the best of our knowledge, there are no other reports dealing with the use of texture analysis for discrimination between these two tumor entities. In the last years, texture analysis has been employed successfully for HCC profiling, prognosis and response prediction to different local and systemic therapies. found that skewness on arterial-phase CT-images predicted disease-free-interval after surgical resection in patients with singular HCC whereas Defour et al. reported a similar significant association between skewness and recurrencefree survival after HCC-resection, but on portal-venous- CT-images [20,21]. Kirryu et al. using non-enhanced CT-image data found skewness and other textural features to also correlate with diseasefree- survival [22]. Pretreatment contrast-enhanced CT-texture parameters proved to be also valuable predictive biomarkers of survival in HCC patients treated with sorafenib [23]. Other reports discussed the use of radiomics data for prediction of response to local transarterial chemoembolization [24-26]. By comparison, we found only one report on cholangiocellular carcinoma and potential correlations between molecular profiling and imaging phenotypes using CT-image data [27], albeit accompanying lymph nodes have been investigated by textural analysis [28, 29].
This study has some limitations. First, morphological and enhancement features of these tumors were not taken into consideration since in many of them additional enhancement phases (i.e., arterial or equilibrium phase) were not available. Second, histological tumor sub differentiation was also not considered as some tissue samples were analyzed by different institutions. Third, all feature combinations have been investigated also for the repetition of multiple features with high similarity. Addressing the issue of multiple testing including as much information as possible but not having features with high similarity in the final equations, feature combinations with high correlations were ruled out. Furthermore, to overcome the low number of lesions several in sample out sample calculations were performed with different test and train samples in terms of size and observations.
Conclusion
CT textural analysis may aid differentiation of HCC from CCC in the single portal-venous enhancement phase compared to direct calculation of tumor-to-liver attenuation ratio indicating significantly higher tumor attenuation values and tissue homogeneity in HCC.
References
- Stuver S, Trichopoulos D (2008) Cancer of the liver and biliary tract. In: Adami HO, Hunter D, Trichopoulos D, editors. Textbook of Cancer Epidemiology. 2nd ed. New York: Oxford University Press 173-195.
- Eldad S Bialecki, Adrian M Di Bisceglie (2005) Diagnosis of hepatocellular carcinoma. HPB (Oxford) 7(1): 26-34.
- Bruix J, Sherman M, Llovet JM, Beaugrand M, Lencioni R, et al. (2001) Clinical Management of Hepatocellular Carcinoma. Conclusions of the Barcelona-2000 EASL Conference. J Hepatol 35(3): 421-430.
- Koteish A, Thuluvath PJ (2002) Screening for hepatocellular carcinoma. J Vase Interv Radiol 13(9 Pt 2): S185-S190.
- Joo I, Lee JM, Yoon JH (2018) Imaging Diagnosis of Intrahepatic and Perihilar Cholangiocarcinoma: Recent Advances and Challenges. Radiology 288(1): 7-13.
- Choi SH, Lee SS, Kim SY, Park SH, Kim KM, et al. (2017) Intrahepatic Cholangiocarcinoma in Patients with Cirrhosis: Differentiation from Hepatocellular Carcinoma by Using Gadoxetic Acid-enhanced MR Imaging and Dynamic CT. Radiology 282(3): 771-781.
- Tsunematsu S, Chuma M, Kamiyama T, Miyamoto N, Yabusaki S, et al. (2015) Intratumoral artery on contrast-enhanced computed tomography imaging: differentiating intrahepatic cholangiocarcinoma from poorly differentiated hepatocellular carcinoma. Abdom Imaging. 2015 Aug; 40(6): 1492-1499.
- Kim R, Lee JM, Shin CI, Lee ES, Yoon JH, et al. (2016) Differentiation of intrahepatic mass-forming cholangiocarcinoma from hepatocellular carcinoma on gadoxetic acid-enhanced liver MR imaging. Eur Radiol 26(6): 1808-1817.
- Takayasu K, Ikeya S, Mukai K, Muramatsu Y, Makuuchi M, et al. (1990) CT of hilar cholangiocarcinoma: late contrast enhancement in six patients. AJR Am J Roentgenol 154(6): 1203-1206.
- Lacomis JM, Baron RL, Oliver JH 3rd, Nalesnik MA, Federle MP, et al. (1997) Cholangiocarcinoma: delayed CT contrast enhancement patterns. Radiology 203(1): 98-104.
- Ros PR, Buck JL, Goodman ZD, Ros AM, Olmsted WW, et al. (1988) Intrahepatic cholangiocarcinoma: radiologic-pathologic correlation. Radiology 167(3): 689-693.
- Loyer EM, Chin H, DuBrow RA, David CL, Eftekhari F, et al. (1999) Hepatocellular carcinoma and intrahepatic peripheral cholangiocarcinoma: enhancement patterns with quadruple phase helical CT--a comparative study. Radiology 212(3): 866-875.
- Lubner MG, Smith AD, Sandrasegaran K, Sahani DV, Pickhardt PJ, et al. (2017) CT Texture Analysis: Definitions, Applications, Biologic Correlates, and Challenges. Radiographics 37(5): 1483-1503.
- Michael G Wels, Félix Lades, Alexander Muehlberg, Michael Suehling (2019) General purpose radiomics for multi-modal clinical research, Proc. SPIE 10950, Medical Imaging 2019: Computer-Aided Diagnosis 1095046.
- Oliver JH, Baron RL, Carr BI (1997) CT imaging of hepatocellular carcinoma: CT-arteriography versus trophasic helical contrast CT. Radiology 205:144.
- Huang B, Wu L, Lu XY, Xu F, Liu CF, et al. (2016) Small Intrahepatic Cholangiocarcinoma and Hepatocellular Carcinoma in Cirrhotic Livers May Share Similar Enhancement Patterns at Multiphase Dynamic MR Imaging. Radiology 281(1): 150-157.
- Park HJ, Kim YK, Park MJ, Lee WJ (2013) Small intrahepatic mass-forming cholangiocarcinoma: target sign on diffusion-weighted imaging for differentiation from hepatocellular carcinoma. Abdom Imaging 38(4): 793-801.
- Patel T (2011) Cholangiocarcinoma--controversies and challenges. Nat Rev Gastroenterol Hepatol 8(4): 189-200.
- Peng NF, Li LQ, Qin X, Guo Y, Peng T, et al. (2011) Evaluation of risk factors and clinicopathologic features for intrahepatic cholangiocarcinoma in Southern China: a possible role of hepatitis B virus. Ann Surg Oncol 18(5): 1258-1266.
- Oh J, Lee JM, Park J, Joo I, Yoon JH, et al. (2019) Hepatocellular Carcinoma: Texture Analysis of Preoperative Computed Tomography Images Can Provide Markers of Tumor Grade and Disease-Free Survival. Korean J Radiol 20(4): 569-579.
- Brenet Defour L, Mulé S, Tenenhaus A, Piardi T, Sommacale D, et al. (2019) Hepatocellular carcinoma: CT texture analysis as a predictor of survival after surgical resection. Eur Radiol 29(3): 1231-1239.
- Mulé S, Thiefin G, Costentin C, Durot C, Rahmouni A, et al. (2018) Advanced Hepatocellular Carcinoma: Pretreatment Contrast-enhanced CT Texture Parameters as Predictive Biomarkers of Survival in Patients Treated with Sorafenib. Radiology 288(2): 445-455.
- Kiryu S, Akai H, Nojima M, Hasegawa K, Shinkawa H, et al. (2017) Impact of hepatocellular carcinoma heterogeneity on computed tomography as a prognostic indicator. Sci Rep 7(1): 12689.
- Park HJ, Kim JH, Choi SY, Lee ES, Park SJ, et al. (2017) Prediction of Therapeutic Response of Hepatocellular Carcinoma to Transcatheter Arterial Chemoembolization Based on Pretherapeutic Dynamic CT and Textural Findings. AJR Am J Roentgenol 209(4): W211-W220.
- Kloth C, Thaiss WM, Kärgel R, Grimmer R, Fritz J, et al. (2017) Evaluation of Texture Analysis Parameter for Response Prediction in Patients with Hepatocellular Carcinoma Undergoing Drug-eluting Bead Transarterial Chemoembolization (DEB-TACE) Using Biphasic Contrast-enhanced CT Image Data: Correlation with Liver Perfusion CT. Acad Radiol 24(11): 1352-1363.
- Li M, Fu S, Zhu Y, Liu Z, Chen S, et al. (2016) Computed tomography texture analysis to facilitate therapeutic decision making in hepatocellular carcinoma. Oncotarget 7(11): 13248-13259.
- Sadot E, Simpson AL, Do RK, Gonen M, Shia J, et al. (2015) Cholangiocarcinoma: Correlation between Molecular Profiling and Imaging Phenotypes. PLoS One 10(7): e0132953.
- Ji GW, Zhu FP, Zhang YD, Liu XS, Wu FY, et al. (2019) A radiomics approach to predict lymph node metastasis and clinical outcome of intrahepatic cholangiocarcinoma. Eur Radiol 29(7): 3725-3735.
- Zhu Y, Mao Y, Chen J, Qiu Y, Wang Z, et al. (2019) Preoperative Computed Tomography Features of Intrahepatic Cholangiocarcinoma for Predicting Lymph Node Metastasis and Overall Survival. J Comput Assist Tomogr 43(5): 29-735.
