 Research Article
Abstract
This research aims to manage the risks of spreading Corona-Virus over the world, by specifying the optimal statistical modeling to analyze the daily count of new cases of the COVID-19, therefore discrete distributions were needed. A new three-parameter discrete distribution has been improved named as a Discrete Marshall–Olkin Lomax (DMOL) distribution. Probability mass function and hazard rate are discussed. Based on the Maximum Likelihood Estimation (MLE) for the DMOL distribution parameters are discussed. A numerical study is done using the daily count of new cases in Argentina and Uganda. Monte Carlo Simulation has been performed to evaluate the restricted sample properties of the proposed distribution.
Keywords: COVID-19; Hazard Rate; Discrete Distributions; Survival Discretization; Maximum Likelihood Estimation; Marshall–Olkin Lomax
Abbreviations: DMOL: Discrete Marshall–Olkin Lomax; MLE: Maximum Likelihood Estimation; HF: Hazard Rate Function; DL: Discrete Lomax; CDF: Cumulative Distribution Function; MSE: Mean Square Error; KS: Kolmogorov Smirnov; SEs: Standard Errors
Introduction
In December 2019, Corona-Virus “COVID-19” was started in Wuhan, China, On March 11, 2020, World Health Organization (WHO) described COVID-19 as a pandemic. See Figures 1 & 2. Therefore, countries around the world have been increased their measures trying to decrease the spread rate of the COVID-19. To model daily cases and deaths in the world, a natural discrete Lindley distribution has been introduced by [1]. A discrete Marshall-Olkin generalized exponential distribution has been introduced by [2] to discussed the daily new cases of Egypt. The study was carried out by [3] where they used the Susceptible Infected Recovered (SIR) epidemic dynamics of the COVID-19 pandemic for modeling of the novel Coronavirus epidemic in Egypt. [4] studied a new discrete distribution, called discrete generalized Lindley, to analyze the counts of the daily coronavirus cases in Hong Kong and daily new deaths in Iran. An autoregressive time series model based on the two-piece scale mixture normal distribution has been used by [5] to forecast the recovered and confirmed COVID-19 cases. The daily new COVID-19 cases in China have been predicted by [6] and [7] by using the mathematical model, called susceptible, infected, and recovered (SIR). [8] used the logistic growth regression model is used for the estimation of the final size and its peak time of the coronavirus epidemic.
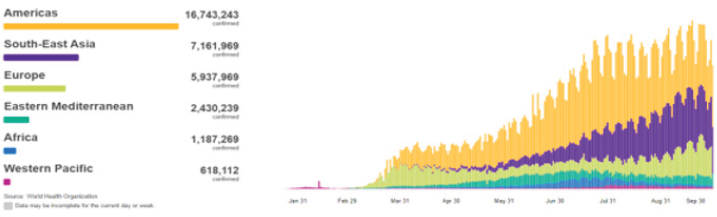
Figure 1: The situation for the daily new cases over the world by the WHO Region.
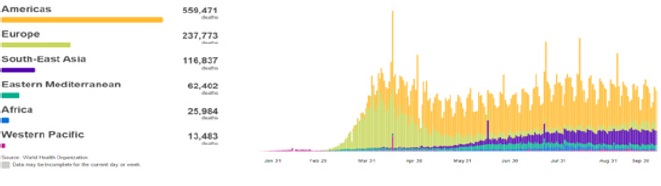
Figure 2: The situation for the daily new deaths over the world by the WHO Region.
In Lomax distribution: It is an important model for lifetime analysis, medical and business failure data, moreover it has been widely applied in a variety of contexts, it known as Lomax or Pareto type II distribution. Many authors have studied more applications by using extended Lomax distribution. [9] studied and introduced the Marshall-Olkin extended Lomax (MOL) distribution. The CDF, PDF and hazard rate function of MOL distribution with parameters γ ,δ and ϑ are given respectively, as


Figure 3 show the PDF and hazard rate function of the MOL distribution for different parameter. The MOL distribution is a flexible model which provides left-skewed, symmetrical, and reversed-J shaped densities. Its Hazard Rate Function (HRF) can provide decreasing, constant, increasing and decreasing.
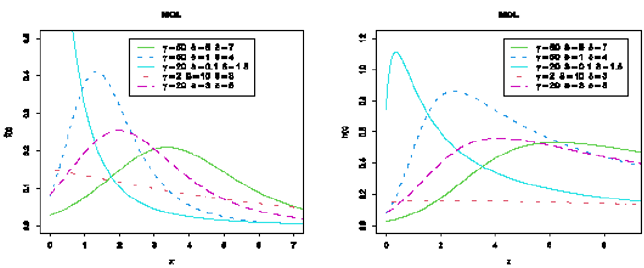
Figure 3: Plot of the PDF and HRF of the MOL distribution.
Discrete Burr type XII and discrete Lomax distributions have been introduced by [10]. Discrete Lomax (DL) distribution is helpful in modeling discrete data which exhibits heavy tails and can be useful in medical science and other fields. The PMF and CDF of DL distribution with parameters Ρ and ϑ are given respectively, as

The question may come to mind of any researcher: why do we need discrete distributions? Since In count data analysis, we see the most of the existing continuous distributions do not set suitable results for modeling the COVID-19 cases. The cause for this as we know that counts of deaths or daily new cases show excessive dispersion. In order to ensure members of the Argentina and Uganda society from the risks arising from the spread of Corona- Virus in Argentina and Uganda, this study aims to model the daily new cases and deaths of the COVID-19 employing a new statistical tool. An aspect of the importance of research is the necessity of mathematical and statistical modeling of the extent and spread of the Coronavirus. The discrete Marshall-Olkin Lomax distribution will be introduced that can be denoted as DMOL distribution. The rest of the paper is organized as follows. In Section 2, the survival discretization method. Discrete Marshall-Olkin Lomax distribution and maximum likelihood estimation of DMOL are introduced in Section 3. Section 4 Simulation study by using bias and MSE to inference MLE estimator. Daily new cases of COVID-19 in the case of Argentina and Uganda are used to validate the use of models in fitting lifetime count data are presented in Section 5. Finally, conclusions are provided in Section 6.
Survival Discretization Method
In the statistics literature, sundry methods are available to obtain a discrete distribution from a continuous one. The most commonly used technique to generate discrete distribution is called a survival discretization method, it requires the existence of Cumulative Distribution Function (CDF), survival function should be continuous and non‐negative and times are divided into unit intervals. The PMF of discrete distribution is defined in [11,12] as follows

Where S (x) = P(Χ ≥ x) = F (x;Φ), where F (x;Φ) is a CDF of continuous distribution and Φ is a vector of parameters. The random variable X is said to have the discrete distribution if its CDF is given by

The hazard rate is given by  The reversed failure
rate of discrete distribution is given as
The reversed failure
rate of discrete distribution is given as 
Discrete Marshall-Olkin Lomax Distribution
In this Section, we introduce a new flexible discrete model, can be donated as discrete Marshall-Olkin Lomax (DMOL) distribution. Parameter estimation of DMOL distribution are discussed by using MLE.
The DMOL Distribution
The continues Marshall-Olkin Lomax (MOL) distribution is introduced by [9]. The survival function, of the MOL distribution, is given by

Using the survival discretization method and survival function of MOL distribution, we define the PMF of the DMOL distribution as given below

Let ρ = e−δ then 0 < ρ <1, the PMF can be rewritten as following

Figure 4 shows the PMF plots for different values of the model parameters. From Figure 4, the PMF of the DMOL distribution is unimodal and right-skewed.
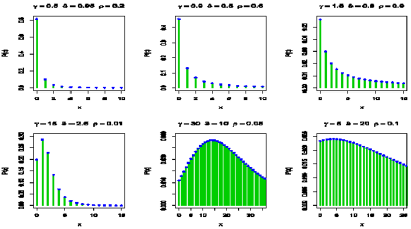
Figure 4: The PMF plots of the DMOL distribution.
The CDF of the DMOL distribution is given as below

Where N0 = {0,1, 2,...} .Survival function of the DMOL distribution is given by

The hr function of the DMOL distribution is given by

Figure 5 shows the HRF plots of the DMOL distribution. It is noted that the shape of the HRF is increasing, left-skewed and decreasing.

Figure 5: The HRF plots of the DMOL distribution.
Parameter Estimation
The unknown parameters of the DMOL distribution are obtained by the Maximum Likelihood Estimation (MLE) method. This method
is based on the maximization of the log-likelihood for a given data set, assume that  is a random sample of size n
from a DMOL (γ , P,ϑ ) distribution. The log-likelihood function becomes
is a random sample of size n
from a DMOL (γ , P,ϑ ) distribution. The log-likelihood function becomes

Hence, the likelihood equations are

The estimate of the parameter by using MLE, which can be obtained by a numerical analysis such as the Newton–Raphson algorithm.
Simulation Study
A simulation study is assumed to evaluate and compare the behavior of the estimates with respect to their bias and Mean Square Error (MSE). We generate 10000 random sample 1 2 , ,..., n x x x of sizes n = 50, 70, 130 and 200 from DMOL distribution. Different sets of parameters are obtained.
The MLE of γ , P and ϑ are computed. Then, the bias and MSE of the estimates of the unknown parameters are computed. Simulated outcomes are listed in Tables 1 & 2 and the following observations are detected.
The bias and MSE decrease as sample sizes increase for all estimates (see Tables 1 & 2).
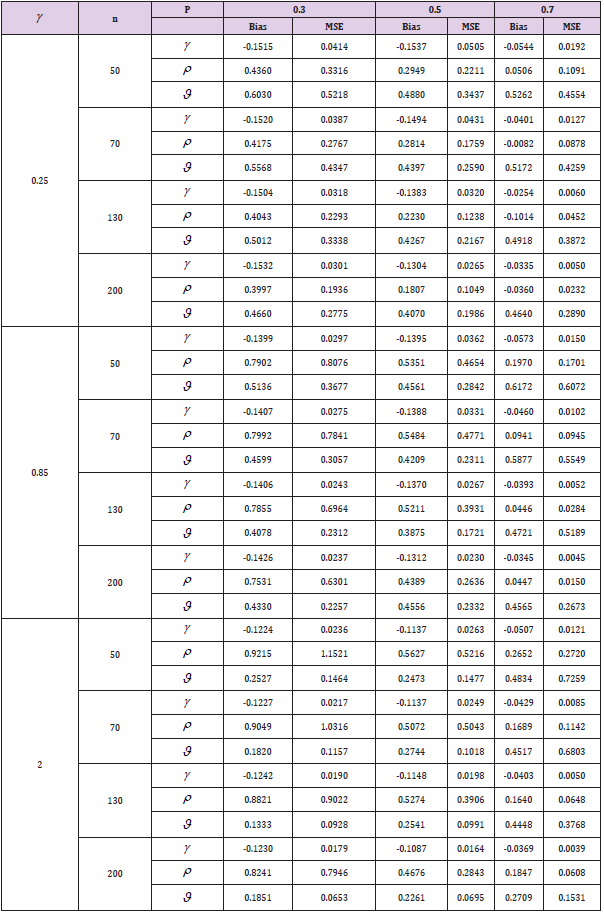
Table 1: Bias and MSE of parameters of DMOL distribution when ϑ=0.5.

Table 2: Bias and MSE of parameters of DMOL distribution when ϑ=1.5.
The bias and MSE of MLE for ρ estimate is increasing with increase γ and fixed ρϑ.
The bias and MSE of MLE for ϑ,γ estimates are decreasing with increase γ and fixed ρ ,ϑ.
The bias and MSE of MLE for ρ estimate is decreasing with increase ρ and fixed γ ,ϑ.
The bias and MSE of MLE for ϑ,γ . estimates are decreasing with increase ϑ and fixed ρ ,γ
Application Analysis
In this section, the DMOL distribution is fitted to more famous fields of survival times of Covid-19 with different country including as Argentina and Uganda. We compare the fits of the discrete Marshall-Olkin generalized exponential (DMOGEx) [2] model, discrete generalized exponential (DGEx) [13], Natural Discrete Lindley (NDL) [1], discrete Gompertz exponential (DGzEx) [4], discrete Burr (DB) [14], discrete Lindley (DLi) [15], discrete Lomax (DLo) [10] and Geometric models in Tables 3 & 4.
Table 3: ML estimates, K-S, P-values, W* and A* for COVID-19 data in Argentina data.
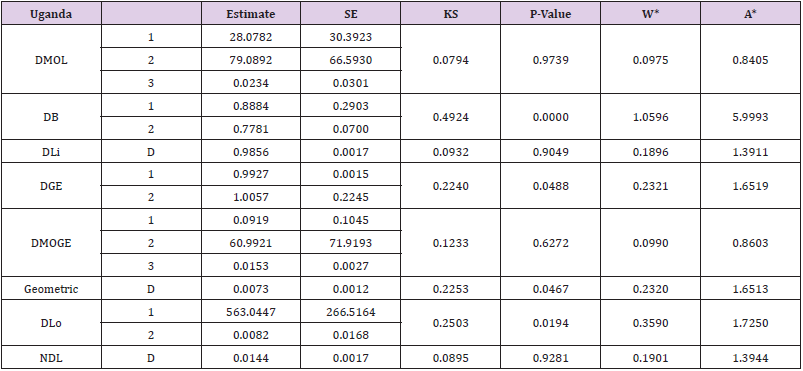
Table 4: ML estimates, K-S, P-values, W* and A* for COVID-19 data in Uganda data.
Tables 3 & 4 provide values of Cram´er-von Mises (W*), Anderson- Darling (A*) and Kolmogorov- Smirnov (KS) statistic along with its P-value for the all models fitted based on Two real data sets. In addition, these tables contain the MLE and Standard Errors (SEs) of the parameters for the considered models [16]. The fitted DMOL, PMF, CDF, PP-plot and QQ-plot of the four data sets are displayed in Figures 6 & 7, respectively. These figures indicate that the DMOL distribution get the lowest values of W*, A*, KS and largest P-value, among all fitted models.
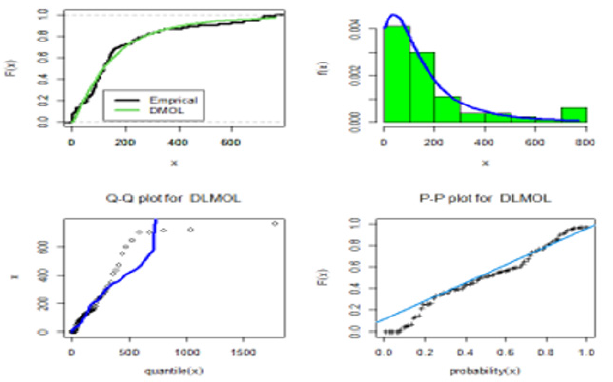
Figure 6: Estimated PMF, CDF, PP-plot and QQ-plot of DMOL for COVID-19 data in Argentina data.
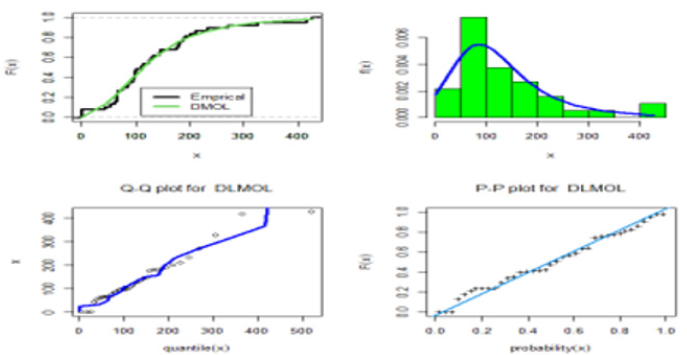
Figure 7: Estimated PMF, CDF, PP-plot and QQ-plot of DMOL for COVID-19 data in Uganda data.
a. Firstly: This is a COVID-19 data belong to Argentina of 80 days, that is recorded from 12 march to 30 May 2020. This data formed of daily new cases. The data are as follows: 2, 12, 14, 0, 11, 9, 32, 0, 27, 30, 0, 67, 76, 0, 201, 0, 87, 101, 55, 75, 146, 88, 79, 132, 88, 98, 103, 74, 87, 80, 134, 46, 0, 277, 84, 141, 121, 96, 90, 55, 121, 113, 124, 143, 139, 222, 137, 54, 127, 182, 103, 172, 56, 149, 118, 123, 154, 229, 225, 150, 244, 110, 244, 285, 410, 161, 345, 326, 263, 303, 438, 474, 648, 718, 704, 723, 552, 600, 705, 769.
b. Secondly: This is a COVID-19 data belong to Uganda of 37 days, that is recorded from 17 August to 22 September 2020. This data formed of daily new cases. The data are as follows: 66, 60, 43, 53, 94, 0, 416, 97, 99, 64, 98, 0, 232, 0, 132, 84, 65, 75, 176, 65, 186, 128, 109, 124, 201, 190, 86, 326, 96, 179, 145, 143, 114, 210, 427, 270 and 181.
Concluding Remarks
In this article, with the aim of managing the risk of spreading Coronavirus in Argentina and Uganda, we proposed and studied the discrete Marshall–Olkin Lomax distribution. The maximum likelihood estimation method is discussed to estimate the parameter of DMOL distribution. Monte Carlo Simulations are obtained to evaluate the restricted sample properties of the DMOL distribution. We prove empirically that the DMOL model reveals its superiority over other competitive models as Marshall-Olkin generalized exponential, discrete generalized exponential, natural discrete Lindley, discrete Gompertz exponential, discrete Burr, discrete Lindley, discrete Lomax and Geometric for analysis daily new cases of the COVID-19 in the case of Argentina and Uganda. These figures indicate that the DMOL distribution gets the lowest values of W*, A*, KS, and the largest P-value, among all fitted models.
References
- Al-Babtain AA, Ahmed AH N, Afify AZ (2020) A New Discrete Analog of the Continuous Lindley Distribution, with Reliability Applications. Entropy 22(6): 603.
- Almetwally EM, Almongy HM, Saleh HA (2020) Managing Risk of Spreading" COVID-19" in Egypt: Modelling Using a Discrete Marshall–Olkin Generalized Exponential Distribution. International Journal of Probability and Statistics 9(2): 33-41.
- Hasab AA, El-Ghitany EM, Ahmed NN (2020) Situational Analysis and Epidemic Modeling of COVID-19 in Egypt. Journal of High Institute of Public Health 50(1): 46-51.
- El-Morshedy M, Altun E, Eliwa MS (2020) A new statistical approach to model the counts of novel coronavirus cases. Research Square.
- Maleki M, Mahmoudi MR, Wraith D, Pho KH (2020) Time series modelling to forecast the confirmed and recovered cases of COVID-19. Travel Medicine and Infectious Disease 37: 101742.
- Nesteruk I (2020) Statistics-based predictions of coronavirus epidemic spreading in mainland China, Innovative Biosystems and Bioengineering 4(1): 13-18.
- Batista M (2020b) Estimation of the final size of the coronavirus epidemic by the SIR model.
- Batista M (2020a) Estimation of the final size of the coronavirus epidemic by the logistic model.
- Rao GS, Ghitany ME, Kantam RR L (2009) Marshall–Olkin extended Lomax distribution: An economic reliability test plan. International Journal of Applied Mathematics 22(1): 139-148.
- Para BA, Jan TR (2016) On discrete three parameter Burr type XII and discrete Lomax distributions and their applications to model count data from medical science. Biometrics & Biostatistics International Journal 4(2): 1-15.
- Roy D (2003) The discrete normal distribution. Communications in Statistics-theory and Methods 32(10): 1871-1883.
- Roy D (2004) Discrete rayleigh distribution. IEEE Transactions on Reliability 53(2): 255-260.
- Nekoukhou V, Alamatsaz MH, Bidram H (2013) Discrete generalized exponential distribution of a second type. Statistics 47(4): 876-887.
- Krishna H, Pundir PS (2009) Discrete Burr and discrete Pareto distributions. Statistical Methodology 6(2): 177-188.
- Gómez-Déniz E, Calderín-Ojeda E (2011) The discrete Lindley distribution: properties and applications. Journal of Statistical Computation and Simulation: 81(11): 1405-1416.
- Alamatsaz MH, Dey S, Dey T, Harandi SS (2016) Discrete Generalized Rayleigh Distribution. Pakistan journal of statistics 32(1): 1-20.
