 Research Article
Abstract
In an effort to orient more students towards a STEM career, the Texas public school system has developed a series of graduation programs starting as early as ninth grade based on labor-market criteria that are intended to improve the number of graduates seeking STEM careers. This evaluation discovered that first- and second-semester general chemistry (Chem I and II, respectively) students in the study (n = 4113) were confident in their career choices but the indicators of success evaluated did not support students’ confidence. A small positive correlation of how prepared students feel about their confidence in their career choice was produced. Chem I and II on-sequence students statistically outperformed the corresponding off-sequence students, but also concluded was that as confidence in career choice rose, entering automaticity skills (what students can do without a calculator as measured by the Math-Up Skills Test (MUST)) and course averages decreased. The majority of the unsuccessful students scored below average on the MUST but were confident in their future careers. The majority of the non-STEM majors had low MUST scores and struggled with successful completion of the courses. The majority of the STEM majors sought degrees in healthcare professions and completed the course with averages higher than the other subgroups except the small group of students seeking a dual career in healthcare and engineering, which entered with the highest MUST score average and completed the courses with the highest overall average.
Keywords: General chemistry; Chemical education research; Career confidence; Health professions; STEM and non-STEM student success; Automaticity
Introduction
Retention and degree completion rates for the last four decades have remained stagnant [1]. Efforts are currently being made to increase retention rates at many universities because graduation rates are expected to improve when there is an increased retention of students from first-to-second year [1]. Congruence of career interest to a major is one of the essential components that must be in place for a productive first-year academic performance. This study seeks to understand students’ incoming background characteristics and how precollege preparation impacts preparedness and career choice leading to success in first- and second-semester general chemistry (Chem I and II, respectively), both considered gateway courses for many future STEM majors.
Literature Review
Career-development endeavors without foundational skills combined with appropriate psychosocial integration delays students’ ability to enter the workforce even when an undergraduate degree is attained. The essential components of first-year academic performance are “academic preparation, motivation, and career interest-major congruence” [1, p. 187]. When gaps exist in this triad, then delays to entering the workforce exist. For institutions that have introduced first-year seminars, career-planning activities are usually included. A student at UT Austin “tweeted” (March 2020) about why are students immediately sandwiched into a specific degree plan, supposedly supporting a career path, and not being given more opportunities to explore alternatives that might prove to be more in sync with their future career choice, just to meet the “mandate” of completing a 4-year degree within the allotted timeframe. The official answer centers on cost to students, who when they take more than four years to complete required courses, they pay more tuition but it also may reflect on the quality of the university. The University of Texas at Austin reported (2013) that students who graduate on time spend 40% less than those who require six years. USA Today [2] published, most college students at public universities complete their bachelor’s degree in six years, according to a study by the non-profit organization, Complete College America.
Another reason given for students not finishing their degrees within the appropriate timeframe is that entering freshmen do not envision on how college connects them with a career when their degree is completed. According to the National Center for Education Statistics about 80% change their majors at least once before they graduate, which in turn may require students to obtain additional loans. Texas pre-college students are being encouraged to identify a career path by the ninth grade-well before substantive “cognitive development and acquisition of foundational skills” are laid [1, p. 182]. The broad scope of the Texas Education Agency (TEA) graduation programs is to include occupations that meet labormarket criteria in order for students to have more opportunities to engage in STEM-related occupations, which align within various endor Sements. Career and technical education (CTE) is the practice of teaching specific career skills to students starting in middle school and continuing to post-secondary education. Currently, CTE is split into 14 career clusters that apply to different high-demand careers:
a. Agriculture, Food, & Natural Resource,
b. Architecture & Construction,
c. Arts, Audio/Visual Technology, & Communications,
d. Business Management & Administration now combined with Marketing & Finance,
e. Government & Public Administration now combined with Law, Public Safety, Corrections, & Security,
f. Education & Training,
g. Health Science,
h. Hospitality & Tourism,
i. Human Services,
j. Information Technology,
k. Manufacturing,
l. Science, Technology, Engineering, & Math (STEM),
m. Transportation, Distribution, & Logistics and
n. Energy.
The current Texas program allows the state “to meet the federal program approval requirements within the ‘Strengthening CTE for the 21st Century Act’ (Perkins V)” [3]. These career clusters are specialized areas in occupations with high demand, which are supported by students being able to complete various certifications prior to high school graduation, which are also recognized as postsecondary credentials.
Texas has four graduation plans currently in use where students are to complete 22 credits or 26 credits to graduate (typically it takes one year of schooling to complete one credit). The two plans with 26 credits are those recommended for the collegebound student and include four credits in each of the following: English, mathematics, science and social studies with the remaining credits needed devoted to languages other than English, speech, physical education, and electives. Students who select the STEM endorSement complete the CTE courses with a final course from the STEM-career cluster (computer science, mathematics, science or any combination of two). The remaining endorSements (business & industry, public services, arts & humanities, and multidisciplinary studies) for all college-bound students must also include the above mentioned four years of mathematics and science. It is possible to earn more than one endorSement as long as the foundational requirements are met.
Methods
Institutions
The Networking for Science Advancement (NSA) team is certain that over 90% of the students who agreed to participate in this evaluation entered the nine participating Texas institutions with exposure to the same state-mandated, isomorphic curriculum. Three of the schools are Hispanic Serving Institutions (HSIs) and the other six are Hispanic-emerging institutions, which we will refer to as e-HSI. Of the 36 public universities in Texas only one is not a Historically Black Colleges and Universities (HBCU), HSI or e-HSI institution. See Table 1 for a brief profile of the participating universities. The variations in sizes of these participating 4-year universities with both public and private orientations, and the data on full-time student status, mix of graduation rates and grant availability give a representative view of this large, majorityminority state (one of only five in the USA) and serve to provide a substantive level of confidence in the impacts of prior knowledge and experiences on students’ success levels in general chemistry. All the courses at the nine participating universities are offered as sections appropriate for science majors.
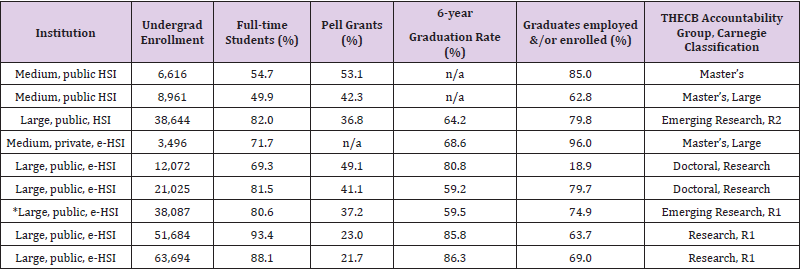
Table 1: Selected descriptors of participating institutions [4].
Abbreviations: HSI = Hispanic Serving Institution, Carnegie classifications: R1, R2 = Research university and level. n/a = not available. *Since these data were collected, this e-HSI has become an HSI, September 2020.
The professors who contributed student data have varied academic backgrounds. Three have specialties in chemical education research (CER), one holds an MS in chemistry, and five hold terminal degrees in bench research but have post-doctoral experience in CER. Years of classroom experience varies from 5 to around 40 years. The last author is the NSA team leader and holds a doctorate in CER. Professors were under no restrictions as to how their classes were conducted making this study as realistic as possible.
Population
Almost 93% of the population studied (n = 4113) graduated from a Texas high school. TEA is the governing body that regulates what is taught (i.e., Texas Essential Knowledge and Skills = TEKS) and how the isomorphic curriculum is assessed (i.e., State of Texas Assessment of Academic Readiness = STAAR with five end-of-course assessments in Algebra I, English I and II, U.S. History and Biology required for graduation and to be eligible for automatic college admission students must also complete an Algebra II course). TEA also places a great deal of emphases on the career-orientation of students starting in middle school (see above). Students in this study are enrolled in Chem I or Chem II either in on- or off-sequence classes; on-sequence students enroll in Chem I in the fall Semester and Chem II in the spring with off-sequence students enrolling in reverse Semesters. In Table 2 find the population demographics as to the breakdown of gender, classification and intended major. In Chem I on, Chem II on and Chem II off, female enrollment exceeds that of males. In Chem I off-sequence, the gender distribution is about equal with males slightly edging out females. Overall, female enrollment is close to two-thirds as compared to male enrollment.
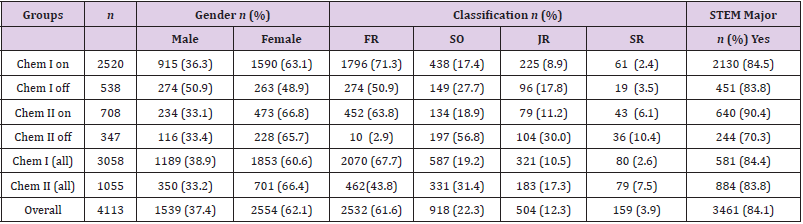
Table 2: Student demographics.
Note: Sums of columns do not equal 100% because some students chose not to report their classification, gender or reported being non-binary and were subsequently omitted due to small numbers.
The largest percentage (61.3%) of students are enrolled in Chem I in the fall (n = 2520). Only about one-third of the Chem I population (n = 3058) continued to Chem II (n = 1055). Most of the enrollees in Chem I and II on-sequence and Chem I off-sequence are freshmen with the greatest percentage of Chem II off-sequence students being classified as sophomores. The population reporting to be STEM-oriented ranged from a low of 70.3% in Chem II offsequence to 90.4% in Chem II on-sequence with an overall average of 84.1% or n = 3461 students who are seeking STEM degrees. Students who completed the courses with less than 10% overall average were not included in the various analyses nor were the small number of students classified as post-baccalaureates.
Diagnostic Instrument
The original quiz that became what the NSA team named the MUST (Math-Up Skills Test) was generated by Hartman and Nelson [5]. The MUST is a hand-graded, 15-minute assessment with 20 open-ended questions given to the students during the first week or two of classes. There are five types of arithmetic exercises: multiplication (questions 1, 2, and 3), division (questions 4, 6, 7, 8, and 16), fraction simplification (questions 9, 10, 17 and 18), logarithms and exponents (questions 5, 12, 13, 14, 15), and symbolic algebraic-counting manipulation (questions 11, 19, and 20).
A copy of the MUST and answers are available from a previous publication [6]. The MUST has a very large Cohen’s d effect size of 1.43 and 1.20 for Chem I and II, respectively. Since each response on the MUST has only one correct answer (the assessment is not multiple choice), the Kuder-Richardson formula 20, rKR20 (similar to Cronbach’s alpha) is appropriate to determine the reliability of the MUST. The MUST has consistently reported good reliability as it does in this study of 0.874 (the less stringent Cronbach’s alpha = 0.875). The practical use of the MUST is well-established by the NSA Team [6-9], and its use documents that students’ enteringautomaticity skills (what they can do mathematically without a calculating device) is a valid predictor of how successful they will be in Chem I and Chem II.
Research Question
At the end of the Semester, final course grades (determined as a percentage of points earned out of total points possible) were collected for students from each class as an output measure (dependent variable) indicative of course completion. The major inputs of concern are students’ MUST scores used to determine incoming preparation needed for successfully completing Chem I and Chem II, split by the students who are either enrolled in on- or off-sequence courses. Other self-reported inputs include students’ self-reported preparedness and career expectation(s) as measured by their confidence level (Likert scale) for their chosen career with specific attention paid to health professions (seeking a medical doctor or other) and/or engineering (any and all).
What indicators determine if students who enter general chemistry with above average confidence in their career choice are appropriately matched with their career goals?
Results
Indicators of Successful Performance
In this study students’ final course averages (Table 3) were statistically different (p < 0.05) between the on- and off-Semesters for both Chem I (n = 3058) and Chem II (n = 1055). For Chem I, the class average (SD) (SEM) was 76.6 (15.9) (0.316) for on-sequence students (n = 2520) and 68.6 (18.1) (0.782) for off-sequence students (n = 538). For Chem II, the class average (SD) (SEM) was 81.4 (12.0) (0.452) for on-sequence students (n = 708) and 64.4 (18.7) (1.00) for off-sequence students (n = 347). Since there is a statistical difference between these groups, we will consider them separately for some of this evaluation and then consider them together as Chem I and II, and finally split the population into various STEM and non-STEM course-major groups. Likewise, in Table 3, view the entering MUST scores where statistical differences at the p < 0.05 level also existed. Chem I on-sequence outperformed offsequence; Chem II on-sequence outperformed off-sequence. The percentage of Chem I-off unsuccessful students is about 1.5 times that of Chem I-on; percentage of unsuccessful Chem II-off is about 3.5 times that of Chem II-on. (The NSA team has another paper specifically on unsuccessful Hispanic general chemistry students [11].) Aligning the MUST averages from low to high (Chem II off, Chem I off, Chem I on and Chem II on), these means perfectly align with the course averages and percentage of successful students.
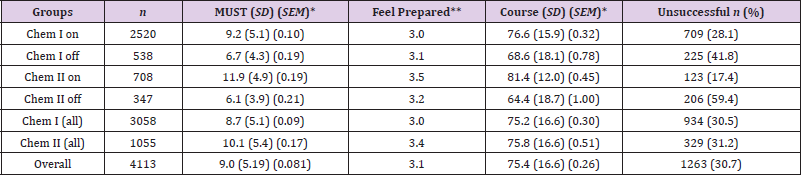
Table 3: Diagnostic assessment means and course averages.
*p < 0.05 **Likert scale (1-5): 1 = not prepared, 5 = very prepared.
The demographic indicators explored are gender, Hispanic ethnicity, pre-college academic preparation (i.e., participation in one or more high school chemistry courses), highest mathematics course concurrently enrolled or degree-requirement completed, parents’ education, students’ residence during high school based on the first two digits of their reported zip code and their current employment status. Of the population who agreed to participate in this IRB-approved student (n = 4113), 92.8% of the students attended Texas secondary schools prior to admittance into one of the nine universities (three HSIs and six e-HSIs). The greatest number of unsuccessful students were enrolled in Chem II offsequence (59.4%) followed by the off-sequence Chem I students (41.8%). The most successful students were members of the Chem II on-sequence class who felt the most prepared (3.5 out of a 5-point Likert scale). Students’ feelings of preparedness for their respective course even though positive proved poorly correlated to their confidence in their career choice, r = 0.163 (more on this observation to come).
Reported in Table 4 are the demographics on the background of students as to their preparation in chemistry, mathematics, and their first-generation status along with percentage of the students of Hispanic/Latinx ethnicity. Most students (98.7%) report to have completed one or more high school chemistry course(s). This is especially true for the on-sequence students where less than 1% have not completed at least one precollege course. The Chem II offsequence students who completed the course with the lowest overall average of 64.4% (Table 3) also reported the highest percentage of students who have never taken a prior chemistry course. Many (but not all) universities report completion of college algebra as a prerequisite for enrollment in Chem I. Using college algebra as the appropriate course needed to meet the mathematics level needed to enroll in Chem I and completion of pre-calculus an appropriate level needed to enroll in Chem II, less than half of the students have completed the appropriate level of mathematics necessary to succeed. Between 30-40% of the students consider themselves to be members of a family where no parent holds a 4-year degree or a member of a family where they are in the first-generation to go to college. The percentage of this population that is of Hispanic ethnicity is 36.7%. All participating institutions were either HSIs or e-HSIs where the overall undergraduate student body needs to be over 25% Hispanic or between 16-25% Hispanic, respectively. The Chem I- and II-off classes had more first-generation and Hispanic students than the Chem I and Chem II on-sequence classes.
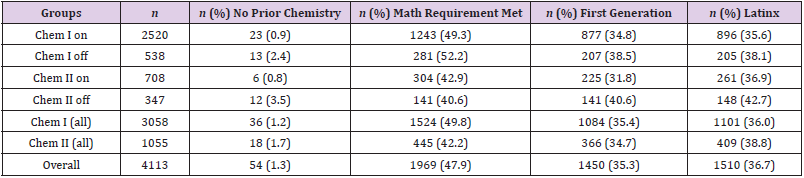
Table 4: Selected demographics: chemistry and mathematics background, first generation, and Hispanic ethnicity.
In Table 5, note that about half as many Chem II-off students live in university-supported housing as compared to the other groups. Over a fourth of the students are employed with the Chem II-off group having the greatest percentage (50%) working and most of these students (85%) work off campus or both on and off. Only about 25% of the students work on campus. The impact of employment on students’ course averages becomes very apparent in Table 6. Overall students who do not work have a higher course average than those who do, and there is a general linear decline of each group of students as number of hours employed increases. Except for Chem I-on students (Figure 1), there is a slight bump in course average for the students who work 1-10 h/week. There was a similar improvement seen in the recently accepted paper by the NSA team on Chem II students [9]. The most obvious divide is the downfall of Chem II students when on/off semesters are combined; with a successful class average being over 69.5%, note that only those who do not work or only work 1-10 h/week successfully complete the courses. Almost the same trend is true for Chem I students, but here the divide does not appear until the students work 21 or more hours per week. For Chem II-off students unsuccessful averages predominate (i.e., the only student group with a successful average were the Chem II males who worked 1-10 h/week).
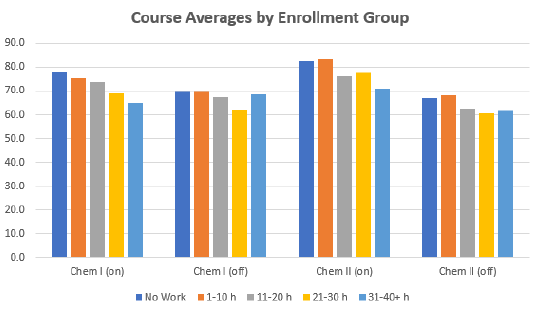
Figure 1: Course averages by enrollment group indicative of number of hours employed. Note the general decline in course averages in each course as employment hours increase.

Table 5: Work history of students.
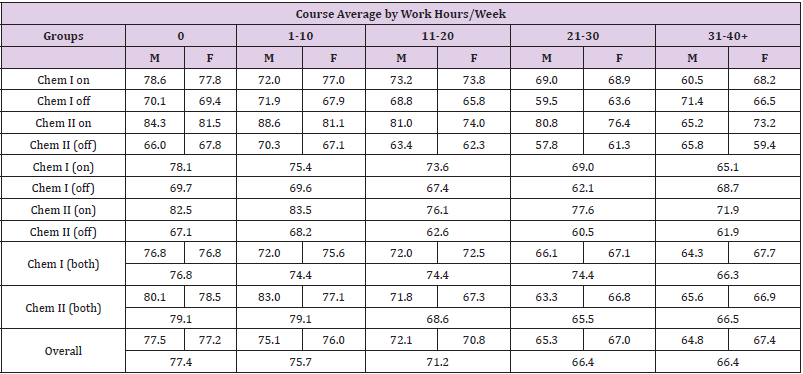
Table 6: Hours worked by gender.
When male averages are compared to females’ in 13 of the possible 20 comparisons, males outperformed females and this trend is present in all Chem II-on entries. Figure 2 is a comparison by gender of each work category of males and females. First note the general downward slope of the bars across the board. However, the most interesting part of this chart is the blue and grey bars denoting in each case (except for Chem I males who work full time) how regardless of gender, the students in the on-sequence classes are much stronger than those in the off-sequence classes. Table 7 is a companion to Table 6. Table 7 documents the number of students employed. The total population considered is n = 4060 of the 4113 since some students did not report their gender or considered themselves to be nonbinary (n = 53 or 1.3%). A greater percentage of the Chem II students work as compared to the Chem I students, but most of this difference is due to the Chem II off-sequence students.
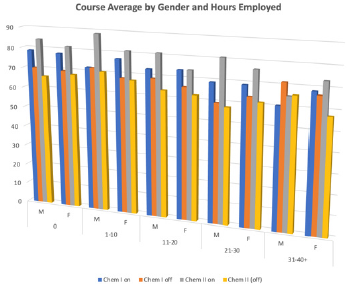
Figure 2: Bar graph denoting course averages of each work category by gender. In almost all cases except for males who work full time, those enrolled in Chem II on-sequence course held the highest course grade. With the same exception, the lowest performing group were students enrolled in the Chem II off-sequence course. In general males and females who do not work or work for 1-10 hours, complete their courses with the highest average.
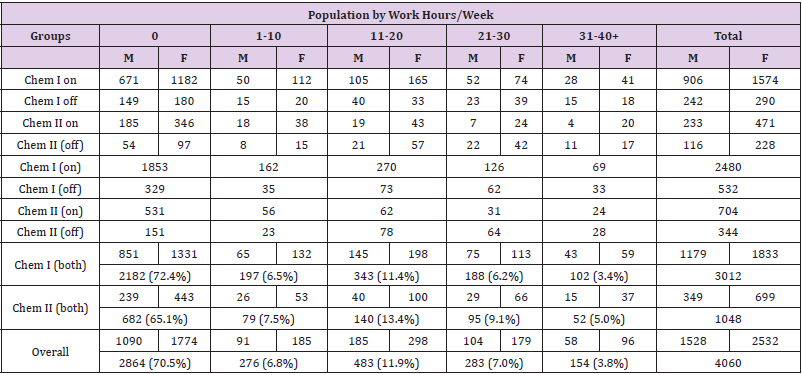
Table 7: Hours worked by number of students per gender.
Confidence in Career Choices
For this part of the analysis of the results, the on- and offsequences of Chem I and II are combined. All general chemistry courses participating in this study are considered to be for science majors with 84.3% of the 4113 students claiming to be STEM majors. Of the total population surveyed, two career questions asked for specific responses: (1) Are you planning a career a healthcare profession, Yes or No? and (2) Are you planning a career in engineering, Yes or No? Also, all students were asked about their confidence in their career choice and to rank it on a Likert scale (1- 5): not confident at all to very confident. An unexpected result was identified (Table 8). The MUST and course averages are in perfect alignment (no surprise here!). However, consistently across the table, the more confident the students are in their career choice, the weaker their incoming automaticity skills and the lower their course averages adding support for the views presented in the USA Today [2]. This article mentions that entering freshmen do not see how college connects them with a career. Given that over 90% of these students’ pre-college experiences were very focused on getting a career and less focused on their mathematics preparation. The MUST average of 11.5 under Confidence level 1 as well as the course average of 78.5 are significantly higher than the MUST and course averages for all the other confidence levels; there are no statistically differences between the other averages. Mathematically speaking, since the Confidence level 4 reflects the views over 40% of the population (n = 1723), obtaining a MUST average of 9.0 (close to the 9.1 in career choice 4) is expected.
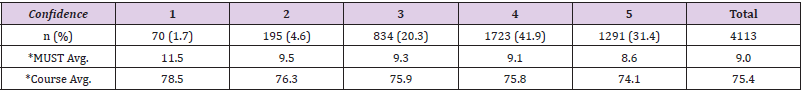
Table 8: Confidence level (Likert scale) and automaticity preparation for general chemistry.
*p < 0.05 MUST score and course average for students least confident in career choice are significantly higher than the MUST score and course average for those most confident in their career choice.
About 75% of the students responded that they intended to seek a career path towards either the healthcare profession and/or engineering and the other 25% were seeking some other career not given special attention; a few did not report their confidence level so the sample explored is n = 4088. The confidence average of each group (i.e., those planning to become a healthcare professional, engineer, both or neither) is above 3.5 (range = 3.76 to 4.04) (Table 9). When class averages of these groups are arranged, the highest course average did not agree with the students who had identified healthcare as their chosen profession; students seeking healthcareprofession degrees had the second highest course average with it being statistically different from that of the students who were seeking dual majors in engineering and healthcare professions. Even though their averages were statistically different at p < 0.05, the Likert scale averages (3.80 to 4.04) were not different. Statistical differences in students’ confidence levels existed between Healthcare and Health & Engineering and Healthcare and Other.
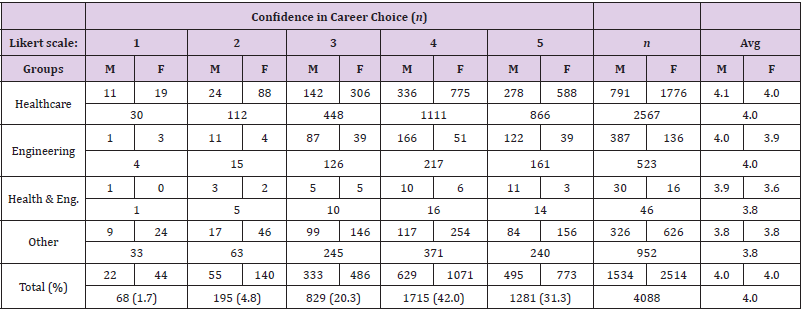
Table 9: Chem I and II students’ confidence in personal career choice (n = 4088).
Breaking down the intended major groups to highlight the broader categories of STEM vs. non-STEM majors (Table 10), statistical differences are as follow: no difference between non-STEM males and females, but STEM males are more confident than females and non-STEM majors are more confident than STEM majors, which typically have greater difficulty in retention [10]. Overall males in each group have significantly higher MUST scores than females. However, non-STEM females outperformed non-STEM males and STEM-males outperformed STEM females. Even though STEM majors held slightly less confidence in their career choice than non- STEM majors, they significantly outperformed non-STEM majors with 76.0 to 72.3 course averages, respectively, as predicted by their entering MUST scores of 9.4 to 6.9.
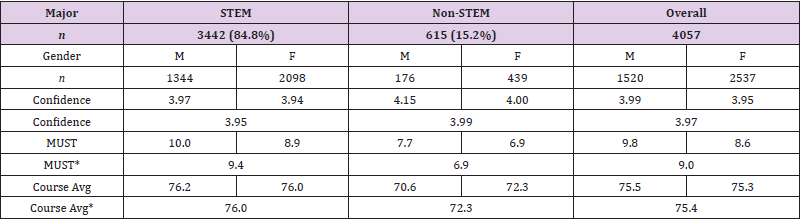
Table 10: Confidence level, MUST scores, and course average (n = 4057: students who reported both binary gender and intended STEM vs. non-STEM major).
*p < 0.05: STEM majors outperformed non-STEM majors.
Preparedness and congruence of career interest to major
The final analysis (Table 11) involves associating how prepared for the various courses students feel they are to how confident they are in their career choice and how these relate to their respective letter-grade outcome based on a standard scale: < 69.5 (unsuccessful), 69.5-79.4 (C), 79.5-89.4 (B), and 89.5+ (A). The total population studied in this evaluation totaled n = 3997 because all students without binary gender, MUST scores, and preparedness self-assessments were deleted. MUST ranges for above, middle and under average are determined by defining a middle range as one standard deviation around the mean. The overall MUST mean (SD) is 9.0 (5.2) so the average/middle range is 9±2.6 or 6-12 points out of 20 points max. Under average score range is 0-5; above average score range is 13-20. Confidence was divided into two groups based on combining Likert ranks of 4 and 5 to be in the Confident group and the ‘Less Than confident’ group combined 1-3. See Figures 3-9 for depictions of how students’ confidence in their careers, entry MUST scores and final averages compare according to their gender.
Only in the engineering and engineering & health groups did the number of males exceed the number of females (Table 11). The group that felt the most prepared is the engineers & health-career seekers who entered with the highest MUST average and finished with the highest course average. The two groups of students who considered themselves non-STEM majors felt the least prepared, entered with the lowest MUST scores and finished with the lowest course averages. Preparedness, MUST scores, and course averages are in alignment from low to high except for the course average of the future engineers who are expected to complete their courses with a higher average than 73.5. It is reasonable to consider that since many of the participating institutions also offer first-year chemistry courses specifically designed for engineers, which are usually more challenging than regular general chemistry courses, that these preengineering students are self-identifying as weaker students who think that by trying to avoid the engineering chemistry courses (even though they have the ability to do well as indicated by their MUST scores) gravitate to the regular general chemistry courses.
The alluvial diagrams (Figures 3-9) based on students’ preparedness present some interesting observations. The best way to understand these images is to read the captions to each figure. The vertical lines represent left to right: gender, the level of students’ self-reported confidence, MUST range as being above, average (middle) or under average and final course grade. Figure 3 is an overall representation of the population (n = 3997). Figures 4-9 follow the order of the groups in Table 11. For Figure 3, flowing from left to right, it is obvious that there is a larger percentage of women enrolled, both males and females are confident in their course preparation than are less than confident, and the MUST ranges are about equally split. Looking at the far-right bar (course letter grade), the greatest number of unsuccessful (U) students comes from those who scored under (i.e., below average) on the MUST and very few who scored above average. Most of the students (male and female) who were confident in their respective careers scored average (middle range) or above average on the MUST. Only a few students who were less than confident scored above average on the MUST. A majority of the unsuccessful students who scored under average on the MUST appear to be confident in their career choice.
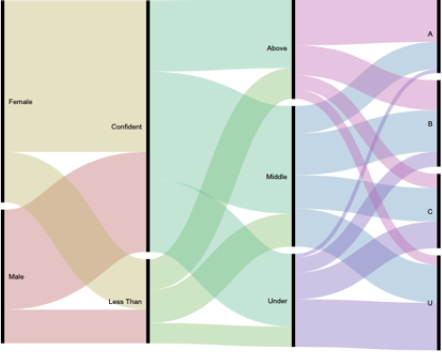
Figure 3: Collective alluvial diagram for all students (n = 3997). The far left vertical bar identifies the gender that flows into these students’ confidence level. The middle right bar groups the MUST scores into three groups (Above, Middle, and Under) and the far right bar identifies the final letter grade for these students. (See text for further description.).
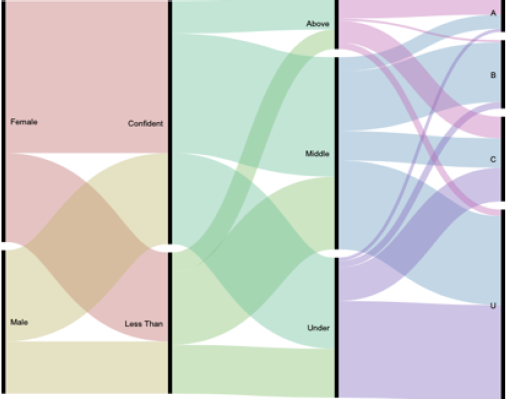
Figure 4: Alluvial diagram for non-STEM (not healthcare or engineering). The students in this group (the true non-science majors) entered with the lowest MUST average, finished the course with the lowest average of a D letter grade, and were less than confident in their career choice, which is not to be health or engineering. Few students fell into the above average MUST group but almost all who did were successful (grades of A, B or C). Those under average on the MUST were mostly unsuccessful. About one-third of the career-confident students scored under average on the MUST.
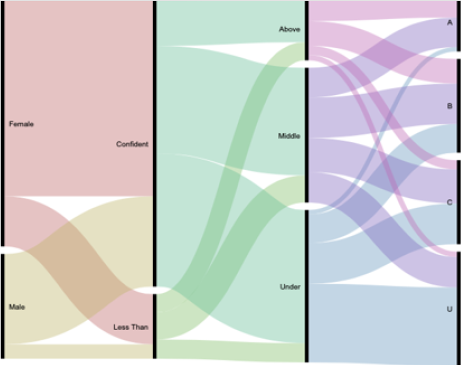
Figure 5: Alluvial diagram for non-STEM with expected careers in health and/or engineering. This group is dominated by females and the majority of males and females are confident in their career choice most of whom plan to enter the healthcare professions even though they do not consider themselves to be STEM majors yet are enrolled in a class for science majors. Almost half of this group scored under average on the MUST even though most were confident in their career choice. The majority of the unsuccessful students come from the group who scored under average on the MUST; very few who were above average on the MUST were unsuccessful in the class.
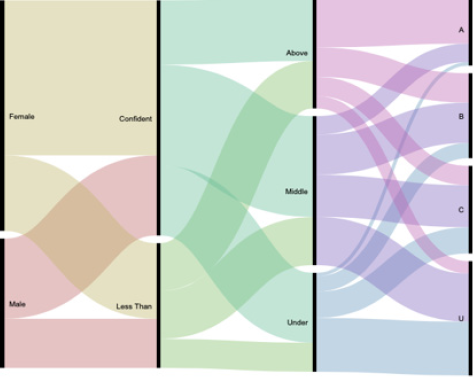
Figure 6: Alluvial diagram for other STEM majors seeking a career not in healthcare or engineering. Students in this group (about 20% of the total population) seek STEM degrees, just not careers in the healthcare professions or engineering. This group is average (i.e., overall average is also 3.11) on their self-reported preparedness for the course and about two-thirds are confident in their career choice. More students who are confident in their career choice scored under average on the MUST than those who were less than confident. The majority of the A students from this group scored above average on the MUST and just over half of these students were confident in their career choice even though about half proved to be unsuccessful in the course.
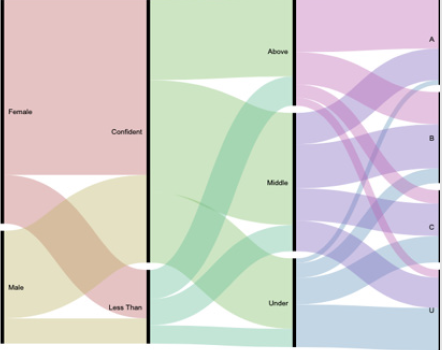
Figure 7: Alluvial diagram for STEM majors seeking a healthcare professional career. This group represents over half of the population evaluated and is similar to the STEM majors without an expected career in healthcare and/or engineering as to their preparedness and MUST entry scores but they did complete the course with a higher class average than the other STEM majors (except those seeking dual careers). About four-fifths of this group is confident in their career expectations leading to the healthcare professions. There were more successful than unsuccessful students and most of the unsuccessful students entered with low automaticity skills as identified by their MUST scores; very few students with above average MUST scores were unsuccessful.
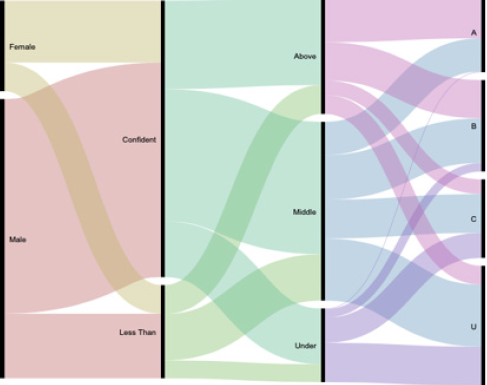
Figure 8: Alluvial diagram for STEM majors seeking an engineering career. This group is predominantly male and most males and females are confident in the career choice. They entered classes with above average MUST scores and preparedness expectations but finished with a lower course average than expected. Over two-thirds are confident in their career choice and most of these entered with middle to above average MUST scores. However, about one-third were unsuccessful and the reason why more are not successful is not evident from the alluvial diagram.
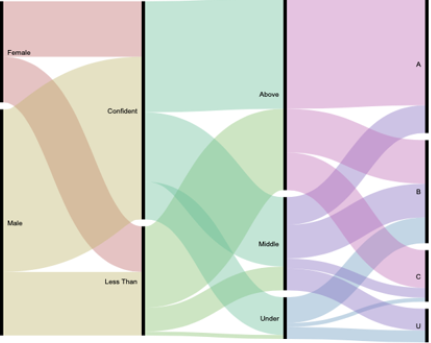
Figure 9: Alluvial diagram for STEM majors seeking an engineering and healthcare professional career. This group is by far the strongest prepared group. They entered with highest self-reported preparedness scores, the highest automaticity ability as reflected in the highest MUST scores and finished the courses with the highest overall average with many receiving a letter grade of A. The group is small (n = 46) and mostly male with probably a third questioning their seeking a dual career in health and engineering, even those almost all the less-than-confident students entered with middle and above MUST averages. No unsuccessful students scored above average on the MUST and no under average MUST scorer made an A letter grade. The majority of the students in this group were confident, made above average on the MUST and were successful in the courses.
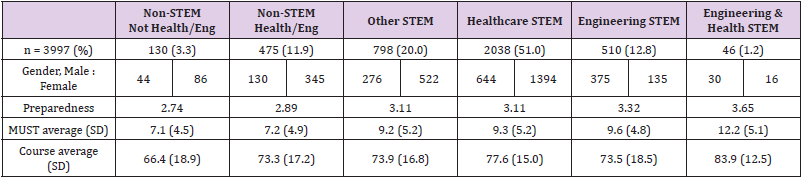
Table 11: Self-reported student preparedness by intended career.
Note: Average preparedness is 3.11 from a Likert scale with a maximum of 5, MUST average is 9.0 out of 20 questions, and the overall course average is 75.6. [Eng = engineer]
Discussion
The lesson learned from this evaluation is that non-STEM major students who enroll in general chemistry classes for science majors are at a disadvantage. Regardless of how confident in career choice they report, their preparation for their courses (i.e., their prior knowledge) is of upmost importance to having a more successful outcome. When they enter with low automaticity ability (what they can do without a calculator), they lack the mental-math skills that provide them with the ability to answer and complete problems they are likely to encounter in their general chemistry studies without struggling with the basic arithmetic skills as identified by the MUST, an excellent known predictor of course outcomes [6,9]. The state of Texas is instilling confidence in students that STEM degrees are important but entering mathematics (especially what they can do without a calculator) needs to be improved. Some institutions have general chemistry courses for non-STEM majors, some use to but have phased them out, and some only offer general chemistry for science majors. If we want all students to succeed, we need to provide a platform that breeds success and offer courses that do not practically predetermine that one or more groups of students are setup for failure.
The Texas Education Agency has done a very good job at stressing the importance of a career but these students appear to be more confident in their careers than is supported by being successful in general chemistry. What is taught and/or experienced in the pre-college days is very important but more emphasis needs to be placed on removing calculators from the classroom and making students improve their number-sense problem-solving ability without the use of a calculator. The MUST has proven over and over again to be predictive of final course averages in Chem I and II.
Are students’ confidence levels matched to their career goals? The answer to the main question is mixed. The students who are the classic STEM majors and seek careers in healthcare and/or engineering entered the courses with on the average the highest MUST means and finished the courses with the highest course averages but were the least confident in their choice of career. Maybe the lower confidence level stems from knowing that they have choices and it is early in their academic path but then the question arises is why are the weaker students’ (STEM and non- STEM) more confident in their career choice? It is a puzzling phenomenon.
Conclusion
This study provided no surprises as to who in general succeeds and who does not: males for the most part have better automaticity than females and are typically more successful, students who enroll in on-sequence Chem II classes are some of our best students, students who work more than 10 h put themselves at risk compared to those who do not work or work only 1-10 h, and STEM majors outperform non-STEM majors in these gateway courses. Students pursuing STEM degrees have higher difficulty in retention, and Hispanics are more likely to attend college part-time and therefore have a greater attrition rate [10]. Prior knowledge remains the mainstay of how anyone does in any academic course. The greater students’ automaticity as measured by the MUST the less they struggle with being successful in general chemistry I and II. Adding more calculator-free instruction for all STEM and non- STEM majors in general chemistry is advisable and will improve students’ mental-math capability. Summer bridge programs and the like should emphasize students’ automaticity skills to help prepare incoming students for success. Shelton et al. [2,12] study shows that MUST skills and quantitative-reasoning (QR) abilities are closely linked. QR skills (like those needed to understand how scientific data graphs and charts are read) are required to understand much of our current data-driven world needed to prepare global citizens. Improving our students QR calculator-free skills is a place to start to attempt to improve retention and graduation rates. You never know when your Apollo 13 moment is going to happen, and paper and pencil are all you have!
Conflict of Interest
Authors declare no conflict of interest concerning this IRBapproved work.
References
- Habley WR, Bloom JL, Robbins S (2012) Increase Persistence: Research-based strategies for college student success. John Wiley & Sons, Inc, CA, USA.
- (2015) USA TODAY. USA.
- (2019) TEA: Texas Education Agency, USA.
- (2019) THECB (Texas Higher Education Coordinating Board). 2019 Texas Public Higher Education Almanac: A profile of state and institutional performance and characteristics (Ed. 2018), USA.
- Hartman JA, Nelson EA (2016) Automaticity in Computation and Student Success in Introductory Physical Science Courses. Cornell University Library, arXiv:1608.05006v2 [physics ed-ph] Paper presented as part of Chemistry & Cognition: Support for Cognitive-Based First-Year Chemistry, USA.
- Williamson VW, Walker DR, Chuu E, Broadway S, Mamiya B, et al. (2020) Impact of basic arithmetic skills on success in first-semester general chemistry. Chemistry Education Research and Practice 21: 51-61.
- Petros A, Weber R, Broadway S, Ford R, Powell C, et al. (2017) MUST-Know Pilot-Math Preparation Study from Texas. ACS DivCHED CCCE (Committee on Computers in Chemical Education) online conference organized by Cary Kilner and Eric Nelson, USA.
- Albaladejo JDP, Broadway S, Mamiya B, Petros A, Powell CB (2018) Conf Chem Conference on Mathematics in Undergraduate Chemistry Instruction: MUST-Know Pilot Study-Math Preparation Study from Texas. Journal of Chemical Education 95: 1428-1429.
- Powell CM, Simpson J, Williamson VW, Dubrovskiy A, Walker DR, et al. (2020) Impact of arithmetic automaticity on students' success in second-semester general chemistry. Chemistry Education Research and Practice.
- (2020) NEA: National Education Association Hispanic: Demographics, USA.
- Villalta Cerdas A, Dubrovskiy A, Mamiya B, Walker DR, Powell CB (2020) Personal characteristics influencing college readiness of Hispanic students in a STEM gateway course: first-semester general chemistry. Journal of College Science Teaching.
- Shelton GR, DR Walker, R Weber, CA Powell, B Mamiya, et al. (2020) Warning signals from arithmetic and QL/QR automaticity skills indicating pending failure in general chemistry I and II.
