 Research Article
Abstract
To determine the purity and quality of different brands of ciprofloxacin tablets by using UV spectrophotometry and FTIR spectroscopy as well as provide simple, cost-effective and sensitive spectrophotometric method for determination of ciprofloxacin tablets available in local market, Malaysia. Six different brands of ciprofloxacin tablets were purchased from local market, coded A to F and then analysed by UV spectrophotometry and FTIR spectroscopy. The UV spectrophotometry is based on the absorbance measurement of maximum wavelength of 276nm using distilled water and hydrochloric acid (HCl). All the tablets were evaluated for percentage purity with United State Pharmacopoeia (USP) and British Pharmacopoeia (BP) standards. In FTIR spectroscopy, the spectrum of six different brands of ciprofloxacin tablet were observed and compared among each other. All six ciprofloxacin brands met the specification of weight uniformity. The UV spectrophotometric results using distilled water revealed that two of the market brands are compliance with the official USP limit of 90-110% while only one brand was in the range of 95-105% according to official BP limit. The UV spectrophotometric results using HCl shows that fifty percent of the samples were within the acceptance USP range while four out of six brands fell within the BP specification. The FTIR spectrum of six different brands have the similar characteristic peak corresponding to the functional groups in the chemical structure. FTIR spectroscopy and UV spectrophotometry are developed as simple, quick and cost-effective methods. However, FTIR spectroscopy was more accurate and sensitive and gave better results than UV spectrophotometry [1-62]. The quality and safety of pharmaceutical products are very important.
Keywords: Ciprofloxacin; FTIR; UV Spectroscopy; USP; BP
Abbreviations: hydrochloric acid (HCl); United State Pharmacopoeia (USP); British Pharmacopoeia (BP); hydroxyl (OH) group
Introduction
The oral bioavailability of ciprofloxacin is about 70% to 80%, with minimal loss by first pass metabolism. It is absorbed readily but incompletely. After administration of single oral dose, maximum plasma concentration between 0.28 and 5.92mg/L are achieved within 0.5 to 2 hours. It is increased proportionally to the dose within the normal therapeutic range [11]. If ciprofloxacin is administered intravenously, plasma concentration profile follows 3-compartment pharmacokinetic model. It is moderately bound (20 to 40%) to plasma proteins and has a large apparent volume of distribution (2 to 3 L/kg). Ciprofloxacin is not readily penetrated into the cerebrospinal fluid and placenta. However, it is penetrated and concentrated in many body tissues and fluids, including bile and kidney, liver, gallbladder, prostate and lung tissue. The availability of ciprofloxacin at the intestinal target site determines the effectiveness of antimicrobial therapy and clinical outcome of an infection [2] (Figure 1).
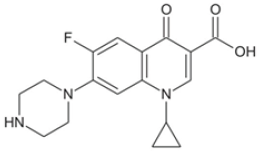
Figure 1:
Chemical Strucutre of Ciprofloxacin
The drug is official in British Pharmacopoeia presenting an HPLC assay for ciprofloxacin hydrochloride tablets and ciprofloxacin lactate intravenous infusion [14]. In Brazilian Pharmacopoeia [15], UV spectrophotometric, HPLC and a microbiological diffusion agar methods are the methods proposed to determine the injection, tablets and ophthalmic solutions of ciprofloxacin. Besides, United States Pharmacopoeia describes the HPLC method for ciprofloxacin and ciprofloxacin hydrochloride in bulk, ciprofloxacin injection and ophthalmic ointment and solution as well as tablets [16]. A number of studies regarding the purity determination of various Ciprofloxacin brands have been conducted in developing countries. However, there are a few research papers for purity determination of Ciprofloxacin and past research did not test this hypothesis directly in Malaysia. Moreover, reports of substandard and counterfeit drug are increasing recently in Malaysia. To assure effective and safe therapy, purity assessment is always a key parameter to figure out the correct chemical constitution of a drug especially API. Hence, this study is aimed to assess the percentage purity and quality of different brands of ciprofloxacin tablets formulation commercially available in the local market and determine whether the compounds meet the specification as stated in USP and BP by using a simple, sensitive and reproducible UV spectrophotometer and FTIR spectroscopy.
Experimental
Chemicals, Glassware and Instruments
Freshly prepared 0.1N hydrochloric acid (HCl), Distilled water, 95% ethanol, Six different brands of ciprofloxacin tablets, Ciprofloxacin hydrochloride BP powder [53]. The standard ciprofloxacin hydrochloride BP powder was supplied as gift samples from the laboratory of Faculty of Pharmacy, AIMST University for comparison. The powder was manufactured by Aarti Drug Ltd. Maharashtra, India. Its manufacturing license number, batch number, manufacturing date and precaution were also labeled. FisherbrandTM analytical balance. UV-VIS spectrophotometer Shimadzu UV-1800 with 1cm path length quartz cells for absorbance measurement [54]. It is connected to the analyzed computer for interpretation and determination of absorbance. All spectrophotometer measurements were at room temperature laboratory method [20]. Agilent Cary 630 FTIR spectrometer [56], Analyzed laptop, Agilent MicroLab FTIR software.
Collection of Different Brands of Ciprofloxacin Tablets
Six different commercially available leading brands of ciprofloxacin tablets, within their shelf life were purchased from various pharmacy outlets in Sungai Petani, Kedah, Malaysia [57,58]. Each brand of ciprofloxacin tablet were labelled to contain 500mg of ciprofloxacin. The ciprofloxacin tablets were blindly named as Brand A, Brand B, Brand C, Brand D, Brand E and Brand F in the present study. The descriptions regarding the brands are shown in (Tables 1 & 2).

Table 1: Detail of Standard Ciprofloxacin.
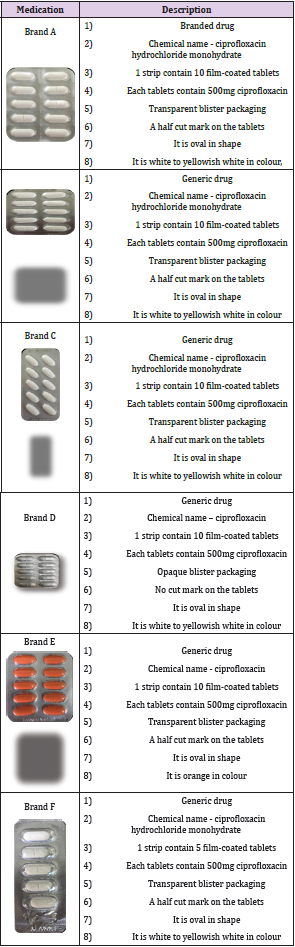
Table 2: Description of each Ciprofloxacin brands.
Preparation of Crushed Ciprofloxacin Powder
1) 20 tablets of each brands of ciprofloxacin are weighed accurately and the average weight was noted. The percentage deviation of each tablets were also calculated.
2) The powders were kept inside a re-sealable plastic bag to avoid the powder to contact with moisture which may cause the drug to denature.
3) The re-sealable plastic bags were labeled clearly with the name and the crushing date.
4) The plastic bags were kept in desiccator containing silica gel, which is a cool and dry place.
Preparation of Sample and Blank Solution
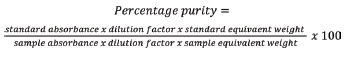
1) The average weight of each brand was calculated by using the formula below:

2) The sample powders equivalent to 50mg of ciprofloxacin were weighed accurately and transferred into a volumetric flask.
3) 50mg of distilled water was added.
4) The mixture was then stirred for 10 minutes with help of magnetic stirrer and stirring bar. The volume was made up with distilled water (Solution A).
5) Solution A was filtered and 5ml of it was pipetted out into a 100ml volumetric flask and made up volume with distilled water (Solution B).
6) Solution B was pipetted out into another 100ml volumetric flask and made up volume with distilled water (Solution C). Solution C is the final solution.
7) The procedure for preparation of sample solution was repeated with freshly prepared 0.1N HCl instead of distilled water.
8) The blank solution was prepared by pipetting out 5ml of 0.1 HCl into 100ml volumetric flask and made up volume with distilled water.
UV Spectrophotometry
The absorbance of ciprofloxacin solution was scanned and measured as a function of wavelength in the 200-400nm UV regions. The maximum absorption wavelength (λmax) was observed at 276nm and this wavelength was adopted for absorbance measurement. All spectrophotometer measurements were at room temperature laboratory standard.
The absorbance of the resulting Solution C was measured at λmax of 276nm
FTIR Spectroscopy
1) The platinum diamond sampling surface was cleaned before starting measurements of each sample using tissue paper with ethanol and allowed to dry.
2) A fresh background spectrum was measured against air and collected to ensure accuracy of data from samples.
3) Clean crystal check was performed to confirm that the system is ready for measurements [62].
4) Small amounts of finely ground Ciprofloxacin powder were placed on the diamond sampling crystal and pressed using a clamp to ensure proper contact.
5) The software analysis was performed. The spectrum of each sample was measured over the range of 4000-400cm- 1 with spectral resolution 2cm-1. Estimated scan time for spectral acquisition was 25 seconds.
6) The recorded fingerprint spectra of each samples was assessed and peaks were plotted.
7) Characteristic regions of the spectrum were identified and compared among standard and samples.
8) The percentage purity of the peak were calculated by using formula below:
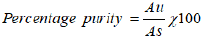
Where, Au = absorbance of the sample solution,
As = absorbance of the standard solution
Comparison of Percentage Purity of Ciprofloxacin
1) The percentage purity of all samples was compared with the limits in USP and BP, which are used as standard for the evaluation study. The samples fail the test if the percentage purity is not within the limit.
i. According to USP, ciprofloxacin must contain not less than 90.0 and not more than 110.0 percent of C17H18FN3O3, calculated on the dried basis.
ii. According to BP, ciprofloxacin must contain not less than 95.0 and not more than 105.0 percent of C17H18FN3O3 of the dried substance.
2) The percentage purity of six different ciprofloxacin samples was determined by comparing with standard.
3) The percentage purity of samples using distilled water as blank solution was compared with that using freshly prepared 0.1 N hydrochloric acid (HCl) as blank solution.
4) The percentage purity of samples by UV spectrophotometric method was compared to that by FTIR spectroscopy.
Results
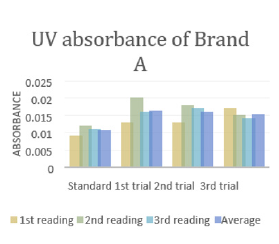
The average weight of different brands of Ciprofloxacin were calculated and shown in (Tables 3 & 4). It indicates that brand E had the highest average weight (870.935mg) whereas brand F had the lowest average weight (728.825mg). The average weight for brand A, B, C and D were 766.49mg, 826.915mg, 775.605mg and 750.7mg respectively. The uniformity of weight of each brands were then assessed and shown in (Table 5). In (Graph 1), the first, second and third readings of standard ciprofloxacin were 0.011, 0.012 and 0.012 respectively. The average reading for the standard was 0.0117. There were total 3 trials carried out for assay of sample A and each trial had 3 readings. In first trial, the first, second and third readings were 0.017, 0.016 and 0.018 respectively. The average reading for first trial of sample A was 0.0160. In second trial, the first, second and third readings were 0.014, 0.017 and 0.019 respectively. The average reading for second trial of sample A was 0.0167. In third trial, the first, second and third readings were 0.021, 0.015 and 0.015 respectively. The average reading for third trial of sample A was 0.0170.
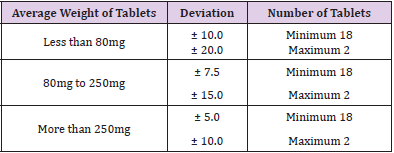
Table 3: The deviation limit of individual weight.
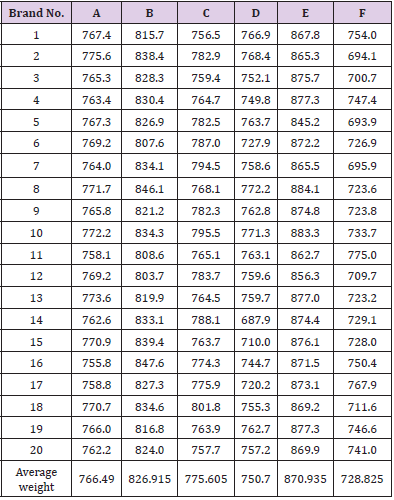
Table 4: Average weight of different brands of Ciprofloxacin.
Weight of each tablet for different brands (mg)
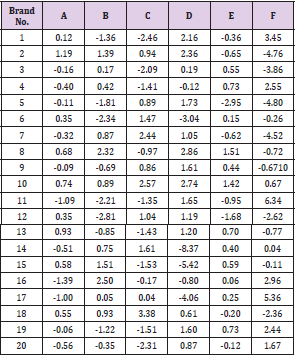
Table 5: Weight uniformity of different brands of Ciprofloxacin.
Percentage deviation of each tablet for different brands (%).

Graph 1: UV absorbance of Brand A.
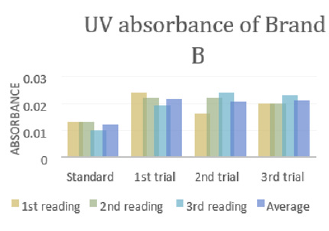
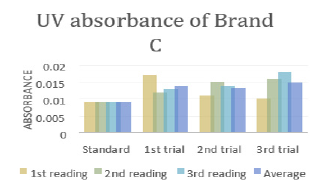
In (Graph 2), the first, second and third readings of standard ciprofloxacin were 0.013, 0.014 and 0.011 respectively. The average reading for the standard was 0.0127. There were total 3 trials carried out for assay of sample B and each trial had 3 readings. In first trial, the first, second and third readings were 0.015, 0.019 and 0.018 respectively. The average reading for first trial of sample B was 0.0173. In second trial, the first, second and third readings were 0.020, 0.017 and 0.018 respectively. The average reading for second trial of sample B was 0.0183. In third trial, the first, second and third readings were 0.018, 0.024 and 0.019 respectively. The average reading for third trial of sample B was 0.0180. In (Graph 3), the first, second and third readings of standard ciprofloxacin were 0.012, 0.008 and 0.013 respectively. The average reading for the standard was 0.0110. There were total 3 trials carried out for assay of sample C and each trial had 3 readings. In first trial, the first, second and third readings were 0.016, 0.015 and 0.022 respectively. The average reading for first trial of sample C was 0.0177. In second trial, the first, second and third readings were 0.018, 0.024 and 0.021 respectively. The average reading for second trial of sample C was 0.0173. In third trial, the first, second and third readings were 0.014, 0.020 and 0.019 respectively. The average reading for third trial of sample B was 0.0177.
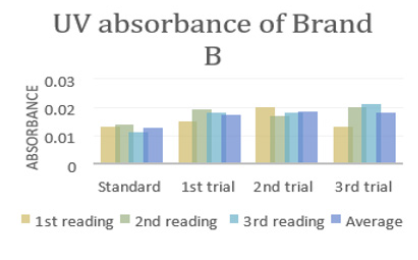
Graph 2: UV absorbance of Brand B.
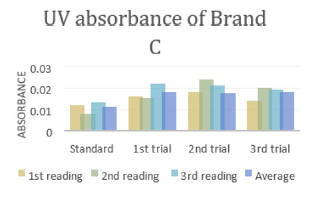
Graph 3: UV absorbance of Brand C.
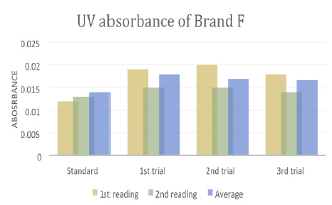
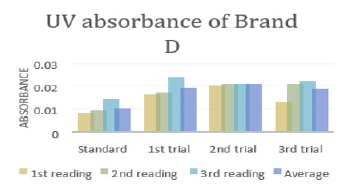
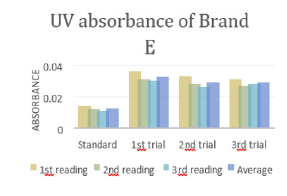
In (Graph 4), the first, second and third readings of standard ciprofloxacin were 0.014, 0.011 and 0.014 respectively. The average reading for the standard was 0.0130.There were total 3 trials carried out for assay of sample D and each trial had 3 readings. In first trial, the first, second and third readings were 0.025, 0.024 and 0.020 respectively. The average reading for first trial of sample D was 0.0230. In second trial, the first, second and third readings were 0.026, 0.023 and 0.024 respectively. The average reading for second trial of sample D was 0.0243. In third trial, the first, second and third readings were 0.022, 0.028 and 0.027 respectively. The average reading for third trial of sample D was 0.0253. In (Graph 5), the first, second and third readings of standard ciprofloxacin were 0.010, 0.014 and 0.011 respectively. The average reading for the standard was 0.0117. There were total 3 trials carried out for assay of sample E and each trial had 3 readings. In first trial, the first, second and third readings were 0.030, 0.029 and 0.027 respectively. The average reading for first trial of sample E was 0.0287. In second trial, the first, second and third readings were 0.032, 0.033 and 0.029 respectively. The average reading for second trial of sample E was 0.0313. In third trial, the first, second and third readings were 0.031, 0.032 and 0.025 respectively. The average reading for third trial of sample E was 0.0293. In (Graph 6), the first, second and third readings of standard ciprofloxacin were 0.012, 0.012 and 0.017 respectively. The average reading for the standard was 0.0140.
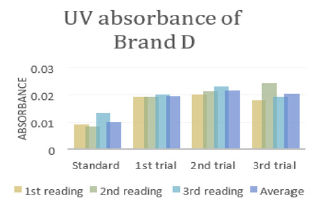
Graph 4: UV absorbance of Brand D.
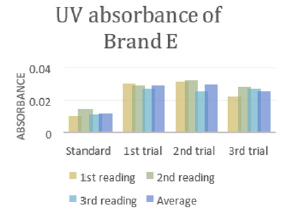
Graph 5: UV absorbance of Brand E.
Graph 6: UV absorbance of Brand E.
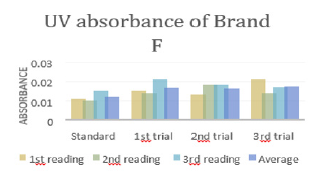
There were total 3 trials carried out for assay of sample F and each trial had 3 readings. In first trial, the first, second and third readings were 0.019, 0.015 and 0.020 respectively. The average reading for first trial of sample F was 0.0180. In second trial, the first, second and third readings were 0.020, 0.015 and 0.016 respectively. The average reading for second trial of sample F was 0.0170. In third trial, the first, second and third readings were 0.018, 0.014 and 0.018 respectively. The average reading for third trial of sample F was 0.0167. The percentage purity determination of different brands of Ciprofloxacin with distilled water as blank by using UV spectrophotometry was tabulated in (Tables 6 & 7). For ciprofloxacin standard, the percentage purity was found to be 100%. There were 3 trials conducted for each assay of sample. The percentage purity of first, second and third trials of sample A were 112.09%, 107.39% and 105.49% respectively. The average percentage purity of sample A was 108.32%. The percentage purity of first, second and third trials of sample B were 121.42, 114.78% and 116.70% respectively. The average percentage purity of sample B was 117.63%. The percentage purity of first, second and third trials of sample C were 96.41%, 98.64% and 96.41% respectively. The average percentage purity of sample A was 97.15%. The percentage purity of first, second and third trials of sample D were 84.87%, 80.33% and 77.15% respectively. The average percentage purity of sample D was 80.78%. The percentage purity of first, second and third trials of sample E were 71.02%, 65.12% and 69.57% respectively. The average percentage purity of sample E was 68.57%. The percentage purity of first, second and third trials of sample F were 113.38%, 120.05% and 122.20% respectively. The average percentage purity of sample F was 118.54%.
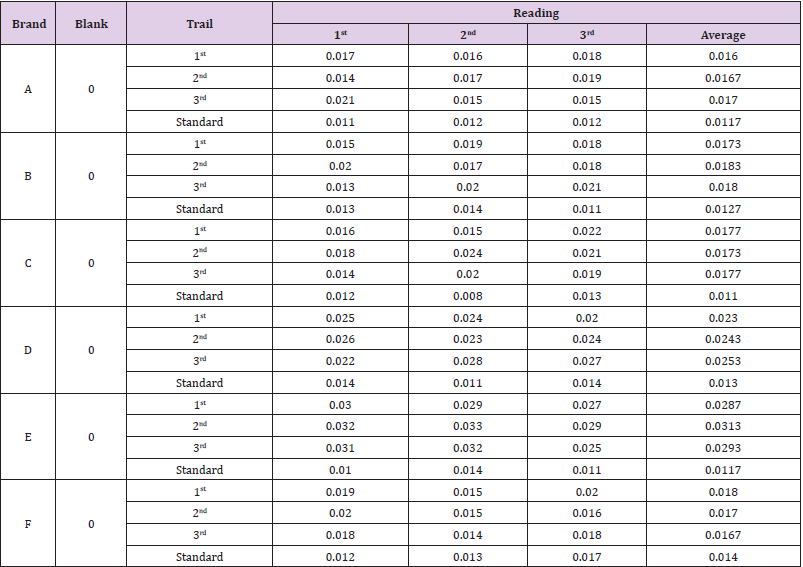
Table 6: Absorbance of different brands of Ciprofloxacin with distilled water as blank.
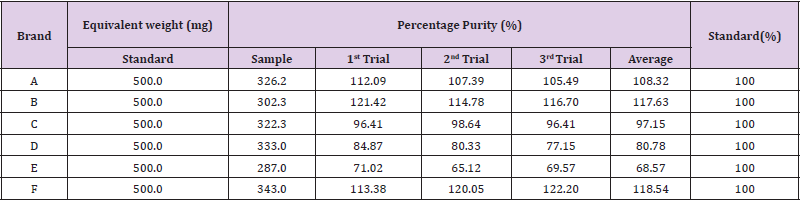
Table 7: WPercentage purity determination of different brands of Ciprofloxacin with distilled water as blank by using UV spectrophotometry.
The comparison of percentage purity between standard and sample using distilled water as blank by UV spectrophotometry was shown in (Graph 7). For ciprofloxacin standard, the percentage purity was 100%. According to the graph, as compared to standard ciprofloxacin, Brand C had the most similar percentage purity while Brand E had the most different percentage purity. According to United State Pharmacopoeia (USP), the percentage purity of ciprofloxacin in tablet dosage form should be in the range of 90.0% and 110.0%. Thus, Brand A and C passed the test whereas Brand B, D, E and F failed the test. While according to British Pharmacopoeia (BP), ciprofloxacin tablets should contain not less than 95.0% and not more than 105.0% of the labeled amount of ciprofloxacin. Thus, only Brand C passed the test while other brands failed the test. In (Graph 8), the first, second and third readings of standard ciprofloxacin were 0.009, 0.012 and 0.011 respectively. The average reading for the standard was 0.0107. There were total 3 trials carried out for assay of sample A and each trial had 3 readings. In first trial, the first, second and third readings were 0.013, 0.020 and 0.016 respectively. The average reading for first trial of sample A was 0.0163. In second trial, the first, second and third readings were 0.012, 0.018 and 0.017 respectively. The average reading for second trial of sample A was 0.0157. In third trial, the first, second and third readings were 0.024, 0.014 and 0.015 respectively. The average reading for third trial of sample A was 0.0107. In (Graph 9), the first, second and third readings of standard ciprofloxacin were 0.013, 0.013 and 0.010 respectively. The average reading for the standard was 0.0120. There were total 3 trials carried out for assay of sample B and each trial had 3 readings. In first trial, the first, second and third readings were 0.024, 0.022 and 0.019 respectively. The average reading for first trial of sample B was 0.0217. In second trial, the first, second and third readings were 0.016, 0.022 and 0.024 respectively.
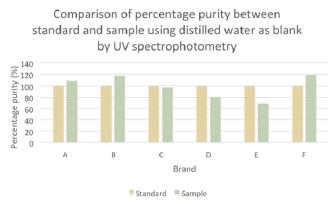
Graph 7: Comparison of percentage purity between standard and sample using distilled water as blank by UV spectrophotometry.
Graph 8: UV absorbance of Brand A.
Graph 9: UV absorbance of Brand B.
The average reading for second trial of sample B was 0.0207. In third trial, the first, second and third readings were 0.020, 0.020 and 0.023 respectively. The average reading for third trial of sample B was 0.0210. In (Graph 10), the first, second and third readings of standard ciprofloxacin were 0.009, 0.009 and 0.009 respectively. The average reading for the standard was 0.009. There were total 3 trials carried out for assay of sample C and each trial had 3 readings. In first trial, the first, second and third readings were 0.017, 0.012 and 0.013 respectively. The average reading for first trial of sample C was 0.0140. In second trial, the first, second and third readings were 0.011, 0.015 and 0.014 respectively. The average reading for second trial of sample C was 0.0133. In third trial, the first, second and third readings were 0.010, 0.016 and 0.018 respectively. The average reading for third trial of sample B was 0.0147. In (Graph 11), the first, second and third readings of standard ciprofloxacin were 0.008, 0.009 and 0.014 respectively. The average reading for the standard was 0.0103.There were total 3 trials carried out for assay of sample D and each trial had 3 readings. In first trial, the first, second and third readings were 0.016, 0.017 and 0.024 respectively. The average reading for first trial of sample D was 0.0190. In second trial, the first, second and third readings were 0.020, 0.021 and 0.021 respectively. The average reading for second trial of sample D was 0.0207. In third trial, the first, second and third readings were 0.013, 0.021 and 0.022 respectively. The average reading for third trial of sample D was 0.0187.
Graph 10: UV absorbance of Brand C.
Graph 11: UV absorbance of Brand D.
In (Graph 12), the first, second and third readings of standard ciprofloxacin were 0.014, 0.012 and 0.011 respectively. The average reading for the standard was 0.0123. There were total 3 trials carried out for assay of sample E and each trial had 3 readings. In first trial, the first, second and third readings were 0.036, 0.031 and 0.030 respectively. The average reading for first trial of sample E was 0.0323. In second trial, the first, second and third readings were 0.033, 0.028 and 0.026 respectively. The average reading for second trial of sample E was 0.0290. In third trial, the first, second and third readings were 0.031, 0.027 and 0.028 respectively. The average reading for third trial of sample E was 0.0287. In (Graph 13), the first, second and third readings of standard ciprofloxacin were 0.011, 0.010 and 0.015 respectively. The average reading for the standard was 0.0120. There were total 3 trials carried out for assay of sample F and each trial had 3 readings. In first trial, the first, second and third readings were 0.015, 0.014 and 0.021 respectively. The average reading for first trial of sample F was 0.0167. In second trial, the first, second and third readings were 0.013, 0.018 and 0.018 respectively. The average reading for second trial of sample F was 0.0163. In third trial, the first, second and third readings were 0.021, 0.014 and 0.017 respectively. The average reading for third trial of sample F was 0.0173.
Graph 12: UV absorbance of Brand E.
Graph 13: UV absorbance of Brand E.
The percentage purity determination of different brands of Ciprofloxacin with HCl as blank by using UV spectrophotometry was tabulated in (Tables 8 & 9). For ciprofloxacin standard, the percentage purity was 100%. There were 3 trials conducted for each assay of sample. The percentage purity of first, second and third trials of sample A were 100.62%, 102.51% and 107.20% respectively. The average percentage purity of sample A was 103.44%. The percentage purity of first, second and third trials of sample B were 91.46, 95.88% and 87.59% respectively. The average percentage purity of sample B was 91.64%. The percentage purity of first, second and third trials of sample C were 99.73%, 104.98% and 94.98% respectively. The average percentage purity of sample C was 99.90%. The percentage purity of first, second and third trials of sample D were 81.40%, 74.71% and 82.70% respectively. The average percentage purity of sample D was 79.60%. The percentage purity of first, second and third trials of sample E were 66.34%, 73.89% and 74.66% respectively. The average percentage purity of sample E was 71.63%. The percentage purity of first, second and third trials of sample F were 104.75%, 107.32% and 101.11% respectively.
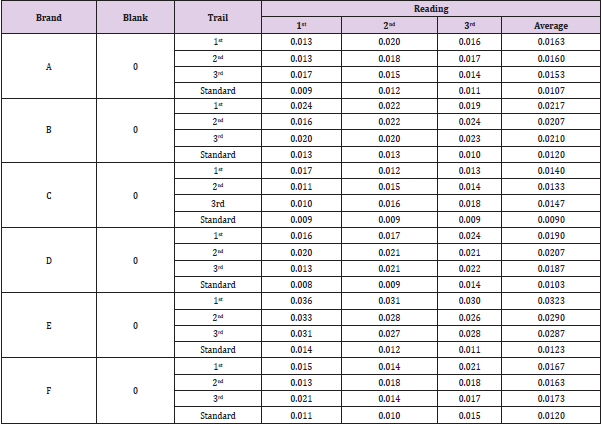
Table 8: Absorbance of different brands of Ciprofloxacin with HCl as blank.
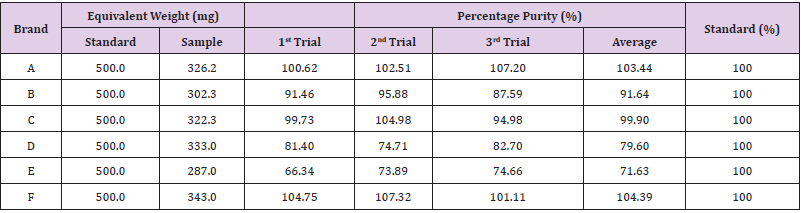
Table 9: Percentage purity determination of different brands of Ciprofloxacin with HCl as blank by using UV spectrophotometry.
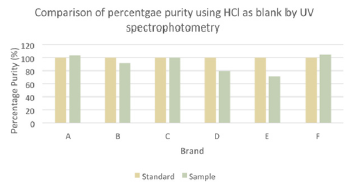
The average percentage purity of sample F was 104.39%. The comparison of percentage purity between standard and sample using HCl as blank by UV spectrophotometry was shown in (Graph 14). For ciprofloxacin standard, the percentage purity was 100%. The percentage purity of Brand A, B, C, D, E and F were found to be 103.44%, 91.64%, 94.55%, 79.60%, 71.63% and 104.39%. According to the graph, as compared to standard ciprofloxacin, Brand A had the most similar percentage purity while Brand E had the most different percentage purity. According to United State Pharmacopoeia (USP), the percentage purity of ciprofloxacin in tablet dosage form should be in the range of 90.0% and 110.0%. Thus, Brand A, B, C and F passed the test whereas Brand D and E failed the test. While according to British Pharmacopoeia (BP), ciprofloxacin tablets should contain not less than 95.0% and not more than 105.0% of the labeled amount of ciprofloxacin. Thus, Brand A, C and F passed the test. Comparison of percentage purity of ciprofloxacin between UV spectrophotometry and FTIR spectrophotometry was shown in (Graph 15). For the ciprofloxacin standard, the percentage purity was 100%. The average percentage purity of Brand A, B, C, D, E and F using distilled water as blank by UV spectrophotometry were found to be 104.73%, 117.63%, 76.54%, 80.78%, 68.57% and 109.35% respectively. Besides, the average percentage purity of Brand A, B, C, D, E and F using HCl as blank by UV spectrophotometry were 103.44%, 91.64%, 94.55%, 79.60%, 71.63% and 104.39% respectively. According to the graph, Brand C had the most similar percentage purity between distilled water and HCl by UV spectrophotometry as compared to ciprofloxacin standard. Whereas, Brand E has the different percentage purity.
Graph 14: Comparison of percentage purity between standard and sample using HCl as blank by UV spectrophotometry.
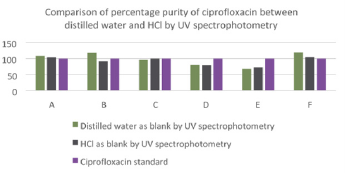
Graph 15: Comparison of percentage purity of ciprofloxacin between distilled water and HCl by UV spectrophotometry.
Measurement of FTIR Spectrum of Different Brands of Ciprofloxacin by FTIR Spectroscopy
(Figure 2) shows the FTIR spectra of ciprofloxacin standard. The prominent characteristic peaks were found between 3500- 3450cm-1, which was assigned to stretching vibration of hydroxyl (OH) group and intermolecular hydrogen bonding. Another band at 3000-2950cm-1 represented the alkene and aromatic C-H stretching, especially υ=C-H. The peak at 2900cm-1 was assigned to C-H stretching vibration of cyclopropyl group. The region from 1750 to 1700cm-1 represented the carbonyl C=O stretching. The band at 1650 to 1600cm-1 was assigned to quinolones. (Figure 3) shows the FTIR spectra of ciprofloxacin Brand A. The prominent characteristic peaks were found between 3500-3450cm-1, which was assigned to stretching vibration of hydroxyl (OH) group and intermolecular hydrogen bonding. Another band at 3000-2950cm- 1 represented the alkene and aromatic C-H stretching, especially υ=C-H. The region from 1750 to 1700cm-1 represented the carbonyl C=O stretching. The band at 1650 to 1600cm-1 was assigned to quinolones. (Figure 4) shows the FTIR spectra of ciprofloxacin Brand B. The prominent characteristic peaks were found between 3500-3450cm-1, which was assigned to stretching vibration of hydroxyl (OH) group and intermolecular hydrogen bonding. The other bands at 3000-2950cm-1 represented the alkene and aromatic C-H stretching, especially υ=C-H. The peak at 2900cm-1 was assigned to C-H stretching vibration of cyclopropyl group. The region from 1750 to 1700cm-1 represented the carbonyl C=O stretching. The band at 1650 to 1600cm-1 was assigned to quinolones. (Figure 5) shows the FTIR spectra of ciprofloxacin Brand C.
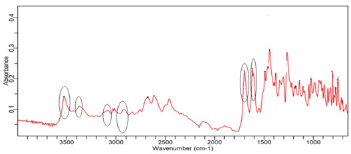
Figure 2: Ciprofloxacin standard.

Figure 3: Ciprofloxacin Brand A
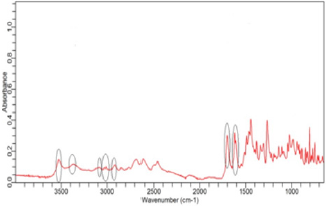
Figure 4: Ciprofloxacin Brand B.
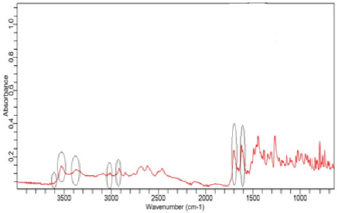
Figure 5: Ciprofloxacin Brand C.
The prominent characteristic peaks were found between 3500- 3450cm-1, which was assigned to stretching vibration of hydroxyl (OH) group and intermolecular hydrogen bonding. Another band at 3000-2950cm-1 represented the alkene and aromatic C-H stretching, especially υ=C-H. The peak at 2900cm-1 was assigned to C-H stretching vibration of cyclopropyl group. The region from 1750 to 1700cm-1 represented the carbonyl C=O stretching. The band at 1650 to 1600cm-1 was assigned to quinolones. (Figure 6) shows the FTIR spectra of ciprofloxacin Brand E. The prominent characteristic peaks were found between 3500-3450cm-1, which was assigned to stretching vibration of hydroxyl (OH) group and intermolecular hydrogen bonding. Another band at 3000-2950cm- 1 represented the alkene and aromatic C-H stretching, especially υ=C-H. The peak at 2900cm-1 was assigned to C-H stretching vibration of cyclopropyl group. The region from 1750 to 1700cm- 1 represented the carbonyl C=O stretching. The band at 1650 to 1600cm-1 was assigned to quinolones. (Figure 7) shows the FTIR spectra of ciprofloxacin Brand F. The prominent characteristic peaks were found between 3500-3450cm-1, which was assigned to stretching vibration of hydroxyl (OH) group and intermolecular hydrogen bonding. Another band at 3000-2950cm-1 represented the alkene and aromatic C-H stretching, especially υ=C-H. The peak at 2900cm-1 was assigned to C-H stretching vibration of cyclopropyl group. The region from 1750 to 1700cm-1 represented the carbonyl C=O stretching (Figure 8). The band at 1650 to 1600cm-1 was assigned to quinolones.
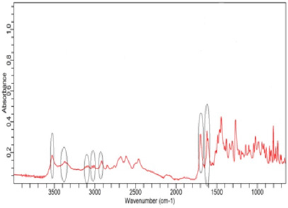
Figure 6: Ciprofloxacin Brand D.
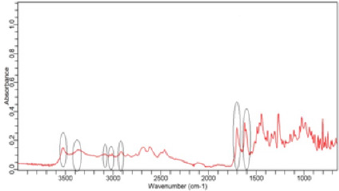
Figure 7: Ciprofloxacin Brand E.
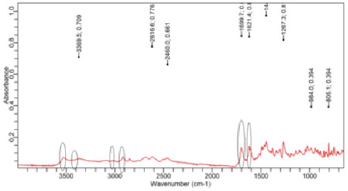
Figure 8: Ciprofloxacin Brand F.
Discussion
In this study, the objective were to determine the purity and quality of different brands of ciprofloxacin tablets by using UV spectrophotometry and FTIR spectroscopy as well as provide simple, cost-effective and sensitive spectrophotometric method for determination of ciprofloxacin tablets. Six different marketed brands of ciprofloxacin tablets were purchased. The weight of the tablet is defined as the amount of granules which contains the labeled amount of the active pharmaceutical ingredient. Weight uniformity test is required to assure that the drug content in each unit dose is distributed in a narrow range around the label strength. If the drug substance forms the greater part of the oral solid dosage form, any weight variation obviously reflects variation in the content of active ingredient [41]. The smaller the weight variation, the better the uniformity of content. The standards for uniformity of weight are applied to tablets, which are supplied in unit dose form as they are subjected to more variations than comparable preparations supplied in multi-dose forms. For tablets with average weight above 250mg, the percentage deviation from the average weight permissible in the official compendium (BP, 2008) is ±5%. The six different brands of ciprofloxacin met the specification. However, each two tablets from Brand E and F exceeded the 5% deviation from the average weight, but still conformed to the official compendium specification, which stipulates that not more than two tablets must deviate by 5% from the average weight, if twenty tablets are used for the test.
The occurrence of errors might be due to the presence of tablet fragments or dust on the tablets when weighed, wind from airconditioning, flowing properties of the powder, differences in the bulk densities as well as pressured used and particle size distribution during compression. The UV spectrophotometric method depends on the absorbance measurement of drug at the specific wavelength. It is suitable for the quantitative analysis of ciprofloxacin tablets since it contains suitable chromophore that absorbs radiation in the UV region at the maximum wavelength of 276nm. The maximum wavelength was selected as it can be eliminated the interference from excipients. The distilled water was utilized as a solvent as it is easily available and cheaper than other solvent as well as ciprofloxacin is soluble in hydrochloric acid. The filtration can remove the un-dissolved excipients from ciprofloxacin solution. In the assay UV method using distilled water as blank, the results showed that only Brand C passed the test while other samples fell outside the official BP limit. According to USP, two out of six samples (Brand A and C) fell within the USP limit. Brand D and E had the percentage purity level below the official stated limit while Brand B and F had the percentage purity level above the upper limit. In contrast to the assay method using HCl as blank, fifty percent of the brands of ciprofloxacin tablet (Brand A, C and F) conformed to the official BP limits of 90-110%. According to USP, four out of six samples (Brand A, B, C and F) had the percentage purity within the stated requirement. On comparing the two solvents used, it was obvious that the assay results using HCl as blank solution was more accurate than that using distilled water. The reason includes that ciprofloxacin dissolve satisfactorily in HCl rather than in distilled water. The percentage purity might also be affected by factors such as temperature, humidity and light.
Acknowledgement
Authors are highly thankful to the Faculty of Pharmacy, AIMST University for providing financial assistance and laboratory facilities to carry out this research work.
Conflict of Interest
The authors declare that there is no conflict of interest.
Single Journal Submission
This research paper has not been submitted anywhere else.
References
- Andersson M, Mac Gowan A (2003) Development of the quinolones. Journal of Antimicrobial Chemotherapy 51(1): 1-11.
- Sharma P, Jain A, Jain S, Pahwa R, Yar M (2010) Ciprofloxacin: review on developments in synthetic, analytical, and medicinal aspects. Journal of Enzyme Inhibition and Medicinal Chemistry 25(4): 577-589.
- Hooper D (2001) Mechanisms of Action of Antimicrobials: Focus on Fluoroquinolones. Clinical Infectious Diseases 32(1): 9-15.
- Zhanel G, Walkty A, Vercaigne L, Karlowsy J, Embil J, et al. (1999) The new fluoroquinolones: A critical review. The Canadian Journal of Infectious Diseases 10(3): 207-238.
- Correia S, Poeta P, Hebraud M, Capelo J, Igrejas G (2017) Mechanisms of quinolone action and resistance: where do we stand? Journal of Medical Microbiology 66(5): 551-559.
- Aldred K, Kerns R, Osheroff N (2014) Mechanism of Quinolone Action and Resistance. Biochemistry 53(10): 1565-1574.
- Hawkey P (2003) Mechanisms of quinolone action and microbial response. Journal of Antimicrobial Chemotherapy 51(1): 29-35.
- Oliphant C, Green G (2002) Quinolones: A Comprehensive Review. American Family Physician 65(3): 455-465.
- Alangaden G, Lerner S (1997) The Clinical Use of Fluoroquinolones for the Treatment of Mycobacterial Diseases. Clinical Infection Diseases 25(5): 1213-1221.
- Davis R, Markham A, Balfour J (2012) Ciprofloxacin: An Updated Review of its Pharmacology, Therapeutic Efficacy and Tolerability Drugs 51(6): 1019-1074.
- Campoli Richards D, Monk J, Price A, Benfield P, Todd P, et al. (2012) Ciprofloxacin: A Review of its Antibacterial Activity, Pharmacokinetic Properties and Ther Use Drugs 35(4): 373-447.
- Sharma P, Jain A, Jain S (2009) Fluoroquinolone Antibacterials: A Review on Chemistry, Microbiology and Therapeutic Prospects. Acta Poloniae Pharmaceutica - Drug Research 66(6): 587-604.
- Vidyavathi M, Srividya G (2018) A Review on Ciprofloxacin: Dosage Form Prospective. International Journal of Applied Pharmaceutics 10(4): 6-10.
- British pharmacopoeia (2008) London: The Stationary Office.
- (1988) Farmacopéia Brasileira. São Paulo: Atheneu.
- (2005) The United States Pharmacopoeia Rockville, Md.: U. States Pharmacopeial Convention.
- Bayne S, Carlin M (2010) Forensic Applications of High Performance Liquid Chromatography. United States: Taylor and Francis Group.
- Atole D, Rajput H (2018) Ultraviolet spectroscopy and its pharmaceutical applications- A brief review. Asian Journal of Pharmaceutical and Clinical Research 11(2): 59-66.
- Farkas S, Imre S, Muntean D, Tero Vescan A (2013) Analysis of Drug Related Impurities by Infrared Spectrometry in the Class of Statins. Farmacia 61(6): 1091-1101.
- Sharma D, Patel R, Zaldi S, Sarker M, Lean Q, et al. (2017) Interplay of the Quality of Ciprofloxacin and Antibiotic Resistance in Developing Countries. Frontiers in Pharmacology 8: 546.
- Albakaa A, Essa H (2017) New Technique for Estimation of Ciprofloxacin hydrochloride by using UVVIS Spectrophotometer. American Journal of Political Science 17(1): 222-229.
- Ebeshi B, Vaikosen E, Komonbo P (2011) Simple and cost-effective spectrophotometric and titrimetric methods for the determination of ciprofloxacin in tablets. International Journal of Biological and Chemical Sciences 5(1): 28-37.
- Rekha K, Santosh J, Seemarani P, Ashpak T (2015) Difference Spectroscopic Method for the Estimation of Ciprofloxacin Hydrochloride in Bulk and in its Formulation. Pharma Tour 3(7): 51-55.
- Prasad A, Ratna J (2018) Development and Validation of a Simple UV-Spectrophotometric Method for the Determination of Ciprofloxacin HCl Present in Taste Masked Drug Resin Complex. International Journal of Applied Pharmaceutics 10(3): 37-41.
- Cazedey E, Bonfilio R, Araújo M, Salgado H (2012) A First-Derivative Spectrophotometric Method for the Determination of Ciprofloxacin Hydrochloride in Ophthalmic Solution. Physical Chemistry 2(6): 116-122.
- Dermis S, Kilic S, Ertekin Z, Dinc E (2019) Quantitative Analysis of Ciprofloxacin in an Ophthalmic Solution Using UV Absorption Spectrophotometry and Derivative Spectrophotometry. Süleyman Demirel University Faculty of Arts and Sciences Journal of Science 14: 71-76.
- Azeem M, Sadiq T (2018) A Comparative Analysis of UV-Visible Spectroscopic Method vs HPLC method for Determining Content Assay of Ciprofloxacin 500MG tablets. Research Journal of Pharmaceutical Science 7(1): 1-6.
- Saqid T, Azeem M (2017) A Comparative Analysis of UV-Visible Spectroscopic Method VS HPLC Method for Determination of Content Assay of Ciprofloxacin 500MG Tablets. International Journal of Pharmaceutical Science and Health Care 7(3): 48-56.
- Fereja T, Seifu M, Mola T (2015) UV-Visible Spectrophotometric Method Development and Quantification of Ciprofloxaciline in Tablets Dosage Form. American Journal of Pharmacy and Pharmacology. 2(1): 1-8.
- Akram M, Anwar J, Alshemary A, Goh Y, Awan A, et al. (2020) Quantitative determination of ciprofloxacin and levofloxacin antibacterials by Spectrophotometeric and H.P.L.C. Malaysian Journal of Fundamental and Applied Sciences 11(1): 1-4.
- Uddin S, Al Mamun A, Hossain S, Sarwar S, Rashid M, et al. (2017) In vitro quality evaluation of leading brands of ciprofoxacin tablets available in Bangladesh. BMC Research Notes 10(185): 1-9.
- Basavalah K, Nagegowda P, Samashekar B, Ramakrishna V (2006) Spectrophotometric and Titrimetric Determination of Ciprofloxacin Based on Reaction with Cerium (IV) Sulphate. ScienceAsia 32(2006): 403-409.
- Ejele A, Ukiwe L, Enenebeaku C, Ejele N (2015) Evaluation of Drug Quality (III): Determination of Ciprofloxacin Hydrochloride Concentration in Pharmaceutical Tablets. Nigerian Journal of Chemical Research 20.
- Cazedey E, Salgado H (2020) A novel and rapid microbiological assay for ciprofloxacin hydrochloride. Journal of Pharmaceutical Analysis 3(5): 382-386.
- Uncu L, Donici E, Valica V, Vislouh O (2019) Development and Validation of an assay method for Ciprofloxacin Hydrochloride Determination in Combination Ear Drops. Chemistry Journal of Moldova 14(2): 56-61.
- Cazedey E, Salsago H (2012) Spectrophotometric Determination of Ciprofloxacin Hydrochloride in Ophthalmic Solution. Advances in Analytical Chemistry 2(6): 74-79.
- Krishna J, Sandhya B, Huidrom S, Prasad V (2014) Development and Validation of UV Spectrophotometric method for the Simultaneous estimation of Ciprofloxacin Hydrochloride and Ornidazole in Combined Pharmaceutical Dosage Form. Journal of Advanced Pharmacy Education & Research 4(4): 405-408.
- Rajia S, Hasan I, Amin R, Islam A (2015) Efficiency of a Cost-Effective UV Spectrophotometric Method for Estimation of Ciprofloxacin HCl in Marketed Tablet Formulation. International Journal of Pharmaceutical Sciences and Research 6(10): 4277-4283.
- Igboasoiyi A, Offor A, Egeolu A (2018) Quality Assessment of Various Brands of Ciprofloxacin Hydrochloride Tablets Sold in Uyo Metropolis. Nigerian Journal of Pharmaceutical and Applied Science Research 7(2): 89-93.
- Naveed S, Waheed N (2014) Simple UV spectrophotometric assay of ciprofloxacin. Mintage Journal of Pharmaceutical & Medicinal Sciences 3(4): 10-13.
- Kahsay G, G Egziabher A (2010) Quality Assessment of the Commonly Prescribed Antimicrobial Drug, Ciprofloxacin Tablets, Marketed in Tigray, Ethiopia MEJS 2(1): 93-107.
- Joda A, Tayo F, Aina B (2018) Quality assessment of ciprofloxacin tablets obtained from community pharmacy in Lagos, Nigeria. Ife Journal of Science 20(1): 155-168.
- Qassim A (2015) Spectrophotometric Determination of Ciprofloxacin Hydrochloride In Pharmaceutical Formulation Ciproxin. International Journal of Advanced Scientific and Technical Research 5(3): 135-146.
- Ajima U, Onah J, Ogugua S (2015) Development and validation of an extractive ion-pair spectrophotometric method for the determination of ciprofloxacin hydrochloride. Journal of Chemical and Pharmaceutical Research 7(12): 470-476.
- Igboasoiyi A, Attih E, Ofoefule S, Umoh E, Udoh O (2014) Spectrophotometric Determination of Ciprofloxacin Using Charge-Transfer Complexation Technique. International Journal of Innovative Research & Development 3(11).
- Bhongade B, Talath S, Dhaneshwar S (2014) A Validated Method for the Quantitation of Ciprofloxacin Hydrochloride Using Diffuse Reflectance Infrared Fourier Transform Spectroscopy. International Journal of Spectroscopy 2014: 1-6.
- Kurreya R, Mahilanga M, Deba M, Nirmalkarb J, Shrivasa K, et al. (2019) A direct DRSFTIR probe for rapid detection and quantification of fluoroquinolone antibiotics in poultry eggyolk. Food Chemistry 270: 459-466.
- Eri G, Chanti Naik M, Padma Y, Venkata Ramana M, Madhu M, et al. (2014) Novel FT-IR Spectroscopic Method for the Quantitiation of Atenolol in Bulk and Tablet Formulations. Journal of Global Trends in Pharmaceutical Sciences 5(3): 1750-1755.
- Pandey S, Pandey P, Tiwari G, Tiwari R, Rai K (2012) FTIR Spectroscopy: A Tool for Quantitative Analysis of Ciprofloxacin in Pharmaceutical Formulations. Indian Journal of Pharmaceutical Sciences 74(1) : 86-90.
- Sahoo S, Chakraborti C, Mishra S, Nanda U, Naik S (2011) FTIR and XRD Investigations of Some Fluoroquinolones. International Journal of Pharmacy and Pharmaceutical Sciences 3(3).
- Mustarichie R, Gozali D, Herdiana Y (2020) Formulation a Ciprofloxacin Hydrochloride ExtendedRelease Tablet with Combination of Hydroxypropyl Methylcellulose (HPMC) K100M and Hydroxypropyl Methylcellulose (HPMC) K4M by Direct Compression Method. International Journal of Applied Pharmaceutics 12(1).
- Hanafy A (2020) In-vitro bioequivalence, physicochemical and economic benefits study for marketed innovator and generic ciprofloxacin hydrochloride tablets in Saudi Arabia. Journal of Applied Pharmaceutical Science 6(09): 063-068.
- Rekha K, Santosh J, Dilshadbee T, Ashpak T (2015) Estimation of Ciprofloxacin Hydrochloride in Bulk and Formulation by Derivative UV-Spectrophotometric Methods. International Journal of Advances in Scientific Research 1(03): 137-144.
- Rekha K, Santosh J, Seemarani P, Ashpak T (2015) Difference Spectroscopic Method for the Estimation of Ciprofloxacin Hydrochloride in Bulk and in its Formulation. Pharma Tour 3(7): 51-55.
- Shimadzu Corporation (2008) Analytical & Measuring Instruments Division. Instruction Manual. System User’s Guide UV-1800 Shimadzu Spectrophotometer. Japan: Tokyo.
- Agilent Technologies Inc (2019) Innovative. Intuitive. Reliable. Agilent Cary 630 FTIR Spectrometer. Agilent Trusted Answer. USA.
- Gummandi S, Thota D, Varri S, Vaddi P, Jillela V (2020) Development and validation of UV spectroscopic methods for simultaneous estimation of ciprofloxacin and tinidazole in tablet formulation. International Current Pharmaceutical Journal 1(10): 317-321.
- Adegbolagun O, Olalade O, Osumah S (2007) Comparative evaluation of the biopharmaceutical and chemical equivalence of some commercially available brands of ciprofloxacin hydrochloride tablets. Tropical Journal of Pharmaceutical Research 6(3): 737-745.
- Mahrouse M (2012) Development and validation of a UV spectrophotometric method for the simultaneous determination of ciprofloxacin hydrochloride and metronidazole in binary mixture. Journal of Chemical and Pharmaceutical Research 4(11): 4710-4715.
- Nayak A, Pal D(2010) Comparative In Vitro Bioequivalence Analysis of some Ciprofloxacin HCl Generic Tablets. International Journal of Pharmaceutical Sciences and Research 1: 51-57.
- Sahoo S, Chakraborti C, Mishra S, Naik S, Nanda U (2011) FTIR and Raman Spectroscopy as a Tool for Analyzing Sustained Release Hydrogel of Ciprofloxacin / Carbopol Polymer. International Journal of Pharmaceutical Sciences and Research 2(2): 268-277.
- Agilent Technologies (2017) Agilent MicroLab Software. Operation Manual. (7th Edn.). Mulgrave, Victoria, Australia.
