 Research Article
Abstract
The use of medicinal plants and herbs is increasing worldwide and at the same time the demand of consumers to know the botanical and geographical origin of the herbal raw material is growing. Sideritis is a genus that comprises several of the most commonly used medicinal herbs in Greece and the Balkans. The taxonomy of the medicinal Sideritis species which are found in Greek flora was investigated using Diffuse Reflectance Fourier Transform Infrared Spectroscopy (DRIFTS) in combination with discriminant analysis. Dried flowers’ powder of 44 samples of seven Sideritis species and subspecies were analyzed using the 1700-1200 cm-1 spectral region in 1st derivative form for the statistical model building. Forty two samples (95.4 %) were correctly classified. Another set of 14 Sideritis samples validated the statistical model at an 85.7 %. The proposed method is simple, rapid, non-destructive, economical, and environmentally friendly.
Keywords: Sideritis; Medicinal Herbs; Infrared Spectroscopy; Species Differentiation; DRIFTS
Abbreviations: DRIFTS: Diffuse Reflectance Fourier Transform Infrared Spectroscopy; FTIR: Fourier Transform Infrared; DTGS: Deuterated Triglycine Sulfate; PCs: Principal Components
Introduction
The section Empedoclia (Rafin.) Bentham of genus Sideritis L. (Lamiaceae) comprises a taxonomically difficult group of perennial species distributed in the Eastern Mediterranean region [1-5]. All the members of the particular section contain essential oils and are traditionally widely used as tea-producing medicinal plants. In Greece Sideritis species are intensively picked from the wild; they are collectively named ‘tsai tou vounou’ (mountain-tea), highly cherished and occupy a distinguished position in folk medicine. It is worth mentioning that the name of the genus derives from the Greek word ‘sidero’ (iron) denoting a herb that heals wounds caused by iron weapons [6]. All the perennial species of the genus are well known for their anti-inflammatory, anti-ulcerogenic, digestive, antimicrobial and antioxidant properties. In folk medicine the plant material is used dried mainly to boil decoction for the treatment of cold, influenza, feverishness, cough and sore throat [4,7-10]. The cytotoxic properties as well as the essential oils from Sideritis species have been investigated quite extensively through the last decades [7,11].
Perennial Sideritis taxa exhibit morphological similarities to a high degree and often their identification is problematic. Moreover, they are characterized by a strong tendency to hybridize and consequently, well defined species in the East Mediterranean sect. Empedoclia are few [2-5]. Yet, works have been published on chemotaxonomy [5,10] and DNA barcode [12]. The Sideritis chemical composition and antioxidant activity is related to its taxonomic placement [8]. At the same time, the growing demand of consumers and pharmaceutical merchandisers to know the geographical origin as well as the botanical identity of medical and aromatic plants drives the relevant research to the development of efficient methods for the differentiation and determination of species. In the last years Fourier Transform Infrared (FTIR) spectroscopy has been used for discrimination of botanical origin in combination with chemometrics. We mention the differentiation of Leishmania species [13], honey samples from different botanical origins [14], and vegetable oil [15].
The aim of this work is the investigation of seven Sideritis taxa botanical origin using Diffuse Reflectance Fourier Transform Infrared Spectroscopy (DRIFTS) in combination with discriminant analysis.
Materials and Methods
Plant Material
Fifty eight Sideritis samples were collected from different greek geographical regions and were identified to subspecies level using the method of taxonomic key. Forty four (14 Sideritis raeseri, 10 Sideritis scardica, five Sideritis syriaca, four Sideritis clandestina subsp. clandestina, four Sideritis clandestina subsp. peloponnesiaca, four Sideritis euboea and three Sideritis sipylea) were used for calibration and 14 for validation (two samples from each taxon). The inflorescences were separated from the plant, milled in a common blender and pulverized in a ball mill (Retsch MM 2000) for 15 min and sieved with a 90 μm diameter holes sieve. The portion of sample size ≤90 μm was collected for spectroscopic study.
FTIR Spectroscopy
Triplicate FTIR spectra of each sample was recorded in DRIFTS mode using a Thermo Nicolet 6700 spectrophotometer equipped with a deuterated triglycine sulfate (DTGS) detector, resolution 4 cm-1 and 100 scans per sample using a Spectra Tech microcup (diameter 3 mm, height 2 mm) DRIFTS accessory. Pure dried KBr in powder form was used for the background spectra. The collected spectra were smoothed, and the baselines were corrected with the automatic factions of the software accompanying the spectrophotometer (OMNIC 7.3, Thermo Fisher Scientific Inc.). Then the average spectrum of each sample was measured, and its absorbance axis was normalized from a value 0 to 1, using the above software.
Discrimination Analysis
The TQ Analyst software (ver. 8.0.0.245, Thermo Fisher Scientific Inc.) was used for the discrimination analysis. Seven classes were created and named as the corresponding Sideritis species and subspecies (Sideritis raeseri, Sideritis scardica, Sideritis syriaca, Sideritis clandestina subsp. clandestina, Sideritis clandestina subsp. peloponnesiaca, Sideritis euboea and Sideritis sipylea). The 44 average spectra of calibration set were input into software and their corresponding class (actual class) was chosen. The 1700- 1200 cm-1 spectral region in 1st derivative form (Savitzky - Golay method with a 15-point window and a 2nd-order polynomial) and 20 principal components (PCs), with a 99.99 % cumulative value, were used. The software measured a mean spectrum for each class using the corresponding averaged spectra. So, seven mean spectra were created. Subsequently, the 44 average spectra of calibration set were repositioned in each of the seven classes based (calculated class) on the aforementioned spectral region and according to the Mehalanobis distance of each average spectrum from the seven mean spectra. Then the averaged spectra of validation set (14 samples) were imputed in the developed chemometric model.
Results
Spectroscopic Study
A typical mid-FTIR spectrum is extended from 4000 to 400 cm-1 (Figure 1). The spectral range of 4000-1700 cm-1 is similar for every Sideritis sample. The most interesting spectral range is the 1700- 1200 cm-1. The most notable peaks in this area are at 1654, 1613, 1509, 1429, 1377, 1322 and 1262 cm-1.
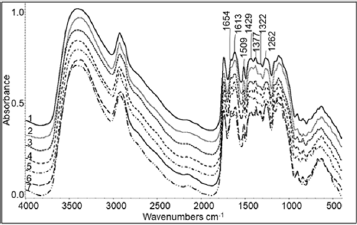
Figure 1: The spectral region 4000 - 400 cm-1 of typical FTIR spectra of Sideritis species:
1) S. raeseri;
2) S. scardica;
3) S. syriaca;
4) S. clandestina;
5) S. clandestina subsp. peloponnesiaca;
6) S. euboea;
7) S. sipylea.
Chemometrics
The discriminant analysis shows that 42 of 44 samples (95.4 %) were correctly classified (Table 1). Table 2 shows the corresponding Mehalanobis distances validation set. The validation exhibits that 12 of the 14 samples (85.7 %) were correctly recognized. Figure 2, as it was extracted by the software, is a representative of the discriminant analysis based on Mahalanobis distance, between Sideritis clandenstina, Sideritis raeseri and Sideritis peloponnesiaca.
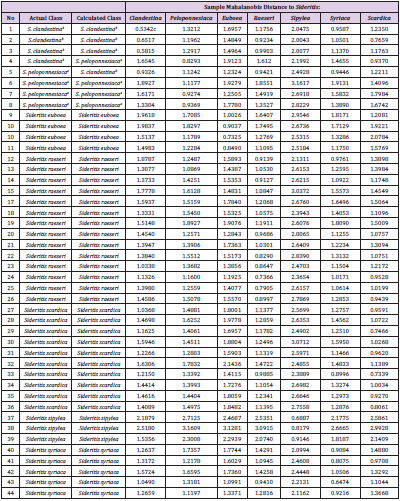
Table 1: Mahalanobis distances between Sideritis taxa of calibration set.
aSideritis clandestina subsp. peloponnesiaca; bSideritis clandestina subsp. clandestina; cbold value is the minimum distance.
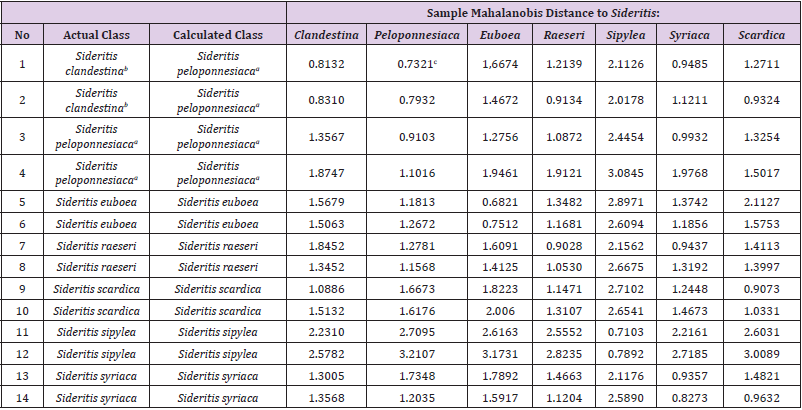
Table 2: Mahalanobis distances between Sideritis taxa of validation set.
aSideritis clandestina subsp. peloponnesiaca; bSideritis clandestina subsp. clandestina; cbold value is the minimum distance.

Figure 2: The Mehalanobis distances of Sideritis samples from S. peloponnesiaca and S. clandenstina.
Discussion
Spectroscopic Study
A typical mid-FTIR spectrum is presented in Figure 1. The differences between the spectra are expected in the range 1700- 1200 cm-1, because proteins, flavonoids, terpenes, polyphenols, nucleic acids, lignin and polysaccharides absorb. The above compounds are differentiated qualitatively or/and quantitatively depending on the Sideritis species [5,12]. Additionally, the range 1500-1200 cm-1 is the most important part of «fingerprint» area and characterizes every sample. In the spectral region 1700- 1200 cm-1 of Sideritis species FT-IR spectra we observe that the differences between spectra are small and focus mainly on small shifts of the maxima, the width and the relationships between the peaks’ heights.
Eight major peaks appear in the above spectral region. The first peak at 1655-1647 cm-1 has been correlated with the C=O stretching of proteins (amide I) [16]. In the same spectral region water [16,17], the C=O of flavones [16], the bases of nucleic acids [18,19] and the C=C [16] absorb as well. The peak centered at 1618- 1607 has been assigned to –COO- asymmetric stretching [19,20]. Also, the N-H bending and C-N stretching vibrations of proteins (amide II) and the aromatic C=C absorb [16]. The third absorption at 1509-1508 cm-1 has attributed to the deformation of phenyl ring [16] and has been associated with the existence of lignin [21,22]. The next peak which presents maximum at 1454-1446 cm-1 consists of several overlapping peaks. The stretching of C=C, the deformation of –CH3 and –CH2CO-, C-N stretching and N-H bending (amide III) [16]. The fifth spectral region centered at 1429-1417 cm-1 is a result of –CH2- bending, -OH deformation, -COH bending of phenols, –COO- symmetric stretching vibrations and C=O of uronic acids [16,23]. The next absorption at 1380-1371 corresponds to – CH2- bending [16], in-plane O-H deformation and C-O combination, and C-C skeletal vibration [16]. The seventh peak at 1325-1317 cm-1 is a convolution of skeletal vibrations of C-C and C-O mainly of polysaccharides [16,23]. Finally, the last peak at 1263-1252 cm-1 has been assigned to the –OH of polysaccharides, asymmetric stretching of PO2- of nucleic acids and C-O stretching [16,19,22].
Chemometrics
As mentioned above, the most suitable spectral region for Sideritis seven species and subspecies discrimination is 1700-1200 cm-1. Indeed, the largest differences between the spectra were located in this spectral region, but most peaks appear as shoulders. The spectra obtain a finer texture and the differences between them are maximized using the 1st derivative (Savitzky - Golay method with a 15-point window and a 2nd-order polynomial). Twenty principal components (PC) were used, according to cumulative eigenvalues diagnostic plot, with a 99.99 % cumulative value (Figure 3). TQ Analyst software creates one principal component spectrum (PCS) for each PC. Each PCS represents an independent source of variation in a data set that represents the amount of variability described by a PC measured across the entire spectral range of the standards [24]. PCS20 (Figure 4) shows that the major changes are highlighted in the spectral range 1700-1200 cm-1, which was chosen for the discrimination. This observation enhances the selection of this spectral range to distinguish the samples.
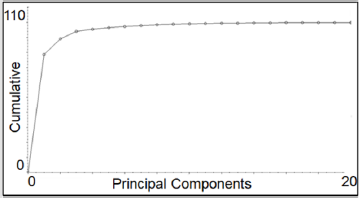
Figure 3: The cumulative eigenvalues diagnostic plot.
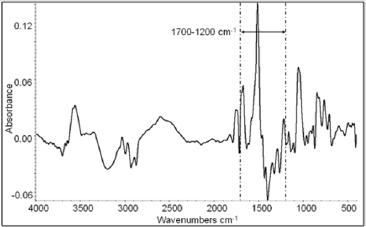
Figure 4: The principal component spectrum 20 (PCS 20).
Conclusion
In this study the use of DRIFTS in combination with chemometrics was investigated for the taxonomic determination of seven Sideritis species and subspecies. The spectroscopic model developed showed a 95.4 % success rate and was validated 85.7 % using unknown samples. The results are considered very satisfactory. Furthermore, the proposed method is rapid, simple, non-destructive for the samples, economical, and environmentally friendly.
Author Contributions
Conceptualization, C.S.P. and P.A.T.; methodology, C.S.P. and P.A.T.; investigation, M.X., G.K. and A.K.; sampling and processing of samples, A.K.; spectra recording and processing, A.K.; botanical taxonomy and identification of samples, G.K.; statistical analysis, C.S.P. and P.A.T.; writing-original draft preparation, review and editing, C.S.P., P.A.T., A.K. and G.K.
Conflict of Interest
The authors declare no conflict of interest.
References
- Heywood VH (1972) Sideritis In: Tutin TG, Heywood VH, Burges NA, Moore DM, Valentine DH, et.al. (Edi.), Flora Europaea. Cambridge University Press, Cambridge, Great Britain 3: 138-143.
- Huber Morath A (1982) Sideritis In: Davis PH (Eds.)., Flora of Turkey. Edinburgh University Press, Edinburgh, Great Britain 7: 178-199.
- Baden C (1991) Sideritis In: Strid A, Tan K (Edi.), Mountain Flora of Greece. Edinburgh University Press, Edinburgh, Great Britain 2: 84-91.
- Gonzalez Burgos E, Carretero ME, Gomez Serranillos MP (2011) Sideritis : Uses, chemical composition and pharmacological activities--A Review. J Ethnopharmacol 135(2): 209-225.
- Stanoeva JP, Stefova M, Stefkov G, Kulevanova S, Alipieva K, et al. (2015) Chemotaxonomic contribution to the Sideritis species dilemma on the Balkans. Biochem Syst Ecol 61: 477-487.
- Gledhill D (2008) The names of Plants. (4th). Cambridge University Press, Cambridge, Great Britain 106(1): 352.
- Kostadinova E, Nikolova D, Alipieva K, Stefova M, Stefkov G, et al. (2007) Chemical constituents of the essential oils of Sideritis scardica and Sideritis raeseri Boiss and Heldr. from Bulgaria and Macedonia. Nat Prod Res 21(9): 819-823.
- Demirtas I, Ayhana B, Sahina A, Aksita H, Elmastasa M, et al. (2011) Antioxidant activity and chemical composition of Sideritis libanotica ssp. linearis (Bentham) Borm. (Lamiaceae). Nat Prod Res 25(16): 1512-1523.
- Koutsaviti A, Bazos I, Milenkovic M, Pavlovic Drobac M, Tzakou O (2013) Antimicrobial activity and essential oil composition of five Sideritis taxa of Empedoclia and Hesiodia from Greece. Rec Nat Prod 7(1): 6-14.
- Fraga BM (2012) Phytochemistry and chemotaxonomy of Sideritis species from the Mediterranean region. Phytochemistry 76: 7-24.
- Venditi A, Bianco A, Frezza C, Serafini M, Giacomello G, et al. (2016) Secondary Metabolites, Glandular Trichomes and Biological Activity of Sideritis montana subsp. montana from Central Italy. Chemistry & Biodiversity 13(10): 1380-1390.
- Tezcan M, Vlachonasios K, Aki C (2010) DNA barcoding study on Sideritis trojana An endemic medicinal plant of IDA Mountain, Turkey. Fresen Environ Bull 19(7): 1352-1355.
- Aguiar JC, Mittmann J, Ferreira I, Ferreira Strixino J, Raniero L (2015) Differentiation of Leishmania species by FT-IR spectroscopy. Spectrochim. Acta A Mol Biomol Spectrosc 142: 80-85.
- Gok S, Severcan M, Goormaghtigh E, Kandemir I, Severcan F (2015) Differentiation of Anatolian honey samples from different botanical origins by ATR-FTIR spectroscopy using multivariate analysis. Food Chem 170: 234-240.
- Osorio MT, Haughey SA, Elliott CT, Koidis A (2015) Identification of vegetable oil botanical speciation in refined vegetable oil blends using an innovative combination of chromatographic and spectroscopic techniques. Food Chem 189: 67-73.
- Socrates G (2001) Infrared and Raman Characteristic Group Frequencies. Tables and Charts. (3rd), John Wiley and Sons, Ltd, Chichester, Great Britain, pp. 366.
- Pappas CS, Tarantilis PA, Polissiou MG (2004) Spectroscopic determination of the degree of esterification of pectic substances from kenaf. Nat Prod Res 18(4): 335-340.
- Carmona P, Molina M (2010) Interactions of Protein and Nucleic Acid Components of Hepatitis C Virus As Revealed by Fourier Transform Infrared Spectroscopy. Biochem 49(23): 4724-4731.
- Tsuboi M (1970) Application of Infrared Spectroscopy to Structure Studies of Nucleic Acids. Appl Spectrosc Rev 3(1): 45-90.
- Chatjigakis AK, Pappas C, Proxenia N, Kalantzi O, Rodis P, et al. (1998) FT-IR spectroscopic determination of the degree of esterification of cell wall pectins from stored peaches and correlation to textural changes. Carbohyd Polym 37(4): 395-408.
- Pappas C, Tarantilis PA, Polissiou M (1998) Determination of Kenaf (Hibiscus cannabinus ) lignin in crude plant material using Diffuse Reflectance Infrared Fourier Transform Spectroscopy. App Spectrosc 52(11): 1399-1402.
- Vivekanand V, Chawade A, Larsson M, Larsson A, Olsson O (2014) Identification and qualitative characterization of high and low lignin lines from an oat TILLING population. Ind Crops Prod 59: 1-8.
- Yang X, Huang M, Qin C, Lv B, Mao Q, et al. (2017) Structural characterization and evaluation of the antioxidant activities of polysaccharides extracted from Qingzhuan brick tea. Int J Biol Macromol 101: 768-775.
- Kouvoutsakis G, Mitsi C, Tarantilis PA, Polissiou MG, Pappas CS (2014) Geographical differentiation of dried lentil seed (Lens culinaris) samples using Diffuse Reflectance Fourier Transform Infrared Spectroscopy (DRIFTS) and discriminant analysis. Food Chem 145: 1011-1014.
