 Review Article
Abstract
The main purpose of this letter is to review the latest achievements in processing of financial series signals and give a retrospective estimation of correlations between the Hurst exponent dynamics and asset prices for main stock Russian indices. Our work concerns the financial crises which took place during about 20 years including dramatical events of the beginning of 2020 originated from the COVID19 pandemic. We analyzed the daily closing asset prices for the MICEX and RTS indices using the rescaled range method and the sliding window for the Hurst exponent with width of 500 working days. The real prices values are compared with the dynamics of the Hurst exponent and some predictive features of the latter have been discovered. In most significant cases including the 2020 crisis we can see tendency of the Hurst exponent to approach 0.5 value before a collapse occurs. It indicates that there are changes in the ratio between long-term investors and short-term speculators. Fundamental analysis of the stock assets works no more and prices begin following unpredictable fluctuations.
Keywords: Hurst exponent; COVID19; financial crisis; fractal market hypothesis; R/S analysis
Introduction
The fractal theory application to solving mathematical problems has gone long beyond the scope of mathematics itself. Modern applications of fractal approaches include physics, radar, information technology, medicine, biology, economics, and other disciplines. The term “fractal” originally proposed by Benoit Mandelbrot does not have any single definition, but it is usually clear from the context what it is about. Usually, it is a self-similar physical or mathematical object, the spatial and temporal structure of which does not change when the scale of consideration is changed. Another interesting feature of a fractal is the difference of its dimension from an integer one. The dimension of the fractal depends on the roughness of the object and characterizes the extent to which the object fills in three-dimensional space. A good example of a fractal is a sequence of stock prices. Indeed, at different scales, price charts often look identical. This feature attracted the attention of Mandelbrot [1], Peters and other researchers who formulated and applied the mathematical fractal apparatus to financial objects. Interest in the analysis of price series, in addition to purely scientific benefits, has also quite material value. By understanding the laws of price behavior, you can predict their future values. Of course, at this stage of scientific comprehension, all forecasts are probabilistic in nature and are not the so-called Golden Grail that allows you to get rich without doing anything. However, we have another proven risk assessment tool, which is great in itself.
In this paper, we will talk about applying the fractal market hypothesis to price series using R/S analysis. The fractal market hypothesis, introduced by Peters in the early nineties [2], has gained considerable popularity over the past two decades. Its main postulates are as follows:
a) The main factor underlying the healthy functioning of markets is liquidity - the provision of supply and demand by a large number of trading participants with different investment horizons
b) The goals and investment horizons of market participants are heterogeneous and include a wide time range, ranging from speculative trading on minute charts to multi-year investments
c) The same information is interpreted differently by different trading participants and as a result, liquidity is provided. On short-term fallings, speculators begin to sell, while long-term investors, on the contrary, see this as an opportunity to buy at reduced prices
d) Price reflects a combination of speculators’ expectations (technical analysis) and long-term investors (fundamental analysis)
e) When in doubt about fundamental information, longterm investors either leave the market or become short-term. Depending on the global nature of this phenomenon, either a temporary panic or a crisis begins.
The purpose of our work is a retrospective analysis of the correlations between stock exchange fluctuations in the Russian market and the corresponding changes in the Hurst exponent. The main events around which we have built our consideration are the global financial crisis of 2008, as well as the collapse of prices in March 2020 as a result of the spread of the COVID-19 pandemic.
Literature Overview
In [3], the correlations between changes in indices of the American stock exchange DJI, Nasdaq, S&P500 and the Hurst indicator were considered. Multifractal detrended fluctuation analysis was applied using a sliding window with a width of 500 working days. Changes in the behavior of the Hurst exponent imply changes in the ratio of investment horizons that occurs before a massive market crash. On the eve of the crisis, shortterm investment horizons begin to prevail and the balance shifts. In [4] the method of R/S analysis and the method of hierarchical analysis were considered as applied to the economic sustainability of industrial enterprises. The purpose of work [5] was to show the predictability of the behavior of price series using the example of currency markets under the assumptions of the fractal market hypothesis and using the Hurst exponent. A brief overview of the existing methods for analyzing the fractality of price series is made: The R/S analysis method, the method based on determining the cell dimension, the standard fluctuation method, the Detrended Fluctuation Analysis (DFA), the multifractal DFA. Changes in the Hurst exponent for major currency pairs from 2008 to 2014 were demonstrated.
In [6], the correlation between the Higuchi dimension (a parameter based on the fractal dimension) and the influence of polarization centers during a crisis is estimated. During the economic crisis, the influence of the polarization centers decreased, this is quantified by Higuchi Dimension, by the decreasing of its value in 2008 (for turnover and companies’ number) and in 2006 and 2010 for profit and employee’s number. In [7] examples are given that fractals are everywhere in the economy. Typical distributions of macro and microeconomic parameters are presented on the example of the Japanese market. The authors of [8] calculated the Hurst indices by the R/S analysis method for the foreign exchange market using the example of the euro-dollar pair and the Russian stock market for the period 2007-2015. Memory availability has been demonstrated. In [9], an overview of all major world stock indices is made. A summary table of these values is provided. The graphs of the change in the Hurst exponent depending on the sample size are given. Hurst exponents were calculated using R/S analysis. The authors of [10] compare the theory of fractal markets and real practice using the example of different statements. An extensive review of the FMH literature is provided. Interesting empirical examples were shown. For example, the fractal dimension breakouts of the value 1.25 from above imply future changes in market behavior. In [11], different types of trading participants are considered within the framework of the fractal market hypothesis. R/S analysis has been performed on the basis of simulated data. In [12], an analysis of the fractal diffusion equation is given. A change in the Levy index can precede changes in price series, which can be used in risk management. In [13], a Markov Switching Model (MSM) is presented, which is in good agreement with the fractal market hypothesis.
Research Technique
To calculate the Hurst exponent, we used the R/S method in our work. It is based on the analysis of the range of values of the studied data (the largest and the smallest value on the studied segment) and the standard deviation. A simplified formula for calculating the Hurst exponent is as follows [14]: H = log(R/S)/log(N/2). Constant a in equation R/S=(a·N)H is taken equal to ½. There are three different classifications for the Hurst exponent:
a) Н = 0.5. It indicates a random row. Events are random and uncorrelated. The present does not affect the future.
b) 0 ≤ Н< 0.5. This range corresponds to antipersistent, or ergodic, series. This type of system is often referred to as “return to the mean”. If the system demonstrates growth in the previous period, then most likely, in the next period a decline will begin. Conversely, if there was a decline, then a close rise is imminent. Such a series is more volatile than a random series.
Despite the widespread acceptance of the mean reversion concept in the economic and financial literature, so far not many antipersistent series have been found.
c) 0.5 < Н < 1.0. We have persistent, or trend-stable series. If the series increases (decreases) in the previous period, then it is likely that it will maintain this trend for some time in the future. The trends are obvious. The trend stability of behavior, or the strength of persistence, increases as H approaches 1. The closer H is to 0.5, the noisier the row and the less pronounced its trend.
In accordance with this classification, knowing the value of the Hurst exponent at each time interval, we can judge the nature of stock market sentiment and the presence of long-term stability in the market at a given time. It should also be noted that we will be interested in the relative changes in the indicator, since they are less sensitive to the calculation error. It is incorrect to estimate the Hurst exponent (H) for an infinite range of data because the series has finite memory and begins to follow random walks. In theory, the process with long-term memory is supposed to originate from the infinitely distant past. But in the chaos theory it is asserted that in any nonlinear system, in its motion, there is always a point where the memory of the initial conditions is lost. This “loss” point is analogous to the end of the natural period of the system. Based on this, it is assumed that processes with long-term memory in most systems are not infinite - they have a limit. It is necessary to come up with a sufficient amount of data for analysis. Peters believes that the amount of data is sufficient when the natural period of the system can be easily distinguished. When there are various data loops available for analysis, this amount should be sufficient. In addition to this, chaos theory states that ten cycles are sufficient. If it is possible to estimate the length of the cycle, then we should use the 10-cycle general course as a set of adequate data. The cycle length or number of points that provide the best memory effect was found to be 300 [15]. In this work, we used the data of the asset prices of the RTS and MICEX indices for more than twenty years from February 24, 1999 to April 17, 2020. The daily closing prices were used as points. Using the sliding window method, we calculated the values of the Hurst exponent for each of the days over the specified period.
Figure 1 shows the calculation results for fluctuations in the Hurst exponent (dashed curve) in comparison with changes in the daily asset prices of the MICEX and RTS indices. Let us consider Figure 1. It clearly shows four local minima of the Hurst exponent: 0.59 from 21.07.2008 (arrow 1), 0.55 from 18.07.2011 (arrow 2), 0.55 from 15.07.2016 (arrow 3) and 0.49 from 13.11.2018 (arrow 4). Figure 2 also shows four similar minima: 0.57 from 03.08.2005 (arrow 5), 0.56 from 14.07.2008 (arrow 6), 0.56 from 03.08.2011 (arrow 7), 0.53 from 19.06.2019 (arrow 8). Let us consider them in more detail. Minimum 1 refers to July 21, 2008. As you can see, a few weeks later, the largest price collapse in the entire history of the Russian market will begin, which will last until the end of 2008. The fall was about 70-80%. The minimum 2 does not precede the global crisis, but in a few weeks the index falls by 25% from 1700 to 1200. The minimum 3 preceded the decline of the index by 20%. It is worth noting that the subsequent decline did not take place in a few weeks, as in the previous two cases, but in a few months. An interesting situation is observed for the minimum 4. The Hurst exponent dropped to exactly 0.5 and stayed there for half a year. Six months later, the market fell by 30% (and the index continues to fall at the time of this writing), caused by the spread of the COVID-19.
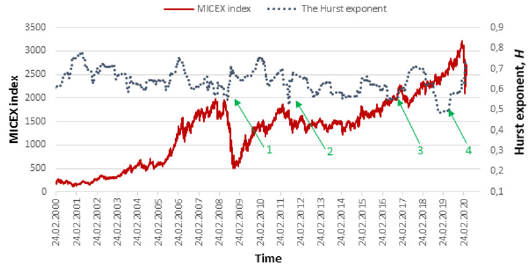
Figure 1: MICEX index for a twenty-year period and the corresponding Hurst indicator, number of points N = 300.
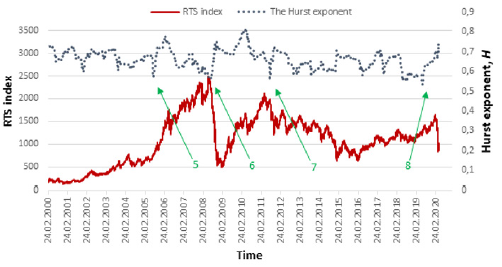
Figure 2: RTS Index for a twenty-year period and the corresponding Hurst indicator, number of points N = 300.
In the latter case, the correlation is strongly leveled by a long time interval between the minimum of the Hurst exponent and the subsequent market crisis. However, if we consider this situation from the point of view of long-term investment, then the presence of such a signal helps to refrain from serious investments on the eve of a panic. If we go to the RTS index (Figure 2), then the overall picture is similar with rare exceptions. The minimum 5 preceded the 25% drop after 8 months. The minimum 6, by analogy with the minimum 1, occurred several weeks before the largest crisis in the Russian market. The minimum 7 came a few weeks before the start of the 35% fall. Finally, the minimum 8 occurred 8 months before the fall in March 2020. At the time of this writing, the size of the fall was 50%.
Conclusion
Based on the results obtained, several conclusions can be drawn. Obviously, there is a correlation between the Hurst exponent reaching the minimum and subsequent significant market declines. In some cases, several weeks pass between these events, in some - several months. In any case, this relationship can be used to build a risk management strategy for both long-term investors and shortterm ones. For example, if H reaches a minimum <0.6, then a longterm investor must sell assets within a few weeks. Conversely, a short-term investor can still buy for at least a few weeks. We used a sliding window with a width of 300 points and daily close prices. One of the directions for further work will be the calculation of the Hurst exponent for other scales. There is also an open question about the time intervals between the minimum of the Hirst indicator and the decline in the corresponding stock index. What determines the order of the delay?
Acknowledgement
The authors thank the Russian Foundation for Basic Research (project no. 18-08-01356-a) for the support, as well as the project “Leading Talents”, no. 00201502 (2016–2020) at JiNan University (Guangzhou, China).
References
- BB Mandelbrot, RL Hudson (2004) The (mis)Behavior of Markets: A Fractal View of Risk, Ruin, and Reward, Basic books.
- Peters E (1994) Fractal Market Analysis. Applying Chaos Theory to Investment & Economics. J Wiley & Sons, New York, USA.
- L Kristoufek (2012) Fractal Markets Hypothesis and The Global Financial Crisis: Scaling, Investment Horizons and Liquidity. Advances in Complex Systems (ACS), World Scientific Publishing Co Pte Ltd 15(6): 1-13.
- A Matviychuk, O Novoseletskyy, S Vashchaiev, H Velykoivanenko, I Zubenko (2019) Fractal analysis of the economic sustainability of enterprise. SHS Web of Conferences 65: 06005.
- O Liashenko, T Kravets (2016) Fractal analysis of currency market: Hurst index as an indicator of abnormal events. 5th International Workshop on Information Technologies in Economic Research (ITER).Conference: ICTERI2016At: CEUR Workshop Proceedings. 1614.
- I Andronache, D Peptenatu, A Ciobotaru, G Karina, G Margareta (2016) Using Fractal Analysis in Modeling Trends in the National Economy. Procedia Environmental Sciences 32: 344-351.
- M Takayasu, H Takayasu (2010) Fractals and Economics.
- OY Sviridov, I Nekrasova (2016) Fractal Analysis of Financial Markets.
- T Ikeda (2017) A fractal analysis of world stock markets. Economics Bulletin 37(3): 1514-1532.
- A Karp, G Vuuren (2019) Investment Implications of The Fractal Market Hypothesis. Annals of Financial Economics. 14(1): 1950001.
- L Vacha, M Vosvrda (2005) Dynamical Agents' Strategies and the Fractal Market Hypothesis. Prague Economic Papers 2005(2): 163-170.
- J Blackledge (2010) The Fractal Market Hypothesis: Applications to Financial Forecasting, Technological University Dublin.
- D Mishelle, PK Sarpong (2018) Fractal Market Hypothesis and Markov Regime Switching Model: A Possible Synthesis and Integration. International Journal of Economics and Financial Issues 8(1): 93-100.
- HE Hurst (1951) Long-term Storage of Reservoirs. Transactions of the American Society of Civil Engineers 116.
- AV Laktyunkin, AA Potapov (2019) The Hurst Exponent Application in the Fractal Analysis of the Russian Stock Market pp. 459-471.
