 Research Article
Abstract
Purpose: The purpose of this study was to compare the rates of hypoglycemia in patients 18 years and older who use an insulin pump with those who take insulin injections. Hypoglycemia is a consequence of diabetes management and leads to a higher risk of morbidity and mortality in people with diabetes. Furthermore, hypoglycemia unawareness is a major risk factor for individuals with diabetes.
Procedure: This study was a retrospective chart review of 128 patients, with 64 patients utilizing insulin pump therapy and 64 patients utilizing multiple daily injection therapy. All patients were monitored using a continuous glucose monitor.
Results: There was no statistically significant difference in the time spent in hypoglycemic range between the two groups. However, additional findings included a clinical significance in that 63.13% of all patients reported hypoglycemia unawareness. Furthermore, patients in both groups experienced hypoglycemic events. The multiple daily injection group also had more outliers showing greater glycemic variability, suggesting subpar glycemic control.
Conclusion: Further research is suggested to determine the prevalence of hypoglycemia and interventions to help prevent hypoglycemic events. It is imperative to advocate and educate for evidence- based, best practice guidelines by conducting and supporting research related to continuous glucose monitors and glucose control.
Introduction
It is estimated that 30.3 million people had diabetes in 2015 and 30.2 million of those individuals were ages 18 and older [1]. Achieving optimal glucose control is an important concept to help prevent the microvascular and macrovascular complications that occur due to poorly managed blood glucose values [2]. Optimal glucose control can be a challenge for individuals living with type 1 and type 2 diabetes. The challenge exists because of the risk of hypoglycemic episodes for those individuals on insulin, whether using insulin injections or insulin pump therapy [2]. Hypoglycemia is a significant consequence of diabetes management [3]. Severe hypoglycemia contributes to a higher risk of morbidity and mortality in individuals with type 2 diabetes [3,4] found there was a higher risk for severe hypoglycemia in those who had poor glycemic control, renal damage, and cognitive impairments.
Hypoglycemia is a metabolic complication of both type 1 and type 2 diabetes and is one of the major issues that can arise when trying to appropriately manage blood glucose [2]. Hypoglycemia is associated with a high morbidity and mortality rate and the estimated annual cost is $39 million [5]. Recurrent hypoglycemic events can alter awareness of hypoglycemia which increases the incidence of short and long-term consequences [2]. The unawareness of hypoglycemia increases the complications of patients with diabetes treated with insulin [6,7]. Patients with hypoglycemia unawareness are unable to notice signs and symptoms of low blood glucose, increasing the risk of adverse effects including acute cerebrovascular disease, myocardial infarction, neurocognitive dysfunction, retinal cell death, and loss of vision as well as problems related to activities of daily living such as sleeping and driving [3]. Continuous glucose monitoring requires a prescription to obtain and is much more expensive than a selfmonitoring blood glucose (SMBG) monitor (National Institute of Diabetes and Digestive and Kidney Diseases [7].
In spite of this, a continuous glucose monitor (CGM) has the potential to be beneficial in reducing the incidence of hypoglycemic occurrences [2]. The CGM displays blood glucose values and trends in real time with alerts to allow the individual to monitor if values are hypoglycemic, normoglycemic or hyperglycemic. Flash glucose monitoring does not provide real-time and continuous data with alerts for hypoglycemic, normoglycemic or hyperglycemic occurrences [2]. Individuals who may benefit from CGM therapy include individuals on intensive insulin therapy, hypoglycemia unawareness, and/or with frequently low or high blood glucose levels [7]. Many of the individuals who currently use CGMs have type 1 diabetes. Research is being conducted on the benefits and effects of CGM use of those with type 2 diabetes [7]. According to one study, the use of a CGM helped to reduce the time individuals spent in hypoglycemia, compared with those using flash glucose monitoring [2]. The benefits of CGM compared to self-monitoring of blood glucose (SMBG) includes better management of glucose levels throughout the day, less incidence of low blood glucose emergencies, and the need for fewer finger sticks via SMBG monitors [7].
Purpose and Significance of Research
A greater understanding of hypoglycemia regarding the use of insulin therapy, whether by pump or injection, is needed to promote a decrease in the incidence of hypoglycemic occurrences, tighter control of consistent blood glucose values, as well as the prevention of severe hyperglycemic occurrences. Continuous glucose monitoring has the potential to aid in prevention of hypoglycemic occurrences and the morbidity, mortality, and secondary complications that occur as a result or in relation to diabetes [8].
Design
A retrospective chart review was used for this study. The sampling strategy was a convenience sample gathered from patient charts from a diabetes specialty clinic in the Southern United States. Data from individual charts of those who met study criteria was collected and recorded on a study tool created by the researchers and approved by the owner of the clinic. Study inclusion criteria included individuals who were aged 18 or older using either insulin pump or insulin injections. Individuals using oral medications for the treatment of diabetes were also included if they were on insulin injections or insulin pump therapy. Additional inclusion criteria included the use of a CGM for a minimum of two weeks consecutively. Exclusion criteria for the study included individuals younger than 18 years old and/or individuals only using oral medications for the treatment of diabetes. Other exclusion criteria included those monitoring glucoses through finger stick only or having used a CGM for less than 2 weeks. Prior to data collection, the review board of Northwestern State University approved the pilot study and approval was obtained from the owner and operator of the diabetes clinic. There were no ethical conflicts with this study. Data was collected until there were 64 subjects in each group. The CPT code 95251 was used to determine data eligible to study.
Population
A sample size calculation was performed to identify the needed amount of study data to ensure results were valid. Sample size needed per group was 64 individuals in the group using insulin injections for blood glucose management on the continuous glucose monitor and 64 individuals in the group using an insulin pump for blood glucose management on the continuous glucose monitor. The subject population included 128 subjects’ total. Health status, gender and ethnicity of these individuals varied, but all subjects had a diagnosis of type 1 or type 2 diabetes. All individuals were on continuous glucose monitoring and met inclusion criteria discussed. The continuous glucose monitor used by study individuals provided a continuous measurement of the study subjects glucose readings. Individual electronic medical records were pulled by the CPT code 95251 (CGM data interpretation) to ensure no subject was duplicated and all included subjects were using continuous glucose monitoring. There was a modifier in the report to ensure only subjects 18 years of age and older were included.
Demographics
Participants were selected using a convenience sampling method and included all patients who met inclusion criteria. Information was gathered retrospectively, therefore no informed consent was needed. A total of 72.66% of all patients had type 1 diabetes and 27.34% had type 2 diabetes. Race and ethnicity were as follows: 14% were black, 84% Caucasian, and <1% were Hispanic or Asian. Fifty percent of patients utilized insulin pump therapy and 50% utilized MDI therapy for the treatment of diabetes. Of all patients with type 1 diabetes, 63% used an insulin pump and only 14% of patients with type 2 diabetes used an insulin pump. For all patients included in the study, the average age was 49 years old, and the average HbA1c was 7.8%.
Data Collection
The investigators gathered all information obtained from the diabetes clinic. A data collection tally form, created by the investigators, listed all data obtained from the electronic medical record without patient identifiers. The investigators retrospectively tallied the hypoglycemic events recorded in the electronic medical record. Conclusions were made on the data obtained to determine if there was a statistically significant difference in rates of hypoglycemia in individuals with insulin pump therapy versus those on insulin injections. Implications for practice were stated to help assist other medical providers in discussing treatment options with their patients, to potentially utilize the device to help with predicted hypoglycemic events. The study aimed to compare rates of hypoglycemia in patients aged 18 or older who use an insulin pump versus insulin injections, using continuous glucose monitoring, to promote a decrease in morbidity and mortality associated with hypoglycemic events.
Data Analysis
The Shapiro-Wilk Test of Normality uses the distribution platform to examine a continuous variable [9,10]. Kruskal-Wallis Test is a non-parametric test used to determine statistically significant differences between two groups [9,10]. The null hypothesis is that data is normally distributed. If the alpha level is 0.05 and the p-value is less than 0.05, the null hypothesis is rejected [9,10]. Therefore, the data is not normally distributed. If the p-value is greater than 0.05, the null hypothesis is accepted [9,10]. The SAS version 9.4 software was used to run statistics with a 0.05 level of significant difference. The following data was collected from the patient charts using the data collection tool developed by the researchers: age, gender, race/ethnicity, diagnosis (type 1 or type 2 diabetes), number of years diagnosed, treatment regimen (insulin pump or MDI), most recent hemoglobin A1c, presence of hypoglycemic unawareness, and percent of time spent in hypoglycemic range. The ages of the patients ranged from 18 to 86 years old. Of all the charts, 51.56% of the patients were male (n=66) and 48.44% were female (n=62). Caucasians made up the largest percent of the patients at 84.38% (n=108), 14.06% were African American (n=18), 0.78% were Hispanic (n=1), and 0.78% were Asian (n=1) (Table 1).
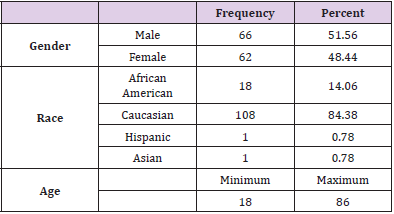
Table 1: Demographic Characteristics of Patients.
The charts of 64 patients were in the insulin pump group and the charts of 64 patients were in the MDI group. Of the 128 patient charts, 72.66% of the patients had type 1 diabetes (n=93) and 27.34% of the patients had type 2 diabetes (n=35). Of patients with type 1 diabetes, 36.56% were on MDI therapy for diabetes (n=34) and 63.44% utilized pump therapy (n=59). The majority of patients with type 2 diabetes were on MDI therapy (85.71%, n=30) and only 14.29% utilized insulin pump therapy (n=5) (Table 2). The presence of hypoglycemia unawareness was a selfreported variable and noted in the EMR. Of all the charts reviewed, 53.13% of all patients reported the presence of hypoglycemia unawareness (n=68). Approximately 46.88% (n=60) denied having hypoglycemia unawareness. For patients who reported hypoglycemia unawareness, 39.71% were on MDI therapy (n=27) and 60.29% were on insulin pump therapy (n=41). The majority of patients in the MDI group (61.67%) denied having hypoglycemia unawareness (n=37) (Table 3). For all patients, the age range was 18 to 86 years of age with a median of 49.97 years old. The average years diagnosed was 20.1 with a range from one to 55 years having diabetes. The average HbA1c for all patients was 7.8% with a range of 4.8% to 13%. The average time spent in hypoglycemic range was 3.67% with a range of 0% to 28% (Table 4).
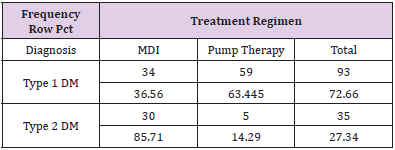
Table 2: Frequency of Diagnosis and Frequency of Diagnosis by Insulin Regimen.
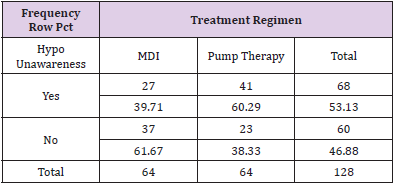
Table 3: Frequency of Hypoglycemia Unawareness by Treatment Regimen.
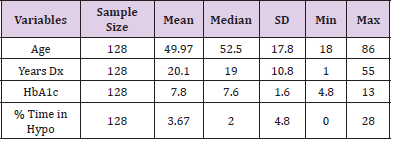
Table 4: Distribution of Continuous Variables for all Patients.
Patients who were on MDI therapy ranged from ages 18 to 82 and patients on insulin pump therapy ranged from 18 to 86 years of age. The average age in the MDI group was 53.2 years old. The average age for patients in the pump group was 46.6 years old. The average time of diagnosis with diabetes for patients in the MDI group was 18.5 years with a range from one to 43 years. The average time of diagnosis for the pump group was 21.8 years with a range from 5 to 55 years (Table 5). The average HbA1c for the MDI group was 7.9% with a range of 5.5% to 13%. The average HbA1c for the pump group was 7.7% with a range from 4.8% to 11.7%. The upper quartile (75%) of the HbA1c levels for patients in the MDI group was 8.8%, meaning 25% of patients had HbA1c levels greater than 8.8%. The patients in the pump group had a 75th percentile of 8.3%, with this data showing slightly better HbA1c levels. The average percent of time in hypoglycemic range in the MDI group was 3.6% with a range of 0% to 28%.
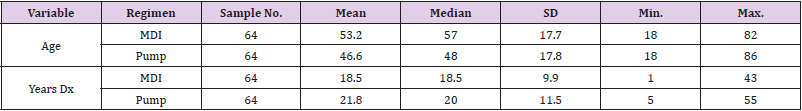
Table 5: Distribution of Continuous Variables for all Patients.
The average percent of time spent in hypoglycemic range for the pump group was 3.7% with a range of 0% to 14%. The MDI group had 25% of patients who spent greater than 4.4% of time in hypoglycemic range. The pump group had 25% of patients who spent more than 6% of time in hypoglycemic range. This data suggests that although the patients in the pump group had a slightly better overall average HbA1c, there was more time spent in hypoglycemic range in the pump group (Table 6). It is also noted that there were outliers in the groups for HbA1c levels and percent of time spent in hypoglycemic range. The MDI groups displayed a hemoglobin A1c range of 5.5%-13% while the pump therapy group indicated a range of 4.8%-11.7% (Table 6). Chi-square was performed to compare proportions of patients with HbA1c levels under control at less than 7%. A HbA1c goal of less than 7% is based off general guidelines by the American Diabetes Association for adults (American Diabetes Association, 2018a).
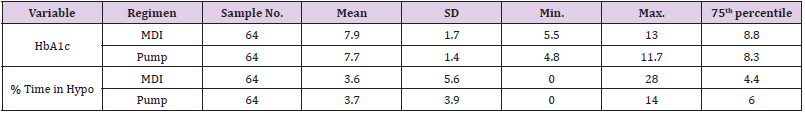
Table 6: Descriptive Statistics for Percent Time and HbA1c by Treatment Regimen.
The patients in the MDI group had 67.2% of patients with an HbA1c level greater than 7%, therefore only 32.81% were at goal of less than 7%. The pump therapy group had 71.88% with a HbA1c level greater than 7% and 28.13% had a HbA1c at goal. Overall, 69.5% of all patients had a HbA1c above target of 7%. This data was not significant (p=0.56) (Table 7). To determine if there was a significant difference in hemoglobin A1c between the two groups, the Kruskall-Wallis Test was performed. There was no significant difference in hemoglobin A1c levels between the two groups (p=0.76) (Table 8). To determine if there was a significant difference in time spent in hypoglycemic range between the two groups, the Kruskal-Wallis Test was used. There was no significant difference in the time spent in hypoglycemic range (p=0.27). Therefore, the null hypothesis is accepted (Table 9).
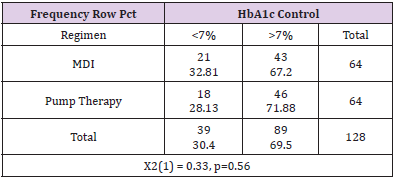
Table 7: Chi-Square Test to Compare Proportion of Patients with HbA1c in Control (HbA1c<7%).
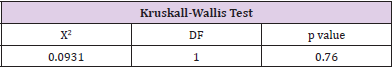
Table 8: Nonparametric Test for HbA1c.
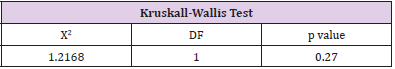
Table 9: Nonparametric Test for Percent of Time in Hypoglycemic Range.
Summary
Although where was no statistically significant difference in time spent in hypoglycemic ranges between the two groups (p=0.27), the data still provided clinical significance. Researchers found that 53.13% of all patients reported hypoglycemia unawareness, with 60.29% of pump users and 39.71% of those in the MDI group reporting experiencing hypoglycemia unawareness. Patients in the MDI group spent 3.6% of time in hypoglycemic range and insulin pump users spent 3.7% of time in hypoglycemic range. Although not statistically significant, the presence of hypoglycemia and hypoglycemia awareness is of clinical importance to the medical community.
References
- (2017) American Diabetes Association. National diabetes statistics report.
- Reddy M, Jugnee N, El Laboudi A, Spanudakis E, Anantharaja S, et al. (2018) A randomized controlled pilot study of continuous glucose monitoring and flash glucose monitoring in people with Type 1 diabetes and impaired awareness of hypoglycemia. Diabetic Medicine 35(4): 483-490.
- Kalra S, Mukherjee JJ, Venkataraman S, Bantwal G, Shaikh S, et al. (2013) Hypoglycemia: The neglected complication. Indian Journal of Endocrinology and Metabolism 17(5): 819-834.
- Lee AK, Lee CJ, Huang ES, Sharrett AR, Coresh J, et al. (2017) Risk factors for severe hypoglycemia in black and white adults with diabetes: The atherosclerosis risk in communities (ARIC) study. Diabetes Care 40(12): 1661-1667.
- Edridge CL, Dunkley AJ, Bodicoat DH, Rose TC, Gray LJ, et al. (2015) Prevalence and incidence of hypoglycemia in 532,542 people with type 2 diabetes on oral therapies and insulin: A systematic review and meta-analysis of population-based studies. plos one 10(6): e0126427.
- Tkacs N (2002) Hypoglycemia unawareness: Your patients with diabetes won't always know when their blood sugar is low. AJN American Journal of Nursing 102(2): 34-41.
- (2017) National Institute of Diabetes and Digestive and Kidney Diseases. Continuous glucose monitoring.
- Olaffsdotir A, Polonsky W, Bolinder J, Hirsch I, Dahlqvist S, et al. (2017) A randomized clinical trial of the effect of continuous glucose monitoring on nocturnal hypoglycemia, daytime hypoglycemia, glycemic variability, and hypoglycemia confidence in persons with type 1 diabetes treated with multiple daily insulin injections (GOLD-3). Diabetes Technology & Therapeutics 20(4): 274-284.
- Kruskal WH, Wallis WA (1952) Use of ranks in one-criterion variance analysis. Journal of the American Statistical Association 47: 583-621.
- Shapiro SS, Wilk MB (1965) An analysis of Variance test for normality (Complete samples). Biometrika 52: 591-611.
