 Research Article
Abstract
Hypomagnesaemia (HMg) of ruminats is a metabolic, possible acute and lethal, disease associated with relative or absolute dietary Mg-deficiency. This study assesses associations of HMg morbidity with cropland (Mg/Ca) ratio from 1986-90 [(Mg/Ca).88] and the late observed bias in 1979-83 against the general trend. National total SO2 emission and lead (Pb) pollution via gasoline are assessed as additional factors, too. Population density [Pop.dens] has been used as a measure for pollution distribution. The cattle and (Mg/Ca) data are the same available as in earlier publication. Data are processed by Whole Country (WhC) and by continental Finland (CONT).Periods are used by their last two numbers, as (79-83) for 1979-1983. Period (79-93) includes data from 8 Decembers, (94-96) from 36 months.
Results: (explanation proportion, R square %)(signif.)(sign(s) of coefficients) (proportions of beta coefficients): HMg associated inversely with [(Mg/Ca).88] and positively with [Pop.dens] in both periods. [HMg.(79-93)] was better explained by [Pop. dens] and HMg.(94-96) better by [Mg/Ca).88] Combined regression by [(Mg/Ca).88;Pop. dens] explained HMg.(79-93) by 61.4 % (p = 0.014)(+;-)(45:55), and HMg.(94-96) by 42.2 % (p = 0.085)(+;-)(60:40). In Uusimaa, with the highest [Pop.dens], the decreasing trend of SO2 and Pb pollution complied with simultaneous decrease in HMg. Carbonate soils of Åland did not protect, but was possibly even a risk on HMg as expected by the soil analyses.
Conclusion: HMg associated regionally generally negatively with cropland Mg/ Ca ratio. The exception in 1979-83 can be explained by associations with SO2 and lead pollution. [Pop.dens] associated highly significantly positively with regional HMg.(73-93) in continental Finland.
Keywords: Regional, Hypomagnesaemia, Cattle, Cropland (Mg/Ca) Ratio, Veterinary Reports
Abbreviations: HMg – Hypo-Mg, Hypomagnaesemia (including grass tetany); (Mg/Ca): (Mg/Ca).88: cropland (Mg/Ca) from 1986-90; Provinces (old, as 1974-97); RC: Rural Centers/Agricultural Advisory Centers; “(79-93).Dec”: mean data of eight Decembers (1979, 1981,1983, 1985, 1989,1991, 1992 and1993); “(94- 96).(1/12)”: mean annual data from 1994, 1995 and 1996 divided by 12, i.e. mean monthly data; t: ton; [(Mg/Ca).88;Pop. dens]: combined (regression by) cropland [(Mg/Ca).88] and population density
Introduction
Hypomagnesemia (HMg) of ruminats is a metabolic disease, most common in early spring and late autumn, affected e.g. by amounts of utilized potassium (K) and Nitrogen (N) fertilizers [1]. For prophylaxis has been suggested to avoid high K/(Ca+Mg) ratio in fodder and for balancing K excess has been recommended to add NaCl to pasture salt mixtures. “The simpliest and cheapest method against grass tetany is to give to cows such pasture salt mixture, which is rich in magnesium and contains effective amounts of phosphor, NaCl and copper” [2].
Weather conditions (associated with poor sugar content of grass) and poor appetite can cause grass tetany even when pasture magnesium has been in the normal limits, anyhow moderately low [3]. Disturbances in fermentation processes of rumen can (often) be associated with overproduction of NH4+, which reduces Mg absorption [4]. The most prominent signs of hypomagnesemia are excitations and muscle cramps, which are closely correlated with the Mg concentration in the CSF. It is suggested that the clinical signs are caused by spontaneous activation of neurons in the CNS at low Mg concentrations, which leads to tetany [4]. Veterinary surgeon Seppo Haaranen represented that disturbances in rumen function with excess NH4+ production could be the most important factor in the development of hypomagnesaemic tetany and explain the rapid progression of HMg [5].
SO2 emissions has been the main cause for acid rains [6]. Acid rains increase leaching of main cations, Ca and Mg, which are replaced (usually by carbonates, sulfates or another non-silicates), so diluting soil Si(OH)4 content, which could additionally influence on Mg uptake by cells [7]. Acid rains can increase uptake of harmful metals like aluminium and influence on micro-organisms and water economy of plants. Lead (Pb) pollution via gasoline consumption in traffic could cause irritability and loss of appetite, which could promote the development of HMg [8].
Cropland Mg/Ca has shown association with timothy Mg/ Ca [9] and bovine provincial HMg/HCa ratio [10]. Cattle HMg associated negatively with cropland Mg/Ca ratio in periods (79-93) and (94-96) [11], but in subperiod (79-83), this association was positive (not reported in [11], because positive explanation by 7.9 % seemed to be below threshold of publication). The aim of this study is to clarify the bias in 1979-1983 by assessing associations of provincial HMg [incidence (1/100,000)] with cropland (Mg/Ca) ratio and changes in SO2 and Pb pollution.
Materials and Methods
Cropland (Mg/Ca) values from 1986-90, number of dairy cows and morbidity data on HMg (based on monthly reports of veterinary surgeons) are the same as in [11]. Periodical morbidity numbers are re-calculated and slightly revised: Periodical HMg incidence is attained by dividing mean number of periodical cases by mean periodical number of cattle.
Periodical December values, with postfix “.Dec” do not contain data from every year. Period (79-93), “(79-83).Dec”, includes data from three separate years (Decembers) (1979, 1981 and 1983). Period (85-93), “(85-93).Dec” includes data from five years (Decembers) (1985, 1989, 1991, 1992 and 1993). Period (94- 96) includes data from 36 months, about 82 % of all HMg data, in contrary to (79-93), which contains data only from 8 months. Values of from (94-96) are annual data divided by 12: “(94-96).(1/12)”.
Estimated data on SO2 emission are measured by ruler from picture in [12]. SO2 emission began to increase in the 1950’s. Estimated SO2 emission of Finland exceeded 100, 000 t/a in 1962- 94 and 400,000 in 1968-82. Values on 1979-96 are represented on Table 1. Pb pollution has been (Table 1) calculated by gasoline lead content by one gasoline producer and Finnish gasoline consumption: Pb content of Futura gasoline decreased as follows: in 1981 from 0.7 to 0.4, in 1985 to 0.2 and in 1989 to 0 g/L [13], lead addition to higher octane gasolines continued ad 1993 [13]. Total Gasoline consumption is attained from [14] (Figure 1).
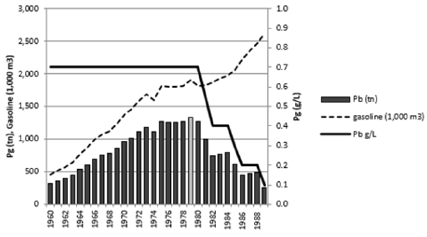
Figure 1: Estimated lead pollution in Finland during 1960-89.
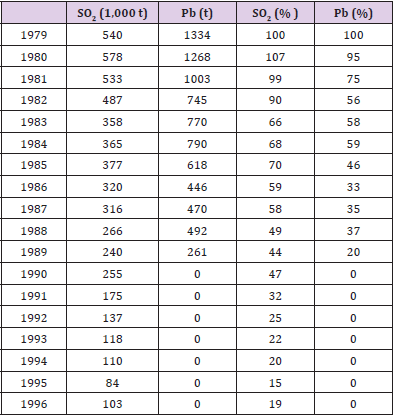
Table 1: SO2 and Pb emissions.
Supposed was that Pb in Futura gasoline [13] was moderately similar as other gasolines, because their Pb content was regulated by legislation in Finland as in many other countries.
Regional pollution intensity is approximated by population density (Pop.dens), inhabitants per dry land [15] (Table 2), supposing that production of SO2 and lead (for traffic and warming) are dependent on population density. Table 2 includes provincial cropland (Mg/Ca) values, the same as in [11].
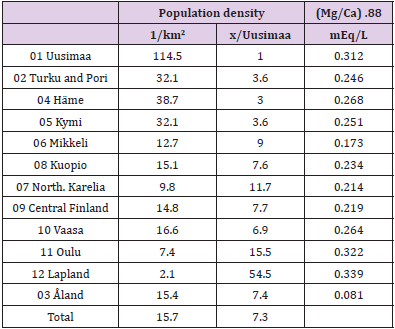
Table 2: Provincial population density, population density relative to Uusimaa, Cropland (Mg/Ca) per Uusimaa, Cropland (Mg/Ca).
Note: In calculations has been benefited program IBM SPSS Statistics 27.
Results
The means and medians of HMg had increased slightly between periods (79-83) and (85-93) and after that more, so that mean of whole year values (94-96) was two-fold and median about threefold to December values of (79-93) (Table 3). Remarkable is that HMg morbidity, 20.9/100,000, of Åland in (79-83) included only two HMg cases during 3 Decembers (Table 3 in [11]), but in (94-96) HMg.Åland (71.6/100,000) included 62 original cases.
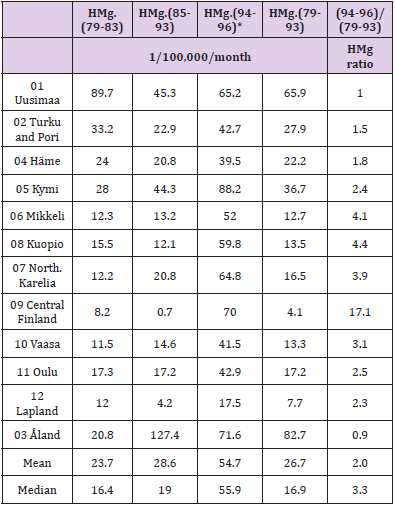
Table 3: Monthly incidence of HMg in periods.
Change in exposition to pollutants was great during the experimental period. SO2 and Pb expositions were declined ca 60 % until 1983 and until 1993 Pb exposition was stopped and SO2 exposition was decreased by 80 % (Figure 3). In (94-96) SO2 exposition was still slightly reduced (Table 1). HMg values (black colums) of Uusimaa is based on data in [11]. Missing data grey colums are estimated by linear interpolation.
First are assessed regional associations between HMg and pollutants. [Pop.dens] is replacing here more delicate measures of co-incident exposure ((Figure 4, 5)) (Table 4).

Figure 2: HMg of periods (79-83), (85-93), (94-96) and (79-93), trendlines for periods (79-83) and (85-93) and cropland (Mg/Ca).

Figure 3: Pb and SO2 expositions relative to 1979.
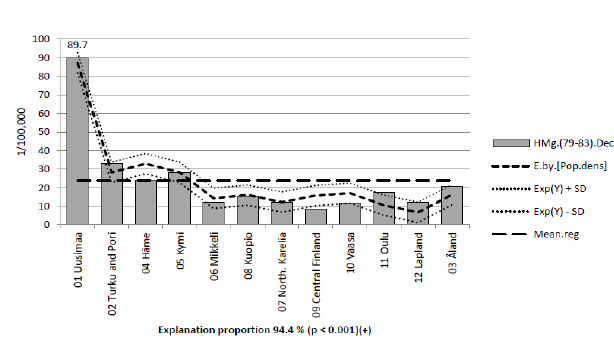
Figure 4: HMg.(79-83) and its regression by [Pop.dens].
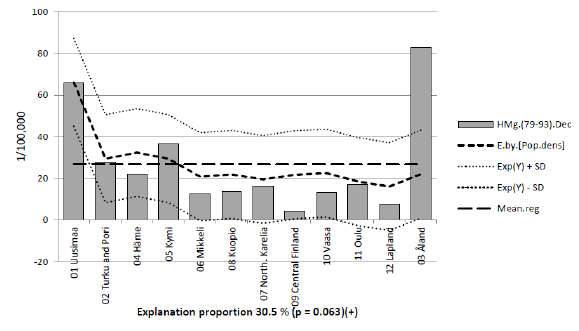
Figure 5: HMg.(79-93) and its regression by [Pop.dens].
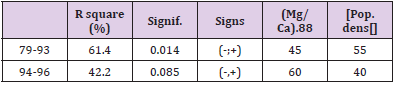
Table 4: R square, significance, signs and relative weight of beta coefficients in regressions of HMg.(79-93) and (79-93).(94-96) by [(Mg/Ca).88;Pop.dens].
Note: [Pop.dens] explained HMg variation better in (73-93) than in (94-96), better in CONT than in WhC: Figures 5 and 6.
Table 5 shows associations of HMg with [(Mg/Ca).88]. [(Mg/ Ca).88] explained HMg better in (94-96) than in (79-93) and in WhC than in CONT. Associations were negative in all, but positive in CONT in (79-93): Table 5 and Figures 7 & 8. In combined regressions of HMg by [(Mg/Ca).88;Pop.dens] proportion of [(Mg/ Ca).88] – estimated by its absolute beta coefficients – in explaining the association was less than 50 % in (79-93), but > 50 % during (94-96): (Table 6), Figures 9 & 10. Combined regression [(Mg/ Ca).88;Pop.dens] explained HMg.(94-96) by 41.6 % (p = 0.089), better and more significantly than by plain Mg/Ca) (25.8 %, p = 0.092). Proportion of absolute beta coefficient for (Mg/Ca) was higher (60 %) than for population density (40 %). HMg incidence in this database, which represents 82 % of monthly periods, was the second highest.
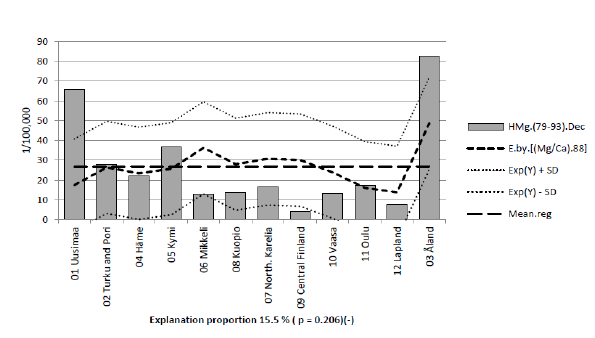
Figure 6: HMg.(79-93) and its regression by [(Mg/Ca).88].
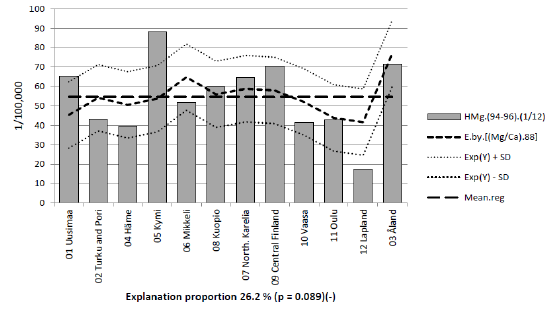
Figure 7: HMg.(94-96) and its regression by [(Mg/Ca).88].
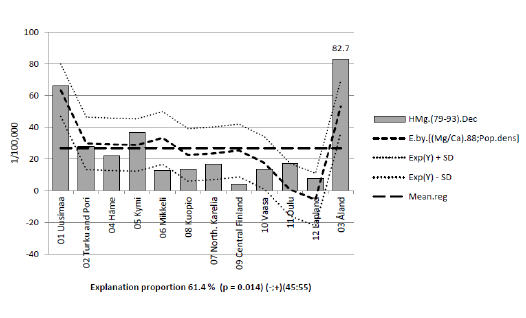
Figure 8: HMg.(79-93) and its regression by [(Mg/Ca).88;Pop.dens] in WhC.
Note: [(Mg/Ca).88] explained HMg.(94-96) variation by 25.5 % (p = 0.092). HMg.(94-96) was the second highest in Finland.
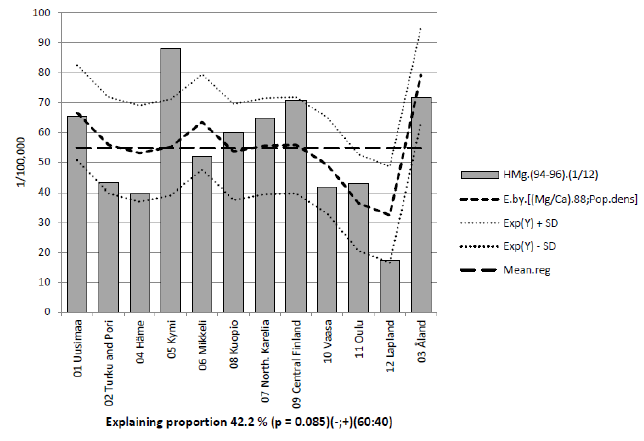
Figure 9: Provincial HMg.(94-96) and its combined regression by [(Mg/Ca).88;Pop.dens].
Discussion
During the period of heavy and decreasing atmospheric pollution by SO2 (and Pb) HMg complied with these changes in Uusimaa with highest population density (Fig. 3). Mg supplementation of croplands had increased strongly since 1972 [16], but this increase was to be seen in organic soils first since 1985 [17], after the reduction of acid rain. It is possible that SO2 (acid rains) could have participated in cropland Mg loss in Finland, especially in 1968-82, when SO2 exposition was > 400,000 t/a, as in [7]. So that SO2 could have affected on HMg via Mg associated mechanisms. Effects of Pb are not evaluated separately from SO2 effects.
Population density as a selected measure of SO2 and Pb distribution explained better HMg variation in (79-93), (Figures 4 & 5), during the heaviest atmospheric pollution, than in (94-96), when the worst period of pollution was passed. Low number of samples in (79-83) reduces importance of Fig. 4. Population density as a measure for exposition does not possibly work as well by Åland based on geographic factors: situation on isles, obviously with better “ventilation”. Small number of cattle and cases in Åland before 1994 was possibly biggest confounding factor, anyhow. Population density has been changed during 1979 – 1996, but correlation between population densities in1980 and 1990 was 0.999 [15].
Because so many other factors than plain dietary Mg deficiency affect on the development of HMg, it is a surprise that the association in both main periods, (79-93) and (94-96), anyhow showed a negative trend. During (94-96) [(Mg/Ca).88] explained HMg statistically by 25.8 % (p = 0.092), although number of scores was only 12. Soil (Mg/Ca) was lowest in Åland and in (79-93) HMg was the highest (Fig. 6 & 8) and the second highest in (94-96) (Fig. 7 &9). This could suggest that low CHD mortality in Åland is obviously not based on high Mg availability [18].
Obviously indoor feeding (in Decembers) could protect against grass tetany (Tabl.3). This shows seasonal dependence, i.e. HMg was obviously still in the 1990’s more pasture than indoor disease. In the 1950’s when large scale prophylaxis with Mg-containing fodder salt mixture begun the expositions to SO2 [12] and Pb [14] were low. It is possible that the strong acid rain caused some biases in field trials by fertilizers and liming agents.
Possibly acid rains primarily (have) reduce(d) biological activity of soil [6,19] and reduced availability of plant nutrients, e.g. [20], reduced biological weathering of silicates, e.g. [21], so reduced Si(OH)4 production and reduced the antacid effect of silicates, CO2 consumption, in croplands [22]. There are obviously anyhow only indirect data for supporting that acid rain as such could decrease cropland Si(OH)4: Acid rain can decrease soil main cations [6,7]. Cropland Cation Exchange Capacity is “the total capacity of a soil to hold exchangeable cations”, CEC [23]. Amorphous SiO2 [anhydride of Si(OH)4] can increase cropland water capacity [24], i.e. by decreasing leaching it could resist decrease of soil cations. On the other side the author has not seen reports that acid rains had decreased or increased cropland Si nor increases in cropland Si after decline in acid rains.
The role of copper (Cu) [2] in HMg seems not to have been discussed in the HMg reviews during the last years. Remarkable is that acid soluble Cu (6.5 mg/l) [25] and groundwater silicon (Si) (4.82 mg/l) [26] have been moderately low in Åland and Si has shown to have synergistic effects with Cu [27], which could partially explain the high HMg in Åland.
Conclusion
HMg associated inversely with cropland Mg/Ca ratio and positively with [Pop.dens] in both periods, trend-like or significantly. During (79-93) with highest SO2 and Pb pollution [Pop.dens] was the strongest factor, after that [(Mg/Ca).88]. This study suggests that Mg availability was not better in Åland than in continental Finland.
Acknowledgement
I am grateful to Professor Osmo Hänninen and late veterinary surgeon Seppo Haaranen for several discussions.
References
- Kemp A (1960) Hypomagnesemia in milking cows: the response of serum magnesium to alterations in herbage composition resulting from potash and nitrogen dressings on pasture. Neth J Agr Sci 8: 281-304.
- Salonen S (1958) Even magnesium is important in grazing season feeding. [in Finnish “Myös magnesium tärkeä laidunkauden kivennäisruokinnassa”]. Karjatalous p. 150.
- Haaranen S (1968) Havaintoja lehmien kouristusoirein esiintyvästä Suomen Eläinlääkärilehti (Finnish Veterinary Journal) pp. 212-223.
- Martens M, Schweigel M (2000) Pathophysiology of grass tetany and other hypomagnesemias. Implications for clinical management. Review. Vet Clin North Am Food Anim Pract 16(2): 339-368.
- Haaranen S. Personal communication.
- Acid rain. Wikipedia.
- Maehira F, Motomura K, Ishimine N, Miyagi I, Eguchi Y, et al. (2011) Soluble silica and coral sand suppress high blood pressure and improve the related aortic gene expressions in spontaneously hypertensive rats. Nutr Res 31(2): 147-156.
- Nkolika IC, Benedict OCO (2010) Elevated Levels of Lead in Blood of Different Groups in the Urban Population of Enugu State, Nigeria. Human and Ecological Risk Assessment 16(5): 1133-1144.
- Toysa T, Hänninen O (2015) Agro-Geology and CHD in Finland. J J Agriculture 1(2): 006.
- Töysä T (2020) Cattle Hypomagnesemia, Puerperal Tetany and Mg/Ca Ratio of Cropland and Groundwater. Biomed J Sci & Tech Res.
- Töysä T (2020) Regional Hypomagnesaemia and Parturient Hypocalcaemia of Milking Cows-Associations with Mg/Ca Ratio of Cropland. Biomed J Sci & Tech Res.
- Backman B (2004) Geological Survey of Finland - Bulletin 401. Groundwater quality, acidification and recovery trends between 1969 and 2002 in South Finland. Geologian Tutkimuskeskus.Geological Survey of Finland.
- (2020) http://www.vmpk.fi/files/futura.pdf.
- Pohjolainen J (2010) Annual consumption of gasoline 1960- 2009). Öljy ja Kaasualan Keskusliitto, Helsinki. 'www.oil-gas.fi'.
- (1996) Statistical Yearbook of Finland. Population density by end-year (1850-1995). Inhabitants per km2 land area p. 51.
- Keskinen R, Ketoja E, Heikkinen J, Salo T, Uusitalo R, et al. (2016) 35-year trends of acidity and soluble nutrients in cultivated soils of Finland. Geoderma Regional 7: 376-387.
- Brown K, Lemon J. CATIONS and CATION EXCHANGE CAPACITY. web: soilquality.org.au.
- Mc Donald LM, Balasko JA (2003) Temporal Trends in Ca, Mg and K Concentrations of Grassland and Garden Soils in West Virginia, U.S.A. between 1986 and 1999. Water, Air, & Soil Pollution 146: 351-363.
- Jeffries P, Gianinazzi S, Perotto S, Turnau K, Barea JM (2003) The contribution of arbuscular mycorrhizal fungi in sustainable maintenance of plant health and soil fertility. Biology and fertility of soils 37 (1): 1-16.
- Larsen EH, Lobinski R, Burger-Meÿer K, Hansen M, Ruzik R, et al. (2006) Uptake and speciation of selenium in garlic cultivated in soil amended with symbiotic fungi (mycorrhiza) and selenate. Anal Bioanal Chem 385(6): 1098-1108.
- Frey B, Rieder SR, Brunner I, Plötze M, Koetzsch S, et al. (2010) Weathering-associated bacteria from the Damma glacier forefield: physiological capabilities and impact on granite dissolution. Appl Environ Microbiol 76(14): 4788-4796.
- Beerling DJ, Leake JR, Long SP, Scholes JD, Ton J, et al. (2018) Farming with crops and rocks to address global climate, food and soil security. Nature plants 4(3): 138-147.
- Kurki Martti (1982) Suomen peltojen viljavuudesta III. Viljavuuspalvelu Oy. Helsinki. Pariset Oy ISBN 951-99399-0-3. p.65.
- Toysa T, Osmo Hanninen (2016) Soil Weathering, Silicon and CHD in Finland. J Agriculture 2(1): 008.
- Emerick RJ, Kayongo-Male H (1990) Interactive effects of dietary silicon, copper, and zinc in the rat. J Nutr Biochem 1(1): 35-40.
