 Research Article
Abstract
Background: With the worldwide spread of the novel corona virus (COVID-19), the global economy has entered a cold winter, and the International Monetary Fund predicts that the global economy will shrink by about 3% in 2020. The outbreak of the epidemic has also caused heavy losses to the Chinese economy. In the first quarter of 2020, actual GDP fell sharply for the first time by 6.8% year-on-year for the first time. This is the first decline since record. Then, according to the data from the business survey in March, China’s economy has improved compared with February, which shows that the economy has rebounded under the influence of policies. Judging from the current situation, although China has passed the peak period of the epidemic, affected by the high cases abroad, it can only be carried out slowly for the resumption of production. Enterprises, as micro-individuals under the macro economy, need to pass through analyzing the dynamic management of the enterprise to deepen the reform of the commercial system and stimulate the vitality of the enterprise. This will also provide data support for the government formulating relevant policies, which is conducive to the synergy of various policies and enhance the momentum of economic recovery. On the other hand, we choose tourism as our specific research object. Thus, we need to set different scenarios according to the development situation of the epidemic, evaluate the impact of the novel coronavirus epidemic on China’s tourism industry, and discuss tourism development and opportunities in the post-epidemic era from the aspects of tourism’s response to the epidemic and the development trend of the tourism after the epidemic [1].
Methods: This dissertation first discusses the issue of enterprise dynamic management in the post covid-19 epidemic era, establishes the Difference-in-Difference model (DID model), and improves the model reasonably. It puts forward the dynamic management plan of different regions and judges the effect of the policy on the implementation of the epidemic. At the same time, it also aims at the impact of the epidemic on the tourism industry at the important time points. The elasticity method and linear regression are used to evaluate and forecast. Using transportation data as a leading indicator, the elasticity of the total number of tourists Et1 and the elasticity of total tourism revenue Ei1 during the Spring Festival and Spring Festival are calculated to be 1.39 and 1.60, respectively. The impact of COVID-19 on the Spring Festival tourism market is evaluated through the Spring Festival elasticity; During the period, the elasticity of the International Workers’ Day tourism market relative to the Spring Festival tourism market Et2, Ei2 is calculated to be 1.14 and 0.9024 respectively through data over the years. Combining the forecast results of the Spring Festival tourism market and the data calibration of different forecast scenarios, the International Workers’ Day is predicted. The total number of tourist trips and total tourism revenue during the period; for the National Holiday, the above ideas are used to calculate the elasticity of the National Holiday tourism market relative to the Spring Festival and International Workers’ Day tourism markets Et3, Ei3, which are 0.69 and 0.94, respectively, predicting the total number of tourists and total tourism revenue during the National Holiday period.
Findings: The results based on DID model analysis show that the significance level of the policy to the GDP of Jiangsu Province is 32%. The saliency level in Hubei province is 37%. In the first quarter of the year 2020, the total travel time and total tourism revenue of the first quarter of the year 2020 are predicted, and the logarithmic linear regression equation is established based on the total tourist arrivals and the total tourism revenue in the year 2020 as the explanatory variables of total tourism trips and total tourism revenue in the first quarter. The total number of tourist trips in the first quarter of the year 2020 is 394 million, a decrease of 74.42% over the same period last year and the total value of tourism revenue is 319 billion 565 million yuan, a decrease of 77.01% over the same period last year. The counter-factual prediction value of the total number of tourists in the first quarter of the year 2020 is 1 billion 676 million, and the counterfactual prediction value of the total tourism revenue is 1 trillion and 580 billion yuan. During the first half of the year 2020, the total number of tourists and the total tourism revenue in the first half of the year are predicted. The total number of tourists in the first quarter and the International Workers’ Day is used as the explanatory variables of the total travel time in the first half of the year. Logarithmic linear regression equations are established respectively and replaced by the estimated values. The predicted value of the total tourist arrivals in the first half of the year 2020 is 1 billion 440 million, which is 53.25% lower than that in the same period last year. The forecast value of total tourism revenue is 1 trillion and 165 billion 98 million yuan, with a decrease of 58.09%. Compared with the same period last year, the potential decline of the total number of tourists in the first half of the year 2020 is 1 billion 911 million, with a decrease of 57.03%, resulting in a potential loss of 1 trillion and 994 billion 902 million yuan and a loss ratio of 63.13% for tourism total revenue. Under the optimistic forecast, the total number of tourist trips in the year 2020 is 4 billion 659 million. A decrease of 23.12% compared with the same period last year, and the total value of tourism revenue is 4 trillion and 807 billion 295 million yuan, 26.27% lower than that of the same period last year. Under the prudent forecast, the total number of tourist trips in the year 2020 is 3 billion 941 million, a decrease of 34.97% over the same period last year, and the total value of tourism revenue is 3 trillion and 922 billion 883 million yuan, a decrease of 39.83%, over the same period of the last year.
Interpretation: China’s economy has been affected by the epidemic to varying degrees in all sectors, especially in the tertiary sector. And because the outbreak situation in China did not look good in the first quarter of 2020, almost all companies made a loss in the first quarter of 2020. To address the economic downturn, the Chinese government has taken various measures, such as issuing coupons to stimulate consumption, discounting promotions, etc. And as the domestic epidemic situation in China continues to improve, more and more companies have resumed normal operations in the last two months. It is believed that soon, China’s economic situation will be significantly better than in the first quarter.
Keywords: Enterprise Dynamic Management; Post Covid-19 Epidemic Period; Tourism Industry; Policy Evaluation; DID Model; Time Series Analysis
Introduction
The COVID-19 has affected all walks of life in the national economy. After over 4 months fighting against the virus, it is basically under the control, therefore, the domestic economy is facing a restart in the post-epidemic era [2,3]. How to accurately promote the recovery of post-epidemic industries and eventually turn crisis into an opportunity has become an important topic that all circles continue to pay attention to. If we want to take the pace of economic recovery further, we need to make enterprise management computable and then implement dynamic management rationally [4]. Only by analyzing the influencing factors of enterprise strategic adjustment and establishing a dynamic management model, thus can obtain a sustainable competitive advantage based on enterprise dynamic strategic management. On the other hand, the tourism industry, which is highly market-oriented and mainly relies on people to gather and consume, is one of the industries with the greatest impact [5]. Thereby, studying the tourism industry can be a good analysis of the economic impact of the outbreak and make recommendations [6].
This article will solve the following questions:
a) Analyze the impact of COVID-19 on enterprise dynamic management in the post-epidemic era and give an overall plan design.
b) Combined with the government’s dynamic management policy for the epidemic situation, the impact of micro-dynamic management on the implementation of dynamic management by the enterprise is evaluated and recommendations are made.
c) In terms of important points of time, what impact the novel coronary pneumonia has had and could have on our tourism industry during holidays such as Spring Festival, International Workers’ Day and National Holiday.
d) According to the impact of tourism in different situations, how should the government formulate or improve policies to intervene.
Methods
Data
Based on model 1, we chose to combine Hubei Energy Group Co., Ltd. (here in after referred to as Hubei Energy)[7] and Jiangsu New Energy Development Co., Ltd. (hereinafter referred to as Jiangsu Xinneng)[8], Jiuzhou Tong Pharmaceutical Group Co., Ltd. (hereinafter referred to as Jiu zhou Tong Pharmaceutical) [9] and Jiangsu Hengrui Medicine Co., Ltd. (hereinafter referred to as Hengrui Medicine)[10] as two groups, both from the secondary industry. In order to ensure the comprehensiveness of the enterprise, we have also selected Hubei Radio and Television Information Network Co., Ltd. (here in after referred to as Hubei Radio & TV)[11] and Jiangsu Radio & Television Cable Information Network Co., Ltd. (hereinafter referred to as Jiangsu Cable)[12] as another group.
For the analysis of various industries, we mainly collect tertiary industries, such as Alibaba Network Technology Co., Ltd. (hereinafter referred to as Alibaba)[13], SF Express Co., Ltd. (hereinafter referred to as SF)[14], and Shenzhen Tencent Computer System Co., Ltd. (hereinafter referred to as Tencent)[15], Suning Tesco Group Co., Ltd. (hereinafter referred to as Suning) [16] quarterly data of these large enterprises, in order to ensure the comprehensiveness of the industry, we also collected quarterly data of Muyuan Food Co., Ltd. (hereinafter referred to as Muyuan shares).
The Model
The method of analyzing the impact of COVID-19 on enterprise dynamic management and evaluating the effect of micro dynamic management implementation dynamic management is generally to establish a DID model [17]. When analyzing the impact of the epidemic on tourism, we mainly use the elasticity method.
DID-based Method
(Table 1) Drawing a line chart according to the known data, we can obtain that the actual GDP comparison between Province A and Jiangsu Province has the same change trend, and the actual GDP comparison between Province B and Hubei Province has the same change trend. The results are shown in Figure 1. Therefore, when analyzing the economic impact of policies on Hubei and Jiangsu provinces, the known data of A and B provinces and their predicted GDP by SPSS for 2019 and 2020 are set as the control group. The actual GDP of Hubei Province and Jiangsu Province and the GDP predicted by SPSS are used as the control group to establish a DID model for this, the basic regression equation is set as shown in formula.
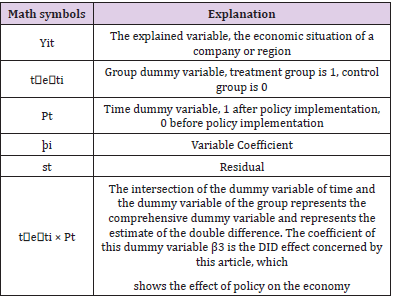
Table 1: Explanation of mathematical symbols in DID model.
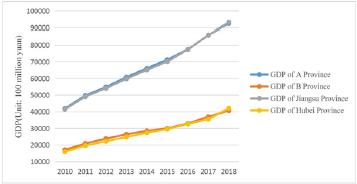
Figure 1: Comparison of GDP of A and B provinces with Jiangsu Province and Hubei Province, respectively.
Yit = þ0 + þ1tݎe݁ti1 + þ2Pt + þ3tݎe݁ti × Pt + st ①
The Elasticity Method for Estimation
Regarding the impact of the epidemic on tourism at an important time, the elasticity method is mainly used for assessment and prediction. The meaning of Et is the ratio between the percentage change in total number of the tourists and the percentage change in independent variables. The meaning of Ei is the ratio between the percentage change in total tourism revenue and the percentage change in independent variables. Through double logarithmic regression, the elasticity values of Et and Ei can be estimated based on historical data, and then the predicted value of total tourism visits can be estimated by Et and the predicted value of total tourism revenue can be estimated by Ei. As far as the Spring Festival is concerned, because the time of the outbreak coincides with the Spring Festival Holiday, in this article, the transportation data is used as the leading indicator to evaluate the impact of COVID-19 on the Spring Festival tourism market through the flexibility of the Spring Festival transportation.
As far as the International Workers’ Day period is concerned, the elasticity of the International Workers’ Day tourism market relative to the Spring Festival tourism market can be calculated from historical data, combined with the forecast results of the Spring Festival tourism market and the data calibration of different forecast scenarios, the total number of tourists and the total tourism revenue during the International Workers’ Day can be predicted.
As far as the National Holiday is concerned, the above ideas are used to predict the total number of tourists and total tourism revenue during the National Holiday period by calculating the elasticity of the National Holiday tourism market relative to the Spring Festival and the International Workers’ Day tourism market. When predicting total number of tourists and total tourism revenue in the first quarter of 2020,we establish a regression equation through the Spring Festival tourism market data; when predicting total number of tourists and total tourism revenue in the first quarter of 2020, we establish a regression equation through the first quarter and the International Workers’ Day tourism market data; when predicting the total number of tourists and total tourism revenue for the whole year of 2020,we establish another regression equation through the first half of the year and the National Holiday tourism market data (Table 2). Based on the following three principles to assess and predict the impact of COVID-19 on China’s tourism dynamic management:
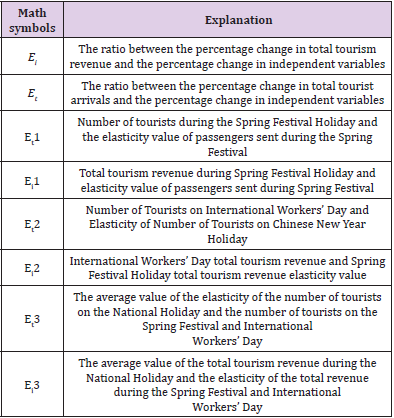
Table 2: Explanation of mathematical symbols in the elasticity method.
a. The principle of “ counterfactual “: calculate the expected value of tourism development under the assumption that there is no epidemic, and then predict the actual situation that the tourism industry may present under different trends of the epidemic situation, the impact of the epidemic situation on the tourism industry is calculated according to the difference between the two;
b. The principle of “limited extrapolation”: when the epidemic situation has not ended and the prevention and control situation is complicated, focus on grasping for shortterm forecast and key point forecast, carry out limited extrapolation.
c. The principle of “camera correction”: make reasonable corrections to the prediction results according to the latest changes in the epidemic situation.
Based on the above epidemic judgment, this article sets three different scenarios for evaluation and prediction. Scenario 1 is optimistic, assuming that the domestic epidemic will basically end at the end of March, and it will be completely ended at the latest in early April; scenario 2 is cautious, assuming that the domestic epidemic will basically end at the end of May, and at the latest, it will completely end in early June (Table 3).
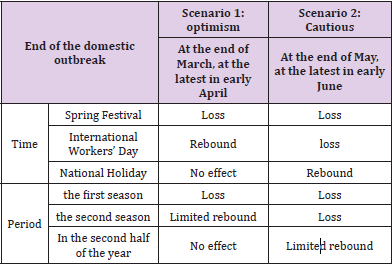
Table 3: Two scenarios assumed in this paper.
Results
DID Model-based Estimates Dynamic Management Model 1
According to the known data, in the Stata software17, the results obtained are shown in Tables 4 & 5. No control variables are added to the order. The difference between the treatment group and the control group before policy implementation is 37.709, and the difference between the treatment group and control group after policy implementation is -1.3e + 03.-1.4e + 03 is the coefficient of double difference estimation. The p-value of this coefficient is 0.941, indicating that it passes the test at a very high significance level [18]. No control variables are added to the order. The difference between the treatment group and the control group before policy implementation is 16.784, and the difference between the treatment group and the control group after policy implementation is -3.3e + 03. -3.5e + 03 is the coefficient of double difference estimation. The p-value of this coefficient is 0.729, which means that it passes the test at a high significance level. As can be seen from Tables 4&5 above, it is precisely because of the effective policies adopted by Jiangsu Province in the fight against the epidemic, its economy is less affected by the epidemic, thus it can be seen that Jiangsu Province has its own strength.
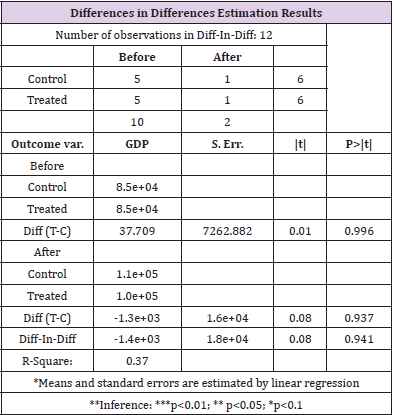
Table 4: The impact of policies on the GDP of Jiangsu Province.
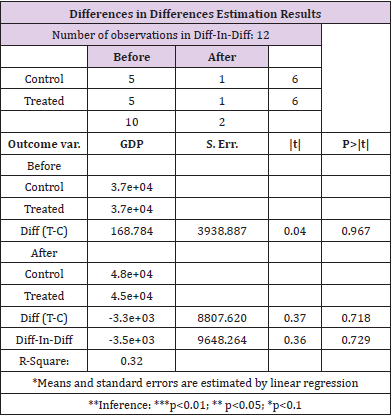
Table 5: The impact of policies on the GDP of Hubei Province.
Dynamic Management Model 2
According to the known relevant data, the observed variables are tested to meet the assumption of parallel trends, and the test process is the same as model one, so it will not be repeated here. After conforming the parallel trend test, the DID model is established, and then the formula ① is used for regression analysis. For the enterprises in Hubei Province and Jiangsu Province, we have selected three types of industries, namely Hubei Energy and Jiangsu Xinneng, Hubei Radio and TV and Jiangsu Cable, Jiuzhou Tong Pharmaceutical and Hengrui Pharmaceutical, of which the first and third groups are secondary industries the second group is the tertiary industry. In the Stata software, the results obtain through the commands are shown in Tables 6-8.
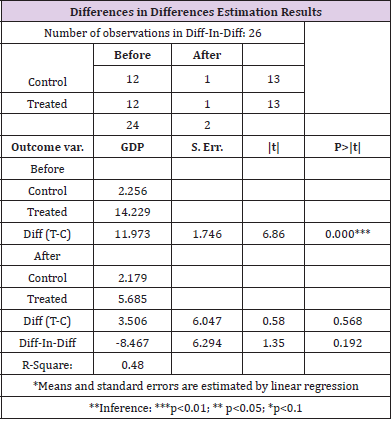
Table 6: The economic impact of policies on Hubei Energy, Jiangsu Xinneng as the control group.
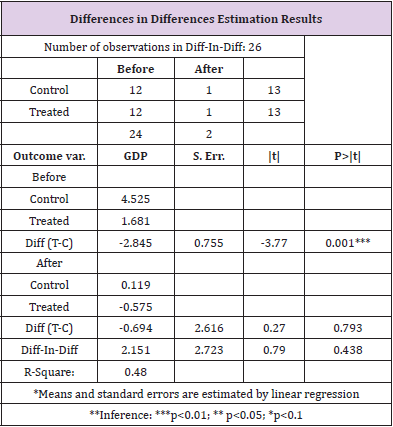
Table 7: The impact of policies on Hubei Radio and Television, Jiangsu Cable as the control group.
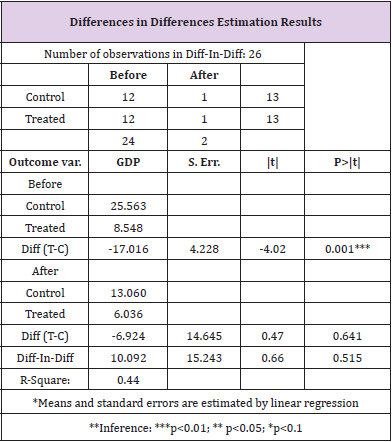
Table 8: The impact of policies on Jiuzhou Tong Pharmaceutical, Hengrui Medicine as the control group.
No control variables are added to the order. The difference between the treatment group and the control group before policy implementation is 11.973 and the difference between the treatment group and the control group after policy implementation is 3.506. -8.467 is the coefficient of double difference estimation. The p-value of this coefficient is 0.192, which means that it passes the test at a very high significance level. The DID model shows the comprehensive effect of the policy, and the empirical results show that the epidemic will affect the economy of the enterprise. No control variables are added to the order. The difference between the treatment group and the control group before policy implementation is -17.016, and the difference between the treatment group and the control group after policy implementation is -2.845. -0.694 is the coefficient of double difference estimation. The p-value of this coefficient is 2.151, indicating that it passes the test at a very high significance level. The DID model shows the comprehensive effect of the policy, and the empirical results show that the epidemic will affect the economy of the enterprise.
No control variables are added to the command. The difference between the treatment group and the control group before the policy implementation is -17.016, and the difference between the treatment group and the control group after the policy implementation is -6.924. 10.092 is the coefficient of double difference estimation. The p-value of this coefficient is 0.515, which means that it passes the test at a high significance level. The DID model shows the comprehensive effect of the policy, and the empirical results show that the epidemic will affect the economy of the enterprise. The data from Model 1 and Model 2 shows that policies and epidemics will affect the economy of the enterprise. So, for the first question, the overall design plan we produced is to determine whether the establishment of the corporate image has an impact on the development of the enterprise.
Dynamic Management Model 3
Like model one and two. First, according to the collected net profit of the enterprise before the first quarter of 2020, time series analysis is performed by SPSS to obtain the fitted value and its predicted value. We will use the fitting value obtained and predicted value by time series analysis as the control group, and the actual net profit of the company as the treatment group, establish a DID model, and perform regression analysis through formula ①. For domestic enterprises affected by the government policy, we selected well-known large enterprises as the research objects, respectively SF, Suning, Alibaba and Tencent. In the Stata software, the results obtain through the commands are shown in Tables 9-13.
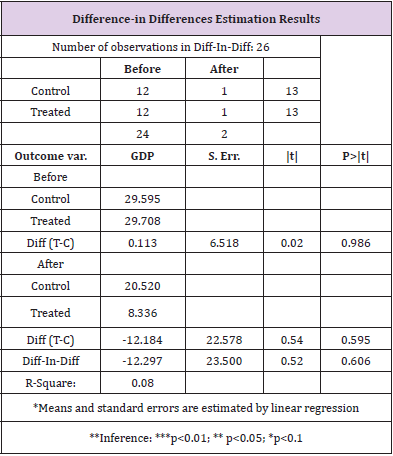
Table 9: The impact of policies on SF Express’s net profit.
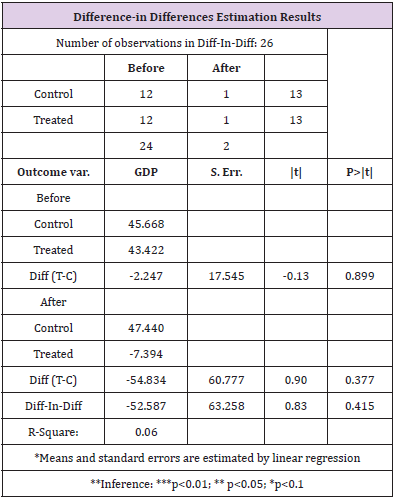
Table 10: The impact of policies on Suning’s net profit.
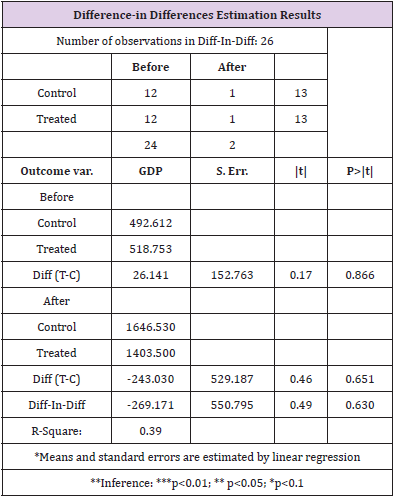
Table 11: Explanation of mathematical symbols in DID model.
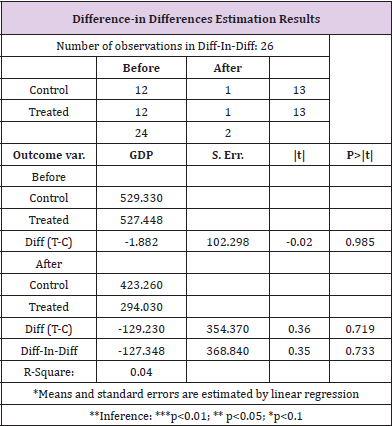
Table 12: The impact of policies on Tencent’s net profit.
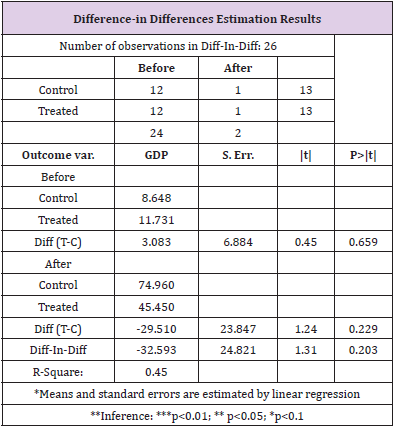
Table 13: The impact of policies on Muyuan’s net profit.
No control variables are added to the command. The difference between the treatment group and the control group before policy implementation is 0.113 and the difference between the treatment group and the control group after policy implementation is -12.184. -12.297 is the coefficient of double difference estimation. The p-value of this coefficient is 0.606, indicating that it passed the test at a very high significance level. The DID model shows the comprehensive effect of the policy. The empirical results show that the policies adopted by SF Express, such as the rapid layout of routes, fully guarantee the smooth flow of import and export cargo transportation, assisting enterprises in resuming production, providing different types of products and services, providing international express delivery services for import and export companies and individuals, providing international parcels and overseas warehouse services for cross-border e-commerce sellers, and providing international air transport and international shipping services for international traders, manufacturing, and multinational companies [19]. These series of measures do ease the impact of the epidemic and effectively promoted the growth of the enterprise economy.
No control variables are added to the order. The difference between the treatment group and the control group before the policy implementation is -2.247 and the difference between the treatment group and the control group after the policy implementation is -54.834. -52.587 is the coefficient of double difference estimation. The p-value of this coefficient is 0.415, which means that it passes the test at a high significance level. The DID model shows the comprehensive effect of the policy. The empirical results show that the policies adopted by Suning, such as Suning Tesco, Carrefour, Suning stores, and retail cloud stores, on the basis of meeting the needs of frontline support, fully ensure the protection of materials, healthy products, the supply and prices of people’s livelihood products are stable; Suning Logistics is responsible for the industry of first-line anti-epidemic materials transportation; sports, health, red children and other systems, give full play to the advantages of commodities and content, and provide users with online fitness, health, and childcare related experiences content; Finance provides greater credit support to a wide range of suppliers and SMEs. These series of measures do ease the impact of the epidemic and effectively promoted the growth of the enterprise economy.
No control variables are added to the order. The difference between the treatment group and the control group before policy implementation is 26.141 and the difference between the treatment group and the control group after policy implementation is -243.030. -269.171 is the coefficient of double difference estimation. The p value of this coefficient is 0.630, which means that it passes the test at a very high significance level. The DID model shows the comprehensive effect of the policy. The empirical results show that the policies adopted by Ali, such as opening free medical services when medical personnel are in short supply, and joint transportation companies to open global green channels when the material transportation channel is blocked; Are hungry merchants reducing commissions in batches, re-employ facing unemployed restaurant workers waiting for their jobs; the urgent need for research and development efficiency, it frees all the research and development of virus vaccines and new medicines for public scientific research by AI computing power [20]. These series of measures do ease the impact of the epidemic and effectively promoted the economic growth of the enterprise, greatly improved the positive image of the enterprise, and showed Ali’s corporate culture to the people of the country. This is the core competition in the dynamic management of the enterprise.
No control variables are added to the order. The difference between the treatment group and the control group before policy implementation is -1.882 and the difference between the treatment group and the control group after policy implementation is -129.230. -127.348 is the coefficient of double difference estimation. The p-value of this coefficient is 0.733, indicating that it passes the test at a very high significance level. The DID model expresses the comprehensive effect of the policy. The empirical results show that the policies adopted by Tencent, such as giving play to the corporate sense of responsibility, donated 1.5 billion to the state, freely open a variety of remote conference office software such as Tencent conferences, corporate WeChat, and actively expanded in the game industry [21]. These series of measures do ease the impact of the epidemic and effectively promoted the growth of the enterprise’s economy, while also increasing the market’s trust in the enterprise, which is also related to the corporate culture in the dynamic management of the enterprise.
No control variables are added to the command. The difference between the treatment group and the control group before the policy implementation is 3.083, the difference between the treatment group and the control group after the policy implementation is -29.510 and -32.593 is the coefficient of double difference estimation. This coefficient the p-value is 0.203, indicating that it passed the test at a very high level of significance. The DID model expresses the comprehensive effect of the policy. The empirical results show that the policies adopted by Muyuan Co., Ltd. such as intelligent pig farming, expanding job demand, contracting high-speed rail and aircraft to ensure return to work rate, help poor counties and poor households [22]. These series of measures really eased the impact of the epidemic and effectively promoted the growth of the enterprise economy. Comprehensive analysis of the second question to analyze the corporate image and corporate culture is a very important aspect of corporate management, because technology may lag behind, management may fail, only corporate culture is the key to supporting the company’s long-term development.
The Impact of The Spring Festival Holiday on the Dynamic Management of Tourism
To carry out the evaluation work, first establish a counterfactual reference system for the 2020 Spring Festival tourism market. On January 9, 2020, the State Council Information Office held a press conference to predict that the number of passengers sent by the country during the Spring Festival 2020 will reach about 3 billion. Since COVID-19 had not yet fully erupted at that time, the data could reflect the expected value of counterfactuals and could be used as an evaluation reference. On February 20, 2020, the Spring Festival data released by the Ministry of Transport showed that the 40-day Spring Festival ended in 2020. National railways, highways, waterways, and civil aviation sent 1.48 billion passengers, down 50.3% from the same period in 2019. If the elasticity of total tourists and total tourism revenue will remain roughly the same in 2020, the estimated impact of COVID-19 on tourism during the Spring Festival is shown in Table 14.
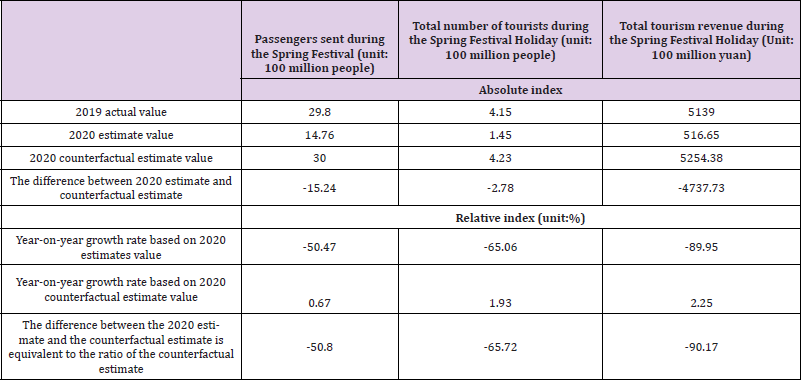
Table 14: The impact of the COVID-19 on tourism in the Spring Festival Holiday in 2020.
The estimated results are shown in Table 14. The estimated total number of tourists during the Spring Festival in 2020 is 145 million, a decrease of 65.06% from the same period in 2019. The counterfactual estimate is 423 million; the estimated value of total tourism revenue during the Spring Festival in 2020 is 51.665 billion yuan, a decrease of 89.95% from the same period in 2019. The counterfactual estimate is 525.438 billion yuan. From the perspective of absolute value, the difference between the estimated total tourists and total tourism revenue and counterfactual estimates during the Spring Festival of 2020 (can be understood as losses) are 278 million and 473.773 billion yuan, respectively. From the perspective of relative value, the difference between the estimated total number of tourists and total tourism revenue and the counterfactual estimate during the Spring Festival in 2020 is equivalent to the ratio of counterfactual estimates (which can be understood as losses) of 65.72% and 90.17%, respectively.
The Impact of International Workers’ Day on the Dynamic Management of Tourism
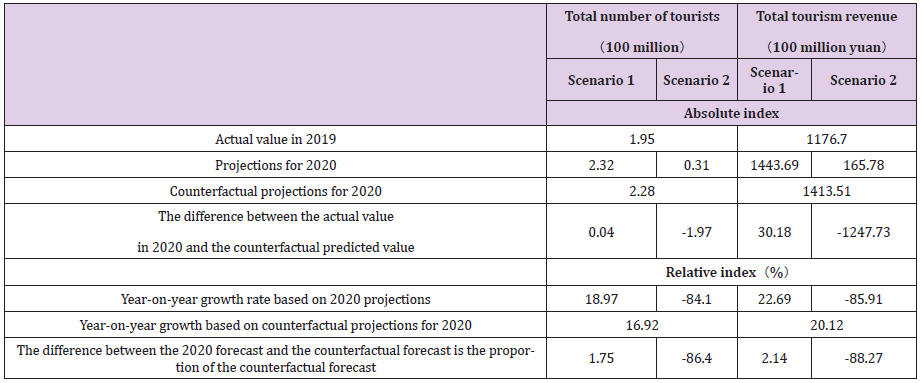
Table 15: The impact of the COVID-19 on tourism in International Workers’ Day in 2020.
The International Workers’ Day in 2020 lasts for 5 days, which is 1 day longer than the previous year and 2 days longer than 2018. Therefore, the prediction results based on counterfactuals show significant growth fundamentals. This article assumes that there is a stably elastic relationship between the Spring Festival tourism market and the International Workers’ Day tourism market. In scenario 1, the counterfactual estimates of the Spring Festival tourism market for 2020 are used for calculation. The prediction results are shown in Table 15. Under Scenario 1, the tourism market after the epidemic experienced a rebound in demand, which is positively superimposed on the growth trend of counterfactual fundamentals. It is predicted that the total number of tourist arrivals during the International Workers’ Day in 2020 will reach 232 million, and the predicted value of total tourism revenue is 144.369 billion yuan, an increase of 18.97% and 22.69% respectively over the same period of the previous year.
In Scenario 3, the International Workers’ Day is still in the epidemic period, and the upward trend of counterfactual fundamentals is far from enough to offset the downward trend of actual demand. The predicted value of total tourist arrivals during the International Workers’ Day in 2020 is 31 million, and the predicted value of total tourism revenue is 16.578 billion yuan, which is a decrease of 84.10% and 85.91% respectively over the same period of the previous year. According to counterfactual standards, the potential decline in the total number of tourists caused by COVID-19 is 197 million, with a potential decline rate of 86.40%, a potential loss of total tourism revenue is 124.773 billion yuan, and a potential loss rate of 88.27%.
The impact of The National Holiday on the Dynamic Management of Tourism
The National Holiday in 2020 lasts for 8 days, which is one day longer than in previous years. Therefore, the forecast based on counterfactuals shows a fundamental increase. Considering the relationship between the end time of the epidemic and the National Holiday, the distinction between Scenario 2 and Scenario 3 has no significant impact on the National Holiday tourism market. We assume that the National Holiday and the Spring Festival and International Workers’ Day tourism markets are subject to a relatively stable elastic relationship. In scenario 1, the estimated value of the Spring Festival tourism market and the estimated value in the scenario 1 of the International Workers’ Day tourism market are used for calculation, and the geometric average of the results is taken. The detailed results are shown in Table 16.
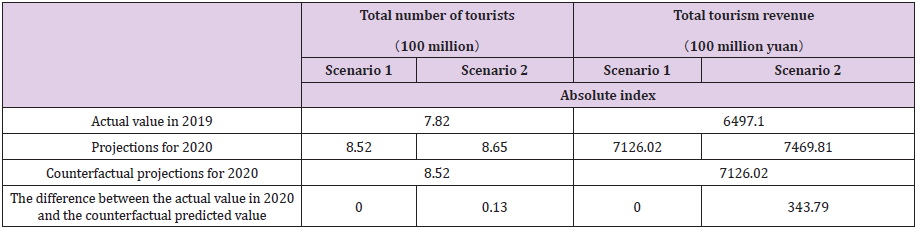
Table 16: The impact of COVID-19 on tourism during the National Holiday in 2020.
In scenario 1, the epidemic subsided during the “National Day” period, but compensatory travel demand had been released earlier, so the predicted result is the same as the counterfactual situation. The predicted value of the total tourist visits in the “National Day” period in 2020 is 852 million, and the estimated value of the total tourism revenue is 712.602 billion yuan, an increase of 8.95% and 9.68% respectively over the same period last year. In scenario 2, the epidemic subsided during the “National Day” period, and the release of com pensatory demand is positively superimposed with the growth trend of counterfactual fundamentals. The forecast value of the total tourist visits in the “National Day” period in 2020 is 865 million, and the forecast value of the total tourism revenue is 746.981 billion yuan, an increase of 10.61% and 14.97% respectively over the same period last year.
By comparing the evaluation results of COVID-19 affecting the tourism industry at important time points such as the Spring Festival, the International Workers’ Day and the National Holiday, it can be seen that the tourism losses caused by the epidemic are mainly concentrated in the Spring Festival and the International Workers’ Day tourism market. The epidemic caused a potential decline in total tourism arrivals during the Spring Festival of 278 million, with a decrease rate of 65.72%, and a potential loss of total tourism revenue of 473.773 billion yuan, with a loss rate of 90.17%. Under a cautiously optimistic forecasting scenario, the epidemic caused a potential decline in total tourism arrivals period of 609 million during the International Workers’ Day, a decrease rate of 30.26%, and a potential loss of total tourism revenue of 45.874 billion yuan, with a loss rate of 32.45%. It is worth noting that, in addition to affecting the scale of losses at different time points in the tourism industry, different forecast scenarios will also cause different rebounds in the tourism market. In general, under different forecasting scenarios, the market rebound in total number of tourists and total tourism revenue is expected to be between 1% and 3%.
The Impact of The Novel Coronary Pneumonia on Tourism in Q1 2020
In any forecasted scenario, the first quarter is the main period of the tourism industry affected by the epidemic. When predicting the total number of tourist trips and total tourism revenue in the first quarter of 2020, this article uses the total number of tourist trips and total tourist revenue during the Spring Festival Holiday as the explanatory variables of the total tourist trips and total tourist revenue in the first quarter to establish a logarithmic linear regression equation and substitute the aforementioned estimated value into the 2020 Spring Festival tourism market for calculation. The specific prediction results are shown in Table 17.
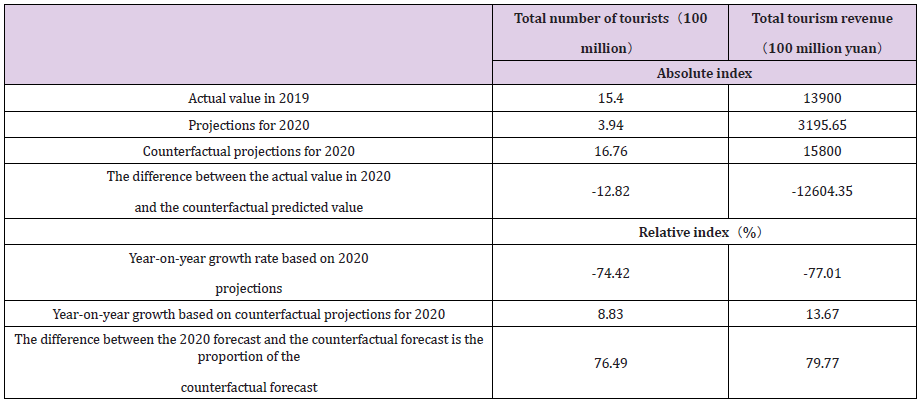
Table 17: The impact of COVID-19 on tourism in the first quarter of 2020.
As shown in Table 17, the predicted value of total tourism in the first quarter of 2020 is 394 million, a decrease of 74.42% over the same period of last year; the predicted value of total tourism revenue is 319.565 billion yuan, a decrease of 77.01% over the same period of the previous year. In the first quarter of 2020, the counterfactual predicted value of total tourism visits is 1.676 billion, and the counterfactual predicted value of total tourism revenue is 1.580 trillion yuan. According to counterfactual standards, COVID-19 caused a potential decline in total tourist arrivals of 1.282 billion in the first quarter, with a potential decrease rate of 76.49%, and a potential loss of total tourism revenue of 1,240.435 billion yuan, with a potential loss rate of 79.77%.
The Impact of The Novel Coronary Pneumonia on Tourism in the First Half of 2020
Under different forecasting scenarios, the duration of COVID-19 has caused its impact on tourism in the first half of 2020 to be different. When predicting the total number of tourist trips and total tourism revenue in the first half of 2020, this article uses the total tourist trips in the first quarter and the International Workers’ Day as the explanatory variables for the total tourist trips in the first half of the year, and the first quarter and the International Workers’ Day as the explanatory variable of the total tourism revenue in the first half of the year, then establishes logarithmic linear regression equations respectively and substituted into the aforementioned estimates for calculation. Among them, Scenario 1 and Scenario 2 are substituted into the Spring Festival tourism market estimate and the International Workers’ Day tourism market estimate in the corresponding scenario for calculation. The prediction results are shown in Table 18. As shown in Table 18, the counterfactual predicted value of total tourism in the first half of 2020 is 3.351 billion, and the counterfactual predicted value of total tourism revenue is 3160 billion yuan.
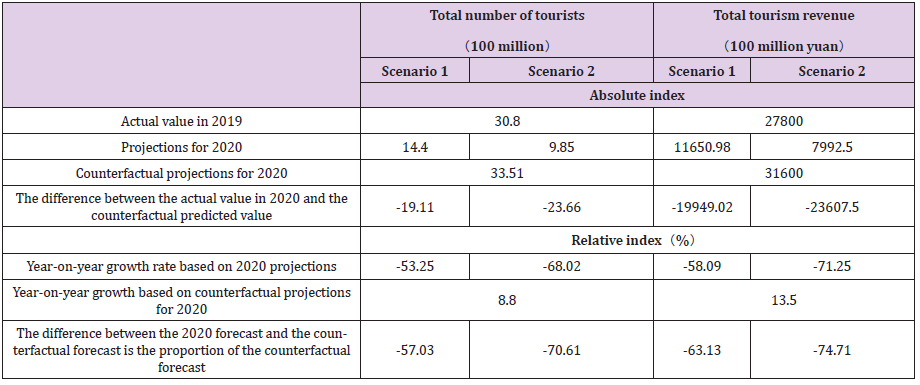
Table 18: The impact of COVID-19 on tourism in the first half of 2020.
Under the optimistic prediction of Scenario 1, the predicted value of total tourist arrivals in the first half of 2020 is 1.44 billion, a decrease of 53.25% over the same period last year; the predicted value of total tourism revenue is 1.165098 trillion yuan, a decrease of 58.09% over the same period last year. The epidemic caused a potential decline in total tourism arrivals of 1.911 billion in the first half of 2020, with a decrease rate of 57.03%, and a potential loss of total tourism revenue of 1994.902 billion yuan, with a loss rate of 63.13%. Under the cautious forecast of Scenario 2, the predicted value of total tourism in the first half of 2020 is 985 million, a decrease of 68.02% over the same period of last year; the predicted value of total tourism revenue is 799.250 billion, a decrease of 71.25% from the same period of last year. The epidemic caused a potential decline in total tourism arrivals of 2.366 billion in the first half of 2020, with a decrease rate of 70.61%, and a potential loss of total tourism revenue of 2,360.750 billion yuan, with a loss rate of 74.71%.
The Impact of The Novel Coronary Pneumonia on Tourism in the Entire Year 2020
In order to avoid the multi-collinearity problem caused by the correlation of independent variables, when predicting the total number of tourism and total tourism revenue for the whole year of 2020, the total number of tourism for the first half of this year and the national Holiday will be used as the explanatory variable of the total number of tourism for the whole year, the total tourism revenue for the first half of the year and the National Holiday are used as explanatory variables of the total tourism revenue for the whole year, then we establish logarithmic linear regression equations, and substitute the leading indicators under different forecasting scenarios for data calculation. The prediction results are shown in Table 19.
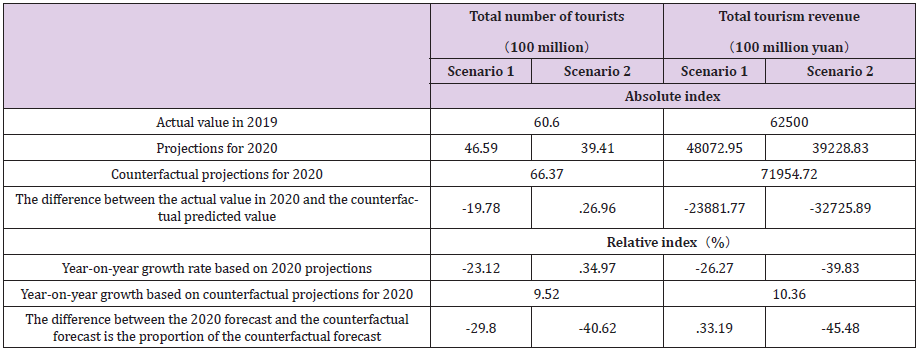
Table 19: The impact of COVID-19 on tourism in the whole year of 2020.
As shown in Table 19, the anti-factual forecast value of total tourism in 2020 is 6.637 billion, and the anti-factual forecast value of total tourism revenue is 7.195472 trillion yuan. Under the optimistic forecast of Scenario 1, the predicted value of total tourism in 2020 is 4.659 billion, a decrease of 23.12% over the same period of last year; the predicted value of total tourism revenue is 480.7295 billion yuan, a decrease of 26.27% over the same period of last year. The epidemic caused a potential decline in total tourism arrivals of 1.978 billion people in 2020, a decrease rate of 29.80%, and a potential loss of total tourism revenue of 2.388177 trillion yuan, with a loss rate of 33.19%.
Under the cautious prediction of Scenario 2, the predicted value of total tourist arrivals in 2020 is 3.941 billion, a decrease of 34.97% over the same period of the previous year; the predicted value of total tourist revenue is 392.2883 billion yuan, a decrease of 39.83% over the same period of the previous year. The epidemic caused a potential decrease in total tourism arrivals of 2.696 billion in 2020, a decrease rate of 40.62%, and a potential loss of total tourism revenue of 32725.89 billion yuan, with a loss rate of 45.48%. When predicting the impact of COVID-19 on the first quarter, semi-annual and annual tourism in 2020 based on different scenarios, different explanatory variables and leading indicator data are selected, so the prediction results are mainly used to observe the overall impact of tourism on the epidemic trends, not accurate numerical comparisons or time summation.
Discussion
It can be seen from the empirical results that the policy has a significant effect on the development of the enterprise, and different enterprises have adopted different coping strategies according to their actual conditions. Taking SF Express in the tertiary industry as an example, the policies adopted by enterprises such as rapid layout of routes, fully guarantee the smooth flow of import and export cargo transportation, and assisting enterprises to resume production; providing different ways to meet the diverse needs of the market and different type of product service; providing international express delivery services for import and export companies and individuals, providing international parcels and overseas warehouse services for cross-border e-commerce sellers, and providing international air transport and international shipping services for international traders, manufacturing, and multinational companies. This series of measures has greatly increased SF’s business volume and revenue, and its market share has further increased. However, the three express delivery companies such as Yunda, Yuantong and Shentong have declined in varying degrees in terms of receivables and business volume.
Taking Alibaba in the tertiary industry as an example, after experiencing the outbreak of SARS, it has further expanded after COVID-19 to increase people’s trust in Ali, because they have taken appropriate policies to achieve crisis and turnaround. According to data from the Ministry of Culture and Tourism: From 1 to 5 May 2020, the country received a total of 115 million domestic tourists and realized domestic tourism revenue of 47.56 billion yuan. In the optimistic and cautious forecast of this model, the total number of domestic tourists received during the International Workers’ Day is 197 million and 39 million, respectively, and the domestic tourism revenue is 118.8 billion and 67.78 billion, respectively. In the optimistic forecast, it is assumed that the domestic epidemic will end in early April at the latest, the May 1st tourism situation will rebound compared to previous years, and the cautious forecast assumes that the domestic epidemic situation will end as early as late May. COVID-19 situation will cause losses to the May 1st tourism industry.
The predicted values in this model and the relationship between the ministry of culture and tourism data are consistent with the assumptions, and the model prediction is relatively consistent. However, due to the price increase, the value of RMB is not the same as in previous years, so it will cause International Workers’ Day tourism revenue to be higher than the true value when prudently forecasting. In recent years, DID model is widely used in economics for the measurement of the project or public policy implementation effect evaluation, such as talking about the coal of China railway special line opened to regional economic growth [23], the influence of “One Belt and One Road” affect China’s export growth and along the country binary marginal and a series of policy effect [24], with the dynamic management model DID. In addition, intervention evaluation and event impact can be included in medical and healthrelated fields and DID dynamic management model can also be used for analysis [25].
Limitations
Because the budget process of the dynamic management model based on the elastic value model is complex, there are many data, and the calculation process is huge, it cannot be considered comprehensively, resulting in some inconsistencies with the actual situation. so, the prediction of the tourism situation is referred to the compensatory demand after the SARS epidemic has set an additional growth interval, and the applicability of this novel coronary pneumonia needs to be further improved to be verified. When predicting the impact of COVID-19 on the first quarter, semiannual and annual tourism in 2020 based on different scenarios, different explanatory variables and leading indicator data are selected, so the prediction results are mainly used to observe the overall impact of tourism on the epidemic the general trend needs further improvement to make it suitable for accurate numerical comparison or time summation.
The double differential model reflects the immediate effect of policy shocks, but sometimes the policy shocks have a lagging effect. We usually lag one period to estimate the average effect of policy shocks, but since the data we have collected is only in the first quarter, this idea is limited by the data and cannot be realized. We need to further collect data for the following quarters. Since it is necessary to ensure that the time trends of the treatment group and the control group are consistent before the policy is implemented, this hypothesis can only be tested with sufficiently long time series data. It must be ensured that the control group and the treatment group have at least two periods before the policy occurs at the same time, when the enterprises in Hubei Province are set as the processing group and the enterprises in Jiangsu Province are set as the control group, because it is impossible to guarantee that the two have the same parallel trend, a triple difference model can be used to eliminate the impact of the time trend.
Conflict of Interest
We have no conflict of interests to disclose and the manuscript has been read and approved by all named authors.
Acknowledgement
This work was supported by the Philosophical and Social Sciences Research Project of Hubei Education Department (19Y049) and the Staring Research Foundation for the Ph.D. of Hubei University of Technology (BSQD2019054), Hubei Province, China.
References
- Liping Huang,Xuegang Hou (2003) The worldwide nature of SARS and the sustainable development of Chinese tourism commodities. World Geography Research 12(4): 96-100.
- http://data.stats.gov.cn/
- https://zhuanlan.zhihu.com/p/140875357?utm_source=qq&utm_medium=social&utm_oi=10014034
- https://baike.baidu.com/item/Dynamic management/123968?fr=aladdin
- Guangrui Zhang,Xiaoan Wei,Deqian Liu (2005) China's Tourism Development: Analysis and Forecast [M]. Social Sciences Literature Press.
- http://f10.eastmoney.com/f10_v2/FinanceAnalysis.aspx?code=SZ000883
- http://f10.eastmoney.com/f10_v2/FinanceAnalysis.aspx?code=SH603693#lrb-0
- http://f10.eastmoney.com/f10_v2/FinanceAnalysis.aspx?code=SH600998#lrb-0
- http://f10.eastmoney.com/f10_v2/FinanceAnalysis.aspx?code=SH600276#lrb-0
- http://f10.eastmoney.com/f10_v2/FinanceAnalysis.aspx?code=SZ000665#lrb-0
- http://f10.eastmoney.com/f10_v2/FinanceAnalysis.aspx?code=SH600959#lrb-0
- http://emweb.securities.eastmoney.com/PC_HKF10/NewFinancialAnalysis/index?type=web&code
- http://f10.eastmoney.com/f10_v2/FinanceAnalysis.aspx?code=SZ002352#lrb-0
- http://emweb.securities.eastmoney.com/PC_HKF10/FinancialAnalysis/index?type=web&code=09
- http://f10.eastmoney.com/f10_v2/FinanceAnalysis.aspx?code=SZ002024
- https://baike.baidu.com/item/stata/7400048?fr=aladdin
- https://xw.qq.com/cmsid/20200323A0GF9200
- Chen Chuanbo (2015) Stata Statistical Analysis Course [J]. Renmin University of China Press.
- https://www.sf-express.com/cn/sc/news/detail/59/
- https://www.alibabagroup.com/tc/news/action_covid19
- https://www.tencent.com/
- http://www.muyuanfoods.com/
- Songlin Xiang (2020) The Binary Margin of "One Belt, One Road" Affecting the Export Growth of China and Countries Along the Belt and Road-Analysis Based on Double Difference Model [J]. Finance and Economics Research (04): 110-120.
- Wanjing Cheng,Dongxu Mo,Yajun Tian (2020) The impact of the opening of China ’s railway dedicated coal transportation line on regional economic growth-An empirical study based on double difference model. China Coal 46 (04): 12-19.
- Ming W, Huang J, Zhang CJP (2020) Breaking down of healthcare system: Mathematical modelling for controlling the novel coronavirus (COVID-19) outbreak in Wuhan, China[J]. BioRxiv, 12(1): 627-630.
