 Research Article
Abstract
Arterial blood pressure (BP) is one of the most important vital signs of the cardiovascular system. There are currently invasive and non-invasive methods for measuring and/or estimating arterial blood pressure. In this study, artificial neural networks and support vector machines (SVM) are used to estimate systolic and diastolic pressures from electrocardiograms (ECG) and photoplethysmograms (PPG) via regression. The MIMIC II database with ECG, PPG and continuous arterial BP-data was used. Three models were tested for each automatic learning algorithm, for both systolic and diastolic BP, which were assessed according to the Association for the Advancement of Medical Instrumentation (AAMI) standard. The best artificial neural network (ANN) scores of mean absolute error with standard deviation were 5.765 ± 6.3891 [mmHg] and 3.0421 ± 3.4764 [mmHg] for systolic and diastolic BP, respectively. With SVM, they were 5.0893 ± 6.4563 [mmHg] and 2.6861 ± 3.6004 [mmHg] for systolic and diastolic BP, respectively.
Keywords: Machine learning; Arterial blood pressure; Artificial neural networks; Aupport vector machine; Regression; Electrocardiogram; Photoplethysmogram
Abbreviations: BP:Arterial Blood Pressure; SVM: Support Vector Machines; ECG: Electrocardiograms; PPG: Photoplethysmograms; AAMI: Advancement of Medical Instrumentation; ANN: Artificial AeuralNetwork; SBP: Systolic blood pressure; DBP: diastolic blood pressure; PTT:Pulse Transit Time; BMI: Body Mass Index; WC: Waist Circumference
Introduction
Arterial blood pressure (BP) is one of the most important vital signs of the cardiovascular system and it is often used as a measure of health in general. It is commonly recommended to measure the BP on a regular basis in order to maintain a global view of the health of a subject, which is especially relevant in the elderly and those subjects who are at great risk of developing any heart disease [1]. In recent years, the BP measurement have gained more attention because it is a useful indicator of cardiovascular diseases such as hypertension, myocardial infarction and asthma [2]. BP has oscillations or pulses that reflect the pulsating activity of the heart: cyclically impelling blood during systole (heart contraction) and resting during diastole (heart relaxation) [3]. Systolic blood pressure (SBP) is the highest pressure measured during a cardiac cycle, whereas the diastolic blood pressure (DBP) corresponds to the lowest pressure during a cardiac cycle [3]. The conventional methods for measuring blood pressure can be classified into invasive and non-invasive methods [2,4-7]. On one hand, the invasive measurement of blood pressure is the gold standard that provides an exact measurement of blood pressure from heartbeat to heartbeat [7]. Despite providing a continuous and exact measurement, this method is usually restricted to a hospital environment because medical supervision is required [4, 5].
On the other hand, non-invasive methods for measuring blood pressure include non-continuous and continuous methods [2,5,8-12]. The most widely used non-continuous methods are the auscultation and oscillometric methods [2,5-7,13]. The auscultation method is based on hearing the Korotkoff sounds through a stethoscope under a cuff that is wrapped around the biceps of the patient [14-16]. Although this method is the most commonly used, it has been reported to be imprecise and user-dependent [8,14-18]. The oscillometric method is based on the detection of pressure pulses inside a cuff wrapped around the biceps or the wrist of the person [5-7]. Continuous methods to measure APB include the following: the pulse wave velocity method, the tonometry method, plethysmography and the pulse transit time-based method, to name a few [2,8]. The pulse wave velocity method measures the pulse wave’s propagation velocity along the arterial tree. This method requires both knowing the exact distance between the sites in which the signals are captured and the presence of an expert operator to manually locate the carotid and femoral arteries. For this reason, pulse wave velocity methods are operator-dependent and prone to errors [8]. In the tonometry method, an orthogonal force is applied to the wall of a superficial artery against a bone.
A force sensor measures the pressure at the contact so that a local occlusion occurs in the superficial artery [8]. This method is extremely sensitive to movement, so it is not often utilized to measure BP [19,20]. Plethysmography is partially occlusive as it uses a small cuff around the index finger that maintains a constant blood flow at each heartbeat. BP is not directly measured, instead one measures the change of blood volume in the arteries. This method has difficulties in patients with low peripheral perfusion, hypothermia or low blood flow states [8,19]. It is widely accepted that the pulse transit time (PTT) is an index of arterial stiffness and, as such, it is often used to indirectly estimate blood pressure [21]. In recent years, some alternatives to estimating blood pressure based on physiological parameters have been studied. These alternatives are mainly based on biomedical signal processing, which has become an essential technology in modern medicine for clinical and biomedical research [2,4,22]. Algorithms that estimate BP using physiological parameters, such as electrocardiograms (ECG), photoplethysmograms (PPG), PTT and heart rate, among others, have been recently proposed [23-29]. However, most of these approaches utilizes several physiological signals and parameters to perform the estimation of the BP, whereas in this work we are interested in using the minimum physiological signals to perform a reliable BP estimation.
According to the Association for the Advancement of Medical Instrumentation (AAMI), the estimation of systolic and diastolic blood pressure must have a mean absolute error less than 5 [mmHg] and a mean absolute deviation less than 8 [mmHg]. Most researchers use this standard to verify their results [2] and it is the reference value we use in this work as well. Let us describe the most relevant methods for estimating the systolic and diastolic blood pressure using physiological signals.Photoplethysmography (PPG) is the volumetric measurement of an organ using a pulse oximeter. PPG technology simply consists in a light source from a side of a specific tissue and a light detector at the opposite side [19, 30, 31]. Several works have extracted features from PPG signals, creating models to estimate blood pressure [24,32-35]. In general, they obtain better results in a diastolic blood pressure (DBP) estimation than in a systolic blood pressure (SBP) estimation.Currently, the pulse transit time (PTT) is used as an indirect blood pressure estimation method [2,4,24,36,37]. Different studies have assessed the relationship between PTT and arterial BP [8], whereas other studies have generated models to estimate the blood pressure [21,23,24,36,37]. On average, their results were considered tolerable according to the AAMI standard.
However, calibration is often needed and other physiological parameters such as the subject weight and height must be measured, requiring extended processing time for each patient. With an ECG signal, it is possible to calculate the instantaneous heart rate; therefore, it is possible to use this parameter to estimate blood pressure. Nonetheless, using only the heart rate, the results are not conclusive. It is, however, a good complement to other parameters such as PTT. Studies have used machine learning tools such as artificial neural networks (ANN) and classification trees to estimate blood pressure [18,26,28,38-46]. These studies use variables such as body mass index (BMI), waist circumference (WC), age, level of sedentary lifestyle, smoking status and gender, among others to outcome a possible BP estimation.In this work, we aim to continuously estimate the SBP and DBP using a very few available physiological signals (namely ECG and PPG signals only) and machine-learning algorithms. We are interested in using these two signals because they are regularly measured in a non-invasive way on hospitalized patients and estimating the blood pressure in a continuous way without invading the patients is highly desirable in hospitals. To the best of knowledge, there is no machine-learning approaches for continuously estimate the blood pressure that solely relies on these two signals. Here we evaluate the performance of known models and propose new features that can be extracted from the ECG and PPG signals for estimating the blood pressure with accuracy.
Materials and Methods
The database (DB) used in this work is the MIMIC II Waveform Database downloaded from Physionet[47]. This DB contains several waveforms from multiple physiological signals collected from bedside patient monitors in adult and neonatal intensive care units [48]. Some waveforms included are ECGs, continuous arterial BP, fingertip PPG signals, respiration, amongst other signals. The DB is completely described and characterized in [48]. For the purpose of this study, we only selected those records that contained the continuous arterial BP signal, the ECG and the PPG signals. Here, we utilized only the best 239 records, selected based on their quality. For example, if a record had a segment that one of the signals was zero for any period of time, it was discarded from the set.
Database signal processing: Once the records were selected, we performed signal processing over the waveforms to reduce their noise and improve the signal quality before addressing the main issue of this work, which is using the ECG and PPG signals to estimate DBP and SBP in a continuous manner. Here we explain all the details of the signal processing.
Baseline Drift Removal: ECG and PPG signals usually have a superimposed breathing component that moves the baseline. To correct these deviations, we utilize a moving average filter. This filter was tested under different scenarios and a mobile window of 75 samples gave us the best experimental results. In Figure 1 we show the result of applying this filter over an ECG signal; the DB ECG signal Figure 1 (top) contain baseline oscillations that are clearly reduced in the filtered ECG signal, Figure 1 (bottom). Figure 1: Baseline drift removal approach. The DB signals have a small baseline oscillation (top) which can be easily removed with a moving average filter (bottom).
Motion Noise Reduction: Motion noise is produced either by the movement of the electrodes that capture the signals or by the movement of the patient. All three signals (ECG, PPG and BP) can be affected by this noise but not necessarily in a simultaneous way.We implemented a motion-noise detection algorithm that first calculated the amplitude range (the maximum amplitude value minus the minimum amplitude value) every 1,500 samples of each signal. Second, the amplitude range (AR) was used to set a lower and upper limit for which the signals were allowed to vary their range. These limits are set by weighting the ARs by experimentally determined factors. Let us denote by ARECG, ARPPG and ARBP the amplitude ranges of the ECG, PPG and arterial BP signals, respectively. We set 0.83ARECG and 1.17ARECG as the lower and the upper limit for the ECG signal, 0.89ARPPG and 1.11ARPPG as the limits for the PPG signals, and 0.7ARBP and 1.3ARBP as the limits for the BP signals. Third, we scanned each signal using a moving window of 125 samples to evaluate if the AR of the signal within the window exceeded the allowed range. If one signal exceeded the range the corresponding window in all three signals were marked as invalid and no feature extraction was performed for such sections. (We explain the feature extraction processes latter). We show the result of applying our detection algorithm over the three signals in Figure 2, where the noisy segments of the signals are clearly marked by our algorithm.
Heartbeat Phase Shift Compensation: Before feature extraction and systolic and diastolic pressure calculation, each heartbeat per window must be correctly identified. The identification problem is due to the phase shift existing from the PPG signal with respect to ECG signal, and the APB signal with respect to PPG signal. This phase shift is shown in Figure 3, where the shaded area marks one corresponding heartbeat.A maximum of 700 heartbeats per patient were processed and the minimum depended on the signal noise level. Out of the 239 patients, a total of 68,262 heartbeats were processed.Once the phase shift was corrected over the signals, the SBP and DBP were computed and the total of records was splitted into training and testing sets as detailed latter. Next, we describe the features we used in this work to estimate the SBP and DBP from ECG and PPG signals.
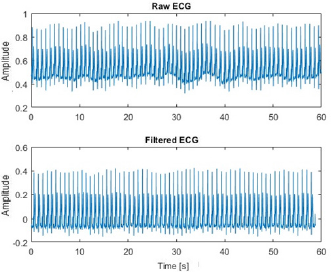
Figure 1: Baseline drift removal approach. The DB signals have a small baseline oscillation (top) which can be easily removed with a moving average filter (bottom).]
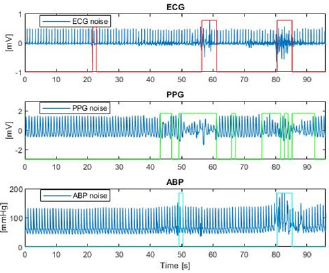
Figure 2: Motion-noise detection algorithm. The marked areas are the noisy sections detected by the algorithm in ECG (top), PPG (middle) and BP (bottom) signals.
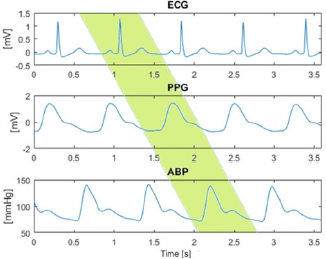
Figure 3: Phase shift between the ECG, PPG and APB signals. The phase difference between the signals must be identified and corrected in order to extract features from the same corresponding heartbeat.
Features extracted from the ECG and PPG signals for BP estimation
A total number of nine features where extracted at each heartbeat from the ECG and PPG signals. The features are the following:
I. R-wave amplitude of the QRS complex: The ECG peaks (local maximums) are identified. The separation between peaks must be at least 60 samples and its amplitude at least half of the signal maximum in that segment.
II. Maximum amplitude of the PPG wave: The PPG peaks are identified, with a separation between peaks of 60 samples.
III. Pulse transit time (PTT) between peaks: Time (in seconds) between the peak of the QRS signal and the peak of the PPG signal.
IV. Pulse transit time (PTT) between the base PPG base and R peak: This feature corresponds to the time (in seconds) between the R peak and the lowest value existing before the PPG peak.
V. Pulse transit time between the PPG middle and R peak: Time (in seconds) between the peak of the QRS complex and the PPG medium value.
VI. Base-peak PPG time: Time (in seconds) between the PPG base and PPG peak of the same heartbeat. This is defined as the systolic upstroke.
VII. Peak-base PPG time: Time (in seconds) between the PPG peak and the PPG base of the next heartbeat. This is defined as the diastolic time.
VIII. Instantaneous heart rate: With the detection of peaks, the time difference between successive R-waves can be obtained. With this, the instantaneous heart rate (iHR) in each heartbeat can be computed by dividing 60 over the time difference between R-wave peaks.
IX. QRS complex duration: For each ECG peak (R wave), the Q and R waves are identified. With this, the difference between them is calculated, obtaining the duration of the QRS complex.
The first eight features where used by other authors in the literature and the ninth was added by us because it is a relevant parameter for ECG signals. At this stage the input matrix for the repressor is a 68,262 (heartbeats) x 9 (features) matrix.
Calculation of blood pressure values
The pressure calculation is performed for each heartbeat and it is used as the ground-truth for the regression algorithms. To obtain the systolic pressure, a local maximum of the BP is determined. To find the diastolic pressure, the minimum value between BP peaks is determined. This process is repeated for each of 68,262 heartbeats, having the input matrix mentioned above and its corresponding expected outcomes.
Machine-learning algorithms
Two machine learning algorithms were implemented to estimate the BP. The first algorithm used artificial neural networks to predict the outcome and the second algorithm uses SVM. To train and test the models, data was divided into training and test sets that vary according to the algorithm as we detail below.
Artificial Neural Network Algorithm (ANN): The neural networks used were fully connected artificial networks created in Matlab. The percentages of data used for training, validation and test sets were selected to be 70% for training, 15% for validation and 15% for testing. (We randomly selected the heartbeats for each set.) Different numbers of neurons were tested for each estimator (systolic and diastolic pressure). The activation function used for neurons in the hidden layer was the hyperbolic tangent. It was experimentally determined that the Bayesian regularization algorithm was better for both estimators. After training, the mean absolute error, mean absolute deviation, mean squared error and the correlation between predicted and actual output were calculated.
Support Vector Machine (SVM): With Matlab we implemented the linear epsilon-insensitive SVM. We performed a 5-fold validation to test each regression (one for systolic and one for diastolic pressure estimation). Three kernel functions in each model were tested: Gaussian functions, linear functions and radial basis functions (RBFs) in order to assess the performance of the regression since there is no previous knowledge of the distribution of the data. Each time the regression were trained with a different kernel, their performance was evaluated with the corresponding test set for each fold. Then, the predicted outputs of all 5 folds were saved to calculate the mean absolute error, mean absolute deviation, mean squared error and correlation. Finally, 3 models for systolic pressure and 3 for diastolic pressure were tested, varying the kernel function used.
Results
Results for systolic and diastolic blood pressure estimation using regression models are presented as follows. The implementation of the aforementioned algorithms was performed in Matlab version R2016a.
Artificial neural networks
For the SBP estimation using ANN, three models were trained with the Bayesian regularization algorithm, changing the number of neurons on the hidden layers between 100, 150 and 200 neurons. The performance metrics, namely the mean-squared error (MSE), mean-absolute error and deviation and the Pearson correlation coefficient are shown in Table 1. The model with 150 neurons achieves the best result in estimating well both the SBP and the DBP.The correlation matrix for the model with 150 neurons are shown in Figure 4afor the SBP estimator and in Figure 4b for the DBP estimator (here, “A” represents the predicted values whereas “B” represents the actual values of each BP), where the corresponding histograms of the predicted BP are also shown. To estimate the SBP and DBP using the SVM, three models were trained with this learning algorithm. To ensure that the regression results were independent of the data partition used for training the model and the data partition used for evaluation, a cross-validation with 5-folds was used in all models. The first model was trained with a Gaussian Kernel function, the second with a linear Kernel and the third model was trained with an RBF. The results, including mean squared error, mean absolute error, mean absolute deviation and the Pearson correlation coefficient are shown in Table 2. The model with the best results is the Gaussian Kernel function for both the SBP and DBP estimation problem.In Figure 5 we show the correlation matrix of the best model for the SVM (i.e., SVM with Gaussian Kernel). Figures 5a& 5bshow the correlation matrix for the SBP an DBP estimators, respectively. Again, the predicted values are presented as “A” and the actual values as “B”. In addition, the histograms of the estimated BP are also shown.
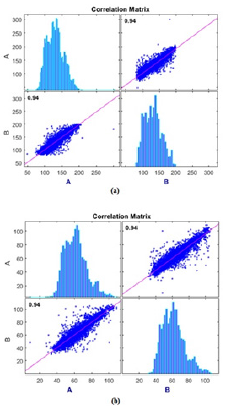
Figure 4: Correlation matrix for the best ANN models:
a. For systolic blood pressure and
b. For diastolic blood pressure.
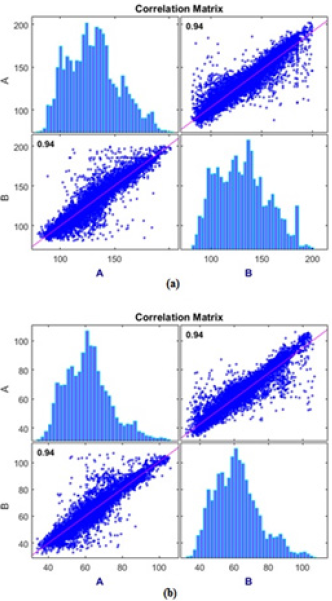
Figure 5: Correlation matrix for the best SVM models.
a. For systolic blood pressure and
b. For diastolic blood pressure.
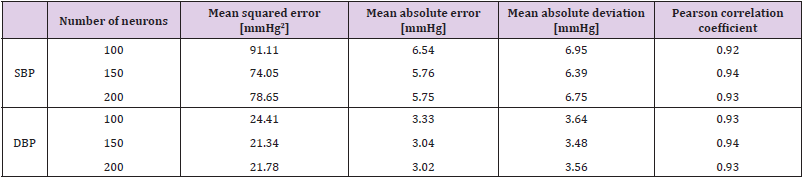
Table 1: Performance indicators of ANN models for the estimation of systolic and diastolic blood pressure by varying the number of neurons within the hidden layers.
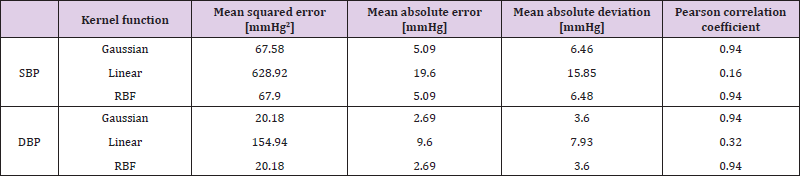
Table 2: Performance indicators of the SVM models in estimating the SBP and DSP.
Discussion
Estimation of SBP and DBP using ECG and PPG signals through machine learning algorithms is a field with very few results. Using two well-known algorithms (namely ANNs and SVM) SBP was estimated with results that were very close to the AAMI standard, whereas the estimation of DBP satisfactorily complied with that standard.Despite the fact that signals used were from 239 different patients, they all correspond to a population of ICU patients. It was not explicit which patients in the DBP were sick and which were healthy, and therefore it would be interesting to have databases that identify the condition of individual patients to create specific models for each group, or to be consider for a transversal model. Noise is generally expected with physiological signals. For this work, the noise detector was robust, because the chosen signals were mostly clean, facilitating the noise detection. The three signals (ECG, PPG and BP) were evaluated separately because they presented noise in different samples throughout the registry, and as the acquisition of these signals was performed in different body locations of the patients, many different noises can be present simultaneously or not.Feature extraction was performed manually as the first step in using ECG and PPG for pressure estimation. To improve results, a next step could be to deliver the full heartbeat to models that automatically extract the features.
Three neural network models were created each for the systolic pressure and three for the diastolic pressure using the Matlab “Neural Network” tool. The model parameters that could be varied with this tool included the number of neurons used in the hidden layer and the learning algorithm. The learning algorithm that provided the best results in the experiments was ‘Bayesian Regularization’, leaving most of the analysis to determining the level of neurons in the hidden layer. Systolic pressure estimation was able to partially fulfill the AAMI standard because the mean absolute deviation was within permitted limits, but the mean absolute error was not. On the other hand, the estimation model was capable of fully meeting the standard for diastolic pressure. Correlation in the predicted values was positive because Pearson correlation coefficients showed r > 0.92 in all models. With regard to the estimation of systolic pressure, testing with different activation functions could be an option to improve results.In the case of estimation with the SVM learning algorithm, 3 models were tested for each pressure type. It is important to emphasize that the use of cross-validation in this algorithm is crucial to obtain better results (closer to AAMI standard).
Three neural network models were created each for the systolic pressure and three for the diastolic pressure using the Matlab “Neural Network” tool. The model parameters that could be varied with this tool included the number of neurons used in the hidden layer and the learning algorithm. The learning algorithm that provided the best results in the experiments was ‘Bayesian Regularization’, leaving most of the analysis to determining the level of neurons in the hidden layer. Systolic pressure estimation was able to partially fulfill the AAMI standard because the mean absolute deviation was within permitted limits, but the mean absolute error was not. On the other hand, the estimation model was capable of fully meeting the standard for diastolic pressure. Correlation in the predicted values was positive because Pearson correlation coefficients showed r > 0.92 in all models. With regard to the estimation of systolic pressure, testing with different activation functions could be an option to improve results.In the case of estimation with the SVM learning algorithm, 3 models were tested for each pressure type. It is important to emphasize that the use of cross-validation in this algorithm is crucial to obtain better results (closer to AAMI standard).
Conclusion
This section is not mandatory but can be added to the manuscript if the discussion is unusually long or complex.
According to the above study, it can be concluded that machine learning algorithms are useful tools for estimating blood pressure values. Systolic blood pressure estimation showed promising results and was close to meet the AAMI standard, though it will be necessary to improve upon the regression models implemented. In addition, diastolic blood pressure could already correctly meet the AAMI standard.With artificial neural networks, the estimation of systolic blood pressure can be improved by changing the parameters that were not modified in the implemented models. Regarding the SVM algorithm, it can be concluded that the Gaussian Kernel function obtains better results for the estimation of both pressures. Even so, improvements are necessary for the systolic blood pressure estimation model, so the mean absolute error can meet the AAMI standard. Likewise, with the neural networks, the diastolic pressure estimation obtained excellent results, according to the AAMI standard, and therefore only minor changes should be made to improve the model.It is not possible to conclude which algorithm is better for the estimation of blood pressures, but both show promising results.With the obtained results, it would be interesting to evaluate which feature has a stronger correlation with the estimation of pressure and use it to create new regression models.
As mentioned earlier, determination of whether automatic feature extraction improves these results is pending.Despite not being the focus of this work, the implementation of new noise detection algorithms is important to estimate blood pressure values in real time and thus to obtain the pressure while the patients are being monitored. Finally, besides improving the models with the algorithms that were already used, searching for new automatic learning algorithms for blood pressure estimation is an area that can be investigated. In the case of neural networks, the work was carried out with artificial neural networks of a totally connected type with a single hidden layer. To potentially enhance the obtained results, it is possible to implement neural networks with a greater abstraction capacity, such as deep neural network architectures.
Supplementary Materials
The following are available online at www.mdpi.com/xxx/s1, Figure S1: title, Table S1: title, Video S1: title.
Author Contribution
For research articles with several authors, a short paragraph specifying their individual contributions must be provided. The following statements should be used “Conceptualization, Lorena Pradenas and Sebastian Godoy; methodology, Constanza Larsen and Lorena Pradenas: software, Constanza Larsen, validation, Constanza Larsen, Lorena Pradenas and Sebastian Godoy; formal analysis, Sebastian Godoy; investigation, Lorena Pradenas; resources, Lorena Pradenas.; data curation, Sebastian Godoy; writing—original draft preparation, Constanza Larsen; writing— review and editing, Lorena Pradenas and Sebastian Godoy; visualization Constanza Larsen; supervision, Lorena Pradenas and Sebastian Godoy; project administration, Lorena Pradenas; funding acquisition, Lorena Pradenas All authors have read and agreed to the published version of the manuscript.”, please turn to the CRediT taxonomy for the term explanation. Authorship must be limited to those who have contributed substantially to the work reported.
Funding
This research was partially funded by the grants CONICYT PIA/BASAL AFB180003 and CONICYT-PCHA/Magíster Nacional/2015-2215220
Acknowledgment
In this section you can acknowledge any support given which is not covered by the author contribution or funding sections. This may include administrative and technical support, or donations in kind (e.g., materials used for experiments).
Conflicts of Interest
Declare conflicts of interest or state “The authors declare no conflict of interest.” Authors must identify and declare any personal circumstances or interest that may be perceived as inappropriately influencing the representation or interpretation of reported research results. Any role of the funders in the design of the study; in the collection, analyses or interpretation of data; in the writing of the manuscript, or in the decision to publish the results must be declared in this section. If there is no role, please state “The funders had no role in the design of the study; in the collection, analyses, or interpretation of data; in the writing of the manuscript, or in the decision to publish the results”.
References
- Elliott M, A Coventry (2012) Critical care: the eight vital signs of patient monitoring. British Journal of Nursing 21(10): 621-625.
- Zhang Q (2010) Cuff-free blood pressure estimation using signal processing techniques, in Biomedical Engineering, University of Saskatchewan, Canada: 63.
- (2015) World Health Organization, Q&A on Hypertension, WHO.
- Choi Y, Zhang Q, SKO (2013) Noninvasive cuff less blood pressure estimation using pulse transit time and Hilbert–Huang transform. Computers & Electrical Engineering 39(1): 103-111.
- Forouzanfar M, Himi RD, Voicu ZG, Miodrag B, Sreeraman R, et al. (2015) Oscillometric Blood Pressure Estimation: Past, Present, and Future. IEEE Reviews in Biomedical Engineering 8: 44-63.
- Argha A, Ji W, Steven Su W, Branko GW (2019) Blood Pressure Estimation From Beat-by-Beat Time-Domain Features of Oscillometric Waveforms Using Deep-Neural-Network Classification Models. Ieee Access: 113427-113439.
- Chandrasekhar A, Mohammed Y, Jin oh Hahn, Shin H, Chen HC, et al. (2019) Formulas to Explain Popular Oscillometric Blood Pressure Estimation Algorithms. Frontiers in Physiology: 14.
- Peter L, N Noury, M Cerny (2014) A review of methods for non-invasive and continuous blood pressure monitoring: Pulse transit time method is promising? IRBM 35(5): 271-282.
- Chen S, Zhong Ji, Haiyan Wu, Yingchao X (2019) A Non-Invasive Continuous Blood Pressure Estimation Approach Based on Machine Learning. Sensors (Basel, Switzerland) 19(11): 2585.
- Sharman JE, Alberto PV, Johannes B, Athanase B, Jacques B, et al. (2017) Validation of non-invasive central blood pressure devices: ARTERY Society task force consensus statement on protocol standardization. European heart journal 38(37): 2805-2812.
- Li Y, Shengnan L, Houbing S, Bin Shao, Xiao Y, et al. (2019) Noninvasive blood pressure estimation with peak delay of different pulse waves. International Journal of Distributed Sensor Networks, 2019. 15(3): 1550147719837877.
- Sajgalik P, Valcav K, Vratislav F, Simon M, John MS, et al. (2019) Noninvasive Blood Pressure Monitor Designed for Patients with Heart Failure Supported with Continuous-Flow Left Ventricular Assist Devices. ASAIO Journal 65(2): 127-133.
- Lee S, Sreeraman R, Gwanggil J, Joon HC, Hilmi RD, et al. (2017) Oscillometric blood pressure estimation by combining nonparametric bootstrap with Gaussian mixture model. Computers in Biology and Medicine 85: 112-124.
- Babbs CF (2015) The origin of Korotkoff sounds and the accuracy of auscultatory blood pressure measurements. Journal of the American Society of Hypertension 9(12): 935-950.
- Celler BG (2017) Improving the quality and accuracy of non-invasive blood pressure measurement by visual inspection and automated signal processing of the Korotkoff sounds. Physiological Measurement 38(6): 1006-1022.
- Wang BT (2018) THE BLOOD PRESSURE(BP) MEASURING METHOD OF KOROTKOFF-SOUND COULDN'T MEASURE NON-INVASIVE DIASTOLIC BP. Journal of Hypertension 36: E116-E117.
- Pan F, Fei C, Chen L, Zhipeng Y, Zhihong L, et al. (2018) Quantitative Comparison of Korotkoff Sound Waveform Characteristics: Effects of Static Cuff Pressures and Stethoscope Positions. Annals of Biomedical Engineering 46(11): 1736-1744.
- Pan F, Peiyu H, Chengyu L, Taiyong L, Alan M, et al. (2017) Variation of the Korotkoff Stethoscope Sounds During Blood Pressure Measurement: Analysis Using a Convolutional Neural Network. Ieee Journal of Biomedical and Health Informatics 21(6): 1593-1598.
- Allen J (2007) Photoplethysmography and its application in clinical physiological measurement. Physiological Measurement 28(3): R1-R39.
- Ackland GL, Charles SB, Maurizio C, Can I, Michael GI, et al. (2019) Perioperative Quality Initiative consensus statement on the physiology of arterial blood pressure control in perioperative medicine. British Journal of Anaesthesia 122(5): 542-551.
- Li, Pan Y, Chen H, Ye S, Yan H (2008) The Establishment of a Non-Invasive Continuous Blood Pressure Measure System Based on Pulse Transit Time. in 2008 s2nd International Conference on Bioinformatics and Biomedical Engineering.
- Simpson DM, A D Stefano, R Allen, ME Lutman (2005) Demystifying Biomedical Signals: A student centred approach to learning signal processing. Medical Engineering & Physics 27(7): 583-589.
- Wang R, Wenyan J, Zhi Hong M, Robert JS, Mingui S (2014) Cuff-Free Blood Pressure Estimation Using Pulse Transit Time and Heart Rate. International conference on signal processing proceedings. International Conference on Signal Processing: 115-118.
- Feng JJ, Zhongyi H, Congcong Z, Xuesong Y (2018) Study of continuous blood pressure estimation based on pulse transit time, heart rate and photoplethysmography-derived hemodynamic covariates. Australasian Physical & Engineering Sciences in Medicine 41(2): 403-413.
- Monte Moreno E (2011) Non-invasive estimate of blood glucose and blood pressure from a photoplethysmograph by means of machine learning techniques. Artificial Intelligence in Medicine 53(2): 127-138.
- Wu TH, EW Kwong, GK Pang (2015) Bio-medical Application on Predicting Systolic Blood Pressure Using Neural Networks. in 2015 IEEE First International Conference on Big Data Computing Service and Applications.
- Zhang B, Huihui R, Guoyanm H, Yongqing C, Changzen H (2019) Predicting blood pressure from physiological index data using the SVR algorithm. BMC Bioinformatics 20(1): 109.
- Golino H, Amaral L, Durate S, Gomes C, Soares T, et al. (2014) Predicting Increased Blood Pressure Using Machine Learning. Journal of obesity: 637635.
- Shen Z, Miao F, Qinghan M, Li Y (2015) Cuffless and continuous blood pressure estimation based on multiple regression analysis 117-120.
- Lazazzera RY, Belhaj Y, G Carrault (2019) A New Wearable Device for Blood Pressure Estimation Using Photoplethysmogram. Sensors (Basel, Switzerland) 19(11): 2557.
- Liang Y, Zhengcheng C, Rabad W, Mohammed E (2018) Hypertension Assessment via ECG and PPG Signals: An Evaluation Using MIMIC Database. Diagnostics (Basel, Switzerland) 8(3): 65.
- Hellqvist H, Reitz H, Kahan TS, Hedner J, Grote L, et al (2019) STIFFNESS INDEX DERIVED FROM OVERNIGHT PHOTOPLETHYSMOGRAPHY, AND ITS RELATIONS TO AMBULATORY ARTERIAL STIFFNESS INDEX, BLOOD PRESSURE AND CARDIOVASCULAR RISK. Journal of Hypertension 37: E1-E1.
- Martinez G, Newton H, Derek A, Kenneth L, Rabad W, et al. (2018) Can Photoplethysmography Replace Arterial Blood Pressure in the Assessment of Blood Pressure? Journal of Clinical Medicine 7(10): 13.
- Zadi AS, Raichel A, Rong Z, Donald EW, Khosrow B, et al. (2018) Arterial blood pressure feature estimation using photoplethysmography. Computers in Biology and Medicine 102: 104-111.
- Zekavat SM, Krishna A, Connor E, Amit VK, Deverk K, et al. (2019) Genetic Association of Finger Photoplethysmography-Derived Arterial Stiffness Index with Blood Pressure and Coronary Artery Disease. Arteriosclerosis Thrombosis and Vascular Biology 39(6): 1253-1261.
- Patzak A, Yuri M, Heiko G, Martin K (2015) Continuous blood pressure measurement using the pulse transit time: Comparison to intra-arterial measurement. Blood Pressure 24(4): 217-221.
- Gao MW, Hao Mc, Shin HS, Chen HC, Nicholas B, et al. (2017) Estimation of Pulse Transit Time as a Function of Blood Pressure Using a Nonlinear Arterial Tube-Load Model. Ieee Transactions on Biomedical Engineering 64(7): 1524-1534.
- Kissas G, Ynag Y, Hwuang E, Witschey RW, Detere J, et al. (2020) Machine learning in cardiovascular flows modeling: Predicting arterial blood pressure from non-invasive 4D flow MRI data using physics-informed neural networks. Computer Methods in Applied Mechanics and Engineering 358: 28.
- Hamano G, A Lowe, D Cumin (2017) Design of spiking neural networks for blood pressure prediction during general anesthesia: considerations for optimizing results. Evolving Systems 8(3): 203-210.
- Li P, Liu M, Zhang X, Hu X, Pang B, et al. (2016) Novel wavelet neural network algorithm for continuous and noninvasive dynamic estimation of blood pressure from photoplethysmography. Science China-Information Sciences 59(4): 10.
- Xiao HG, Ahmed Q, Mark B, Alberto A (2017) Estimation of aortic systolic blood pressure from radial systolic and diastolic blood pressures alone using artificial neural networks. Journal of Hypertension 35(8): 1577-1585.
- Xu ZH, Liu J, Chen X, Wang Y, Zhao Z (2017) Continuous blood pressure estimation based on multiple parameters from eletrocardiogram and photoplethysmogram by Back-propagation neural network. Computers in Industry 89: 50-59.
- Pan F, He P, Chen F, Zhang J, Wang H, et al. (2019) A novel deep learning based automatic auscultatory method to measure blood pressure. International journal of medical informatics 128: 71-78.
- Zhou W, Wang L, Xing Y, Zhou X (2018) A Novel Neural Network Model for Blood Pressure Estimation Using Photoplethesmography without Electrocardiogram. Journal of Healthcare Engineering: 9.
- Radha M, Groot K, Nikita R, Wong C, Kobold C, et al. (2019) Estimating blood pressure trends and the nocturnal dip from photoplethysmography. Physiological Measurement 40(2): 025006.
- M Shamsollahi, A Badiee, M Ghazanfari (2019) Using Combined Descriptive and Predictive Methods of Data Mining for Coronary Artery Disease Prediction: a Case Study Approach. Journal of AI and Data Mining 7(1): 47-58.
- Goldberger AL, Amaral AN, Glass L, Hausdoff JM, Ivanov PC, et al. (2000) PhysioBank, PhysioToolkit, and PhysioNet. Circulation 101(23): e215-e220.
- Saeed M, Villarroel M, Reisner AT, Clifford G, Lehman LW, et al. (2011) Multiparameter Intelligent Monitoring in Intensive Care II: a public-access intensive care unit database. Critical care medicine 39(5): 952-960.
