 Research Article
Abstract
The aim of the study was to determine the physicochemical characteristics, metal levels and anion content of water samples collected from Abakaliki, Ebonyi and Ikwo Local Government Area of Ebonyi State, Nigeria. A total of 736 water samples, comprising of 215, 111, 144, 117 and 149 from boreholes, ponds, rivers, streams and wells respectively, were collected from three local governments areas (Abakaliki, Ebonyi and ikwo) of Ebonyi State over a period of eight (8) months. Samples were analysed for physicochemical, metal, anion and microbiological characteristics using standard scientific procedures. Results revealed varying ranges in alkalinity (140.60 ± 0.20 - 368.50 ± 0.20mgL-1), BOD (1.20 ± 0.12 - 13.36 ± 0.05mgL-1), COD (3.14 ± 0.95 - 14.20 ± 0.05mgL-1), conductivity (2.30 ± 0.40 - 0.01 ± 0.12msL-1), DO (0.02 ± 1.11 - 7.50 ± 0.20mgL-1), ph (5.80 ± 0.00 - 7.83 ± 0.40), salinity (91.59 ± 0.50 - 221.20 ± 0.20%), temperature (20.01 ± 1.50 - 29.00 ± 1.500C), TSS (89.11 ± 0.50 - 750.00 ± 1.80mgL-1), TH (72.80 ± 0.00 - 262.30 ± 0.10mgL-1), TOC (0.64 ± 1.50 - 5.50 ± 0.60mgL-1), TSS (152.10 ± 1.20 - 485.90 ± 0.20mgL- 1), turbidity (3.38 ± 0.98 - 11.40 ± 0.81 NTU), aluminium (0.01 ± 0.00 - 0.22 ± 0.02mgL- 1), arsenic (0.01 ± 0.01 - 0.06 ± 0.01mgL-1), cadmium (0.02 ± 0.00 - 0.40 ± 0.00mgL-1), calcium (20.00 ± 0.02 - 68.00 ± 0.00mgL-1), chromium (0.01 ± 0.00 - 0.09 ± 0.00mgL- 1), copper (0.20 ± 0.01 - 0.80 ± 0.00mgL-1), iron (0.20 ± 0.00 - 0.88 ± 0.00mgL-1), lead (0.02 ± 0.00 - 0.19 ± 0.02mgL-1), chlorides (40.00 ± 0.01 - 265.00 ± 0.00mg/L), nitrates (11.86 ± 0.16 - 65.00 ± 0.02mg/L) and phosphates (0.08 ± 0.08 - 16.00 ± 0.00mg/L). In conclusion, this investigation revealed that the levels of physicochemical parameters in the water samples were beyond NSDWQ and who recommended limits signifying a potential problem for human and animal health. It is imperative to monitor the quality of water and strict quality control measures should be strengthened to ensure the effective treatment of drinking water. Educative programmes should be organized by researchers, and government agencies to enlighten the villagers on the proper use of water and the potential dangers associated with human consumption of contaminated water.
Keywords: Water; Physicochemical Characteristics; Metal Levels and Anion Content; Nsdwq and Who Recommended Limits
Introduction
Water is an essential natural resource for sustainability of life on earth. Humans may survive for several weeks without food, but barely few days without water because constant supply of water is needed to replenish the fluids lost through normal physiological activities, such as respiration, perspiration and urination [1]. Though the hydrosphere is estimated to contain about 1.36 billion km3, only about 0.3% of the water, existing as fresh water in rivers, streams, springs and aquifers, is available for human use; the remaining 99.7 % is locked up in seas and oceans. The geological constraints limit accessibility of many human communities to water that is adequate in terms of quantity, quality and sustainability. Lack of adequate supply of potable water is a critical challenge in developing countries such as Nigeria. Potable water, also called drinking water about its intended use, is defined as water which is fit for consumption by humans and other animals [2]. The usual sources of drinking water namely streams, rivers, wells and boreholes are mostly untreated and associated with various health risks (Agbarie and Obi, 2009). Paucity of infrastructure for effective treatment and distribution of water accounts for the incidence of high morbidity and mortality rate associated with water borne diseases in developing countries [1]. A tremendous amount of attention has been directed toward pollution of water supplies and the subsequent effects on the life of many animals and human [3].
Unless water meets certain physical, chemical and microbiological standards it cannot be described as potable and safe for drinking. Scientific studies have been carried out to determine these parameters in different drinking water sources including: borehole water [4-9], well water [10-14], lake [15], stream/river water [16,17] and packaged water [18- 20]. The aim of the study is to determine the physicochemical characteristics, metal levels and anion content of water samples collected from Abakaliki, Ebonyi and Ikwo Local Government Area of Ebonyi State, Nigeria.
Materials and Methods
Study Site and Description of Study Area
The study area of this research was Ebonyi State, Nigeria. Ebonyi State is in the south-eastern part of Nigeria which lies approximately within longitude 70301 and 70E and latitude 50401 and 60451N. It has a population of 149,683 and a land mass of about 5,935 square kilometres (NPC census, 2006). To this study, water samples were collected from three local government areas which include: Abakaliki, Ebonyi and Ikwo. The area is chosen because most households are dilapidated and unhygienic, and defecation on open fields and farmlands is a common practice observed in this area. Apart from rainwater and pipe borne water in few households, sources of water for drinking and domestic uses come from boreholes, shallow wells, rivers and ponds that are regularly contaminated with both human and animal faeces. The water is used for agriculture, transportation, human consumption, various industrial activities and domestic purposes. Some of such water sources constantly receive effluents from slaughterhouses, industries, farmlands and domestic power plants (Figure 1).
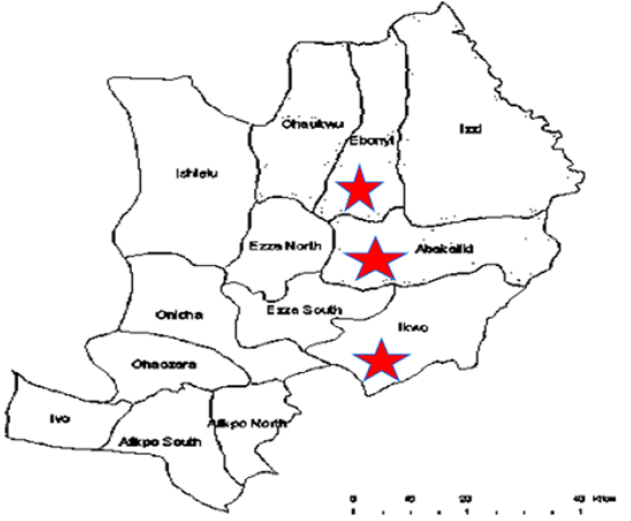
Figure 1: Map of Ebonyi State with red stars showing the study areas (Google.com, 2019).
Sample Collection
Water samples were collected between a period of eight (8) months (February to September 2018) covering both dry and rainy seasons. Water samples from five sampling sources namely: stream, river, well, borehole and pond from designated areas were collected for this study. A total of 736 water samples were collected by grab sampling procedure in accordance with standard methods for examination of water as recommended by Standard Method for microbiological analysis. The water samples for microbiological examination, were collected in non-reactive borosilicate glass bottles of 500 ml capacity each that had been cleansed and rinsed carefully, given a final rinse with distilled water and sterilized. Samples were taken from each source by holding the bottle near its base with hand and plunging it, neck downward, below the surface. Then turning the bottle until neck points slightly upward and mouth is directed toward the current. The sampling bottle were not filled to the brim and 20 to 30mm space were left for effective shaking of the bottle [21]. Each sample was collected in triplicates. For the collection of borehole samples, the sampling protocols described by APHA [22] were strictly adhered to during sample collection. Each sample for analysis was collected in sterilized 500ml glass bottles with screw caps after pumping water sample to waste for 5 to 7 minutes. Triplicate samples were taken from each sampling point aseptically into sterilized 500ml glass bottles, kept in an ice chest and transported immediately to the microbiology laboratory of Ebonyi State University Abakaliki within 1hrs of collection for analysis. Map of Ebonyi State with red stars showing the study areas (Google.com, 2019).
Sampling Guide
A total of 736 water samples, comprising of 215, 111, 144, 117 and 149 from boreholes, ponds, rivers, streams and wells respectively, were collected. For easy identification, the water samples were labelled as B1 - B215, P1 - P111, R1 - R144, S1 - S117 and W1 - W149 for samples from boreholes, ponds, rivers, streams and wells respectively. This is summarized in Table 1.
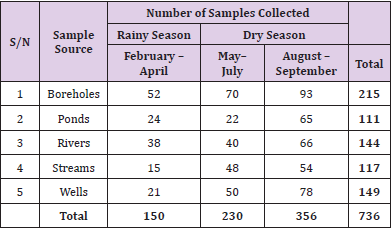
Table 1: Sampling Guide Showing Number of Samples Collected and Sample Sources.
Physicochemical Studies
Physicochemical characteristics which were studied include: alkalinity, biochemical oxygen demand (BOD), chemical oxygen demand (COD), conductivity, dissolved oxygen (DO), odour, pH, salinity, taste, temperature, total dissolved solid (TDS), total hardness, total organic carbon, total suspended solid (TSS) and turbidity. Each parameter was measured in triplicates from which the mean and standard deviation counts were determined.
Determination of Alkalinity
Exactly 50ml of the sample was pipetted into a clean 250ml conical flask. Two drops of methyl red indicator were added and the solution titrated against a standard 0.01M NaOH solution to a pink end-point [1].
Determination of Biochemical Oxygen Demand
About 75.0cm3 (25%) of each of the water samples was measured and added into 300cm3 BOD bottles in duplicates using measuring cylinder and the bottles filled to the brim with 225cm3 (75 %) of the dilution water, which was shaken to saturate with oxygen following the procedures described by Admemoroti [23]. The initial DOo was determined instantly on one set, while the other set and black dilution water was incubated for 5 days in the dark at 20oC. After 5 days, the DO5 of the incubated water samples was determined and BOD computed using the formula:
BOD (mgL-1) = (DOo – DO5) x BOD bottle
vol. of sample used.
Determination of Chemical Oxygen Demand
Following the procedures of Mendham et al. (2004), a measuring cylinder was used to measure 50cm3 of water sample into 250cm3 conical flask with ground glass neck fitted to water condenser for refluxing. About 1.0g of HgSO4 was washed and added to the solution, followed by 80ml of Ag2SO4-H2SO4 solution and 0.002gram of sulphuric acid. Then the flask was fixed to the lie-big condenser and refluxed for 15 minutes and cooled, while cooling the lie-big was rinsed with 50ml of de-ionized water and added to the flask whereas, 3 drops of ferroin indicator and the mixture titrated against ammonium iron (II) tetra oxosulphate (IV) solution from blue green to brown.
Determination of Conductivity
The determination of conductivity was done on-site using a Jen way conductivity meter. The probe was dipped into the container of the samples until a stable reading was obtained [1].
Determination of Dissolved Oxygen (DO)
Dissolved oxygen was determined according to Winkler’s method as described in Sharma [25] with little modification. Water samples were carefully collected by filling 250cm3 to the brim and covered, while the bottle was under the water. Then 1.0cm3 pipette was used to add 1.0cm3 50% manganese solution and 1.0cm3 alkaline- iodide azide solution and re-stopped. The mixture was well shaken which produced a precipitate which could settle for 20 minutes, then 3.0 cm3 85% phosphoric acid was added which dissolved the precipitate and liberated iodine. Using measuring cylinder, 100.0cm3 of the water samples were transferred into 250cm3 conical flask and titrated against standard Na2S2O3 solution to pale yellow. Then, 1.0cm3 starch solution was added and the blue solution titrated [24].
Determination of pH
This was carried out in-situ at the site of sample collection. Thermo Scientific (model STAR 111) pH meter was used following the procedures taken by Sharma [25] with little modification. About 20ml of the water sample was measured into a cleaned beaker. The Tip of the probe was rinsed with distilled water. The rinsed probe was inserted in the sample. The instrument could read the pH of the sample for four minutes.
Determination of Salinity
Salinity was determined using a multiple parameter Turbidimeter. The probe was dipped into the water samples until a stable reading was obtained and recorded following the procedures taken by Sharma, (2011) with little modification.
Determination of Temperature
The determination of temperature was carried out at the site of sample collection. Thermo Scientific pH meter was used as it gives both the pH and temperature of water at the same time [25].
Determination of Total Dissolved Solid (TDS)
A dish of 200cm3 was dried at 105 ± 3oC in an ovum to constant weight, then cooled to room temperature in a desiccator and weighed. About 100ml each of the water sample were poured into the dish and evaporated to dryness on a steam bath, then the outside of dish was wiped and the residue dried in an ovum for 1 hour at 105±3oC, transferred to desiccators, cooled to room temperature and weighed until a constant weight was obtained [25].
Determination of Total Hardness
The total hardness (TH) was determined according to American Public Health Association (APHA), American Water Works Association (AWWA) and Water Environment Federation (WEF), (2012) guidelines. The principle for the determination of the total hardness of water is based on a complexometric titration of calcium and magnesium with an aqueous solution of the disodium salt of EDTA at pH 10, using an Eriochrome Black T indicator. The water hardness, due to Ca2+ and Mg2+, is expressed as mg/L CaCO3. Fifty millilitres of sample was pipetted into a 250ml conical flask. Two millilitres of the buffer solution and 2 drops of the Eriochrome Black T indicator solution was added.
Determination of Total Organic Carbon (TOC)
Total Organic Carbon (TOC) was measured by using Apollo 9000 TOC Combustion Analyzer. It calculates TOC values of the samples in mg/l. It analyses the sample automatically starting from sample handling to the final analysis and diagrams [25].
Determination of Total Suspended Solid (TSS)
Marked evaporating crucibles (e.g. A1, B1, C1, etc) were heated in an oven and cooled in a desiccator. The clean crucibles were weighed with an analytical balance. A 20ml of each of the samples were measured with a measuring cylinder, poured into each crucible and placed on the water bath to evaporate to dryness. Upon drying, the crucibles were removed and placed in an oven at 105oC for one hour after which they were cooled in a desiccator for 20 minutes and reweighed using an analytical balance.
Determination of Turbidity of the Water Samples
Turbidity was determined on site with HACH 2100 p portable turbidimeter. The samples were poured into the measuring bottle and the surface of the bottle were wiped with silicon oil. The bottle was inserted into the turbidimeter and the reading was obtained [26].
Determination of Heavy Metals in the Water Samples
Fourteen (14) heavy metals including: aluminium (Al), arsenic (As), cadmium (Cd), calcium (Cl), chromium (Cr), copper (Cu), iron (Fe), lead (Pb), magnesium (Mg), manganese (Mn), mercury (hg) and zinc (Zn) were determined in each sample using atomic absorption spectrometer (AAS) according to standard analytical procedures (Mendham et al., 2004). Water samples were spiked with 1ml concentrated nitric acid and filtered using Whatmann no. 542 filter paper (Sharma, 2011). The concentrations of the metals were analysed using AAS. Potassium (k) and Sodium (Na), levels were analysed using flame photometer (Perkin Elmer: 52-A).
Analysis of Anions
The levels of anions in the water samples were determined using Perkin Elmer UV-Vis spectrophotometer at different wavelengths. Anions determined include chlorides, nitrates, sulphates and phosphates. Chlorides was determined by Mohr’s method using argentiometric titration [23]. Nitrates was determined at the wavelength of 410nm, phosphates at 500nm and sulphates at 450nm.
Chloride Determination
The analytical method for the determination of chloride is based on the formation of mercury (II) chloride from a reaction between chloride and mercury (II) thiocyanate. The liberated thiocyanate reacts with the ferric nitrate present to produce coloured ferric thiocyanate whose concentration is measured spectrophotometrically at wavelength of 463nm. The concentration of ferric thiocyanate is proportional to chloride concentration. The determination was done according to Sharma [25].
Determination of Nitrates
Nitrates was determined using the UV-Visible spectrophotometric method as described by Sharma, [25].
Determination of Phosphate
The analytical method for the determination of phosphate is based on the formation of 12-molybdophosphoric acid from phosphate and molybdate in acid solution and subsequent reduction to a blue heteropoly compound (phosphomolybdenum blue). The determination was done according to Omaka [27].
Determination of Sulphate
The analytical method for the determination of Sulphate is based on the reaction of Sulphate with barium chloride to form a suspension of barium Sulphate which is stabilised by gelatine and thymol. Hydrochloric acid is present to prevent the precipitation of barium carbonate, phosphate and sulphite. The turbidity is measured spectrophotometrically at 495nm. The determination was done according to Sharma [26].
Statistical Analysis
The raw data on the physicochemical obtained were presented as mean ± standard deviation in tables and bar charts while relevant data were interpreted using simple descriptive statistics such as minimum, maximum, and one way analysis of variance (ANOVA) with the aid of IBM Statistical Package for Social Sciences (SPSS) version 22 and Microsoft Excel 2013 software.
Results
Tables 2-16 shows the results of selected physicochemical characteristics of water samples collected from different water sources in the study areas and was compared with Nigerian Standard for Drinking Water Quality [28] and World Health Organization [29] recommended limits for drinking water. Tables 17-31 shows the results of selected metal content of water samples collected from different water sources in the study areas and was compared with Nigerian Standard for Drinking Water Quality [28] and World Health Organization [29] recommended limits for drinking water. Tables 32-46 shows the results of selected metal content of water samples collected from different water sources in the study areas and was compared with Nigerian Standard for Drinking Water Quality [28] and World Health Organization recommended limits for drinking water.
Table 2: Physicochemical Characteristics of Water Samples Collected from Boreholes in Different Locations of Abakaliki Local Government Area Compared with NSDWQ and WHO Recommended Limits.
Table 3: Physicochemical Characteristics of Water Samples Collected from Ponds in Different Locations of Abakaliki Local Government Area Compared with NSDWQ and WHO Recommended Limits.
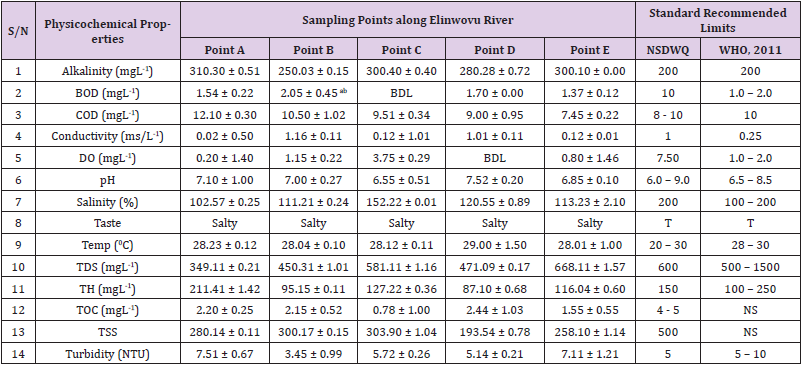
Table 4: Physicochemical Characteristics of Water Samples Collected from Different Sampling Points along Elinwovu River of Abakaliki Local Government Area Compared with NSDWQ and WHO Recommended Limits. Physicochemical Characteristics of Water Samples Collected from Different Sampling Points along Elinwovu River of Abakaliki Local Government Area Compared with NSDWQ and WHO Recommended Limits.
Table 5: PhysicochemicalCharacteristics of Water Samples Collected from Streams in Different Locations of Abakaliki Local Government Area Compared with NSDWQ and WHO Recommended Limits.
Table 6: Physicochemical Characteristics of Water Samples Collected from Wells in Different Locations of Abakaliki Local Government Area Compared with NSDWQ and WHO Recommended Limits.
Table 7: Physicochemical Characteristics of Water Samples Collected from Boreholes in Different Locations of Ebonyi Local Government Area Compared with NSDWQ and WHO Recommended Limits.
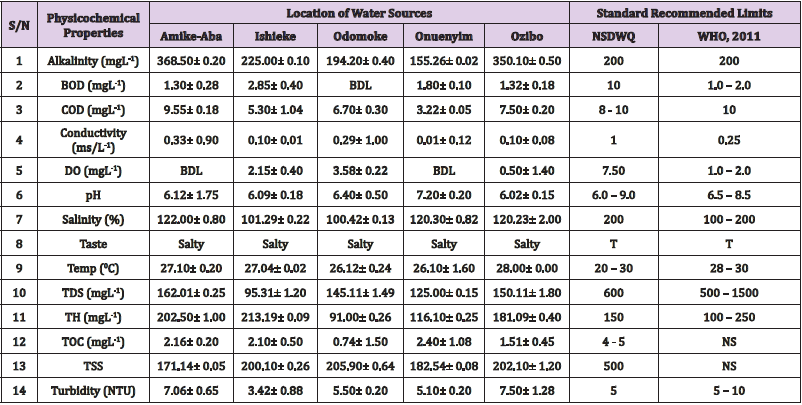
Table 8: Physicochemical Characteristics of Water Samples Collected from Ponds in Different Locations of Ebonyi Local Government Area Compared with NSDWQ and WHO Recommended Limits.
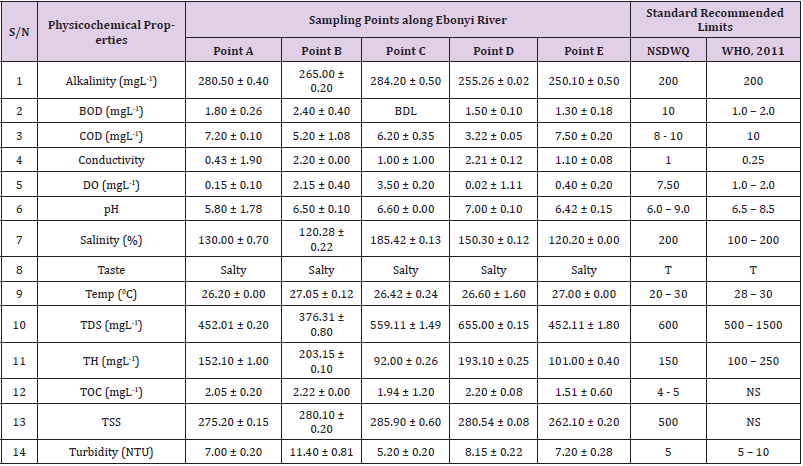
Table 9: Physicochemical Characteristics of Water Samples Collected from Different Sampling Points along Ebonyi River of Ebonyi Local Government Area Compared with NSDWQ and WHO Recommended Limits.
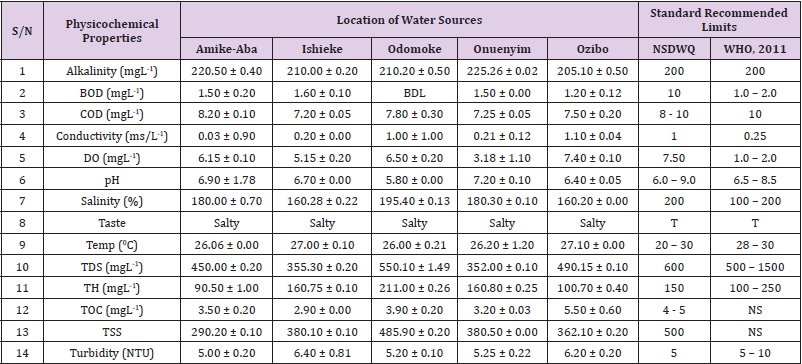
Table 10: Physicochemical Characteristics of Water Samples Collected from Streams in Different Locations of Ebonyi Local Government Area Compared with NSDWQ and WHO Recommended Limits.
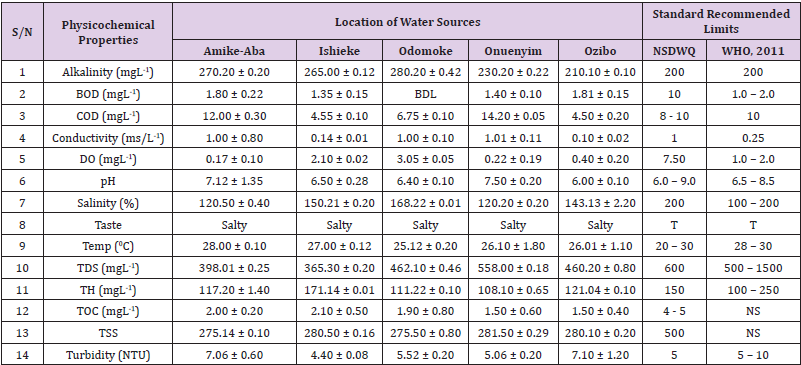
Table 11: Physicochemical Characteristics of Water Samples Collected from Wells in Different Locations of Ebonyi Local Government Area Compared with NSDWQ and WHO Recommended Limits.
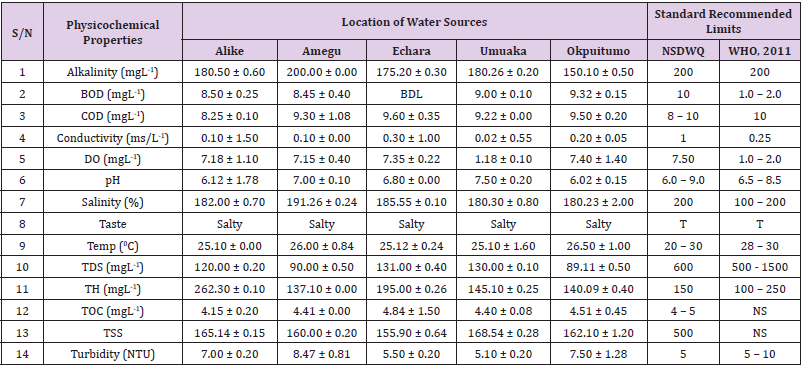
Table 12: Physicochemical Characteristics of Water Samples Collected from Boreholes in Different Locations of Ikwo Local Government Area Compared with NSDWQ and WHO Recommended Limits.
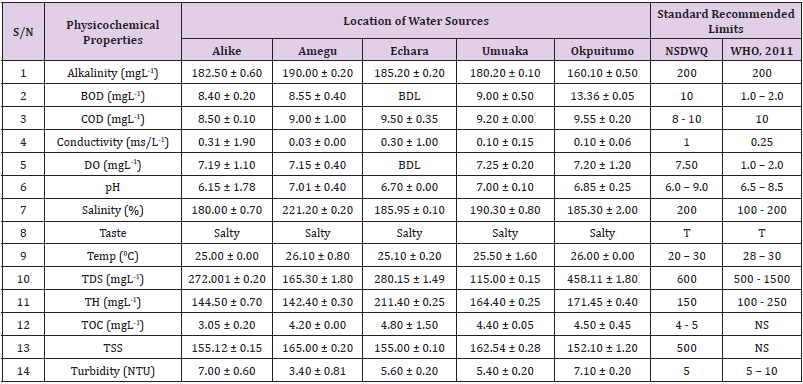
Table 13: Physicochemical Characteristics of Water Samples Collected from Ponds in Different Locations of Ikwo Local Government Area Compared with NSDWQ and WHO Recommended Limits
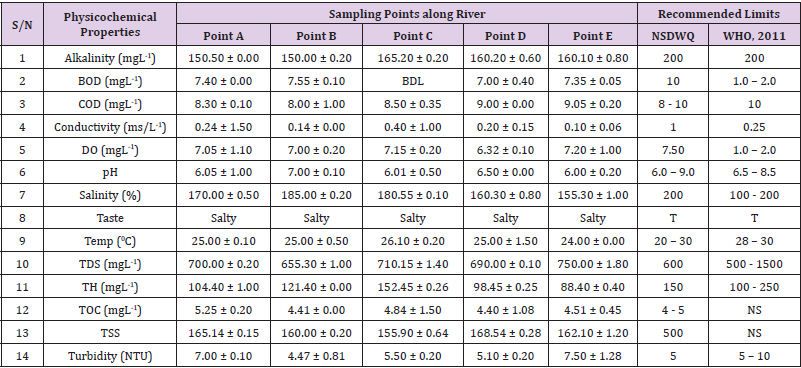
Table 14: Physicochemical Characteristics of Water Samples Collected from Ponds in Different Locations of Ikwo Local Government Area Compared with NSDWQ and WHO Recommended Limits.
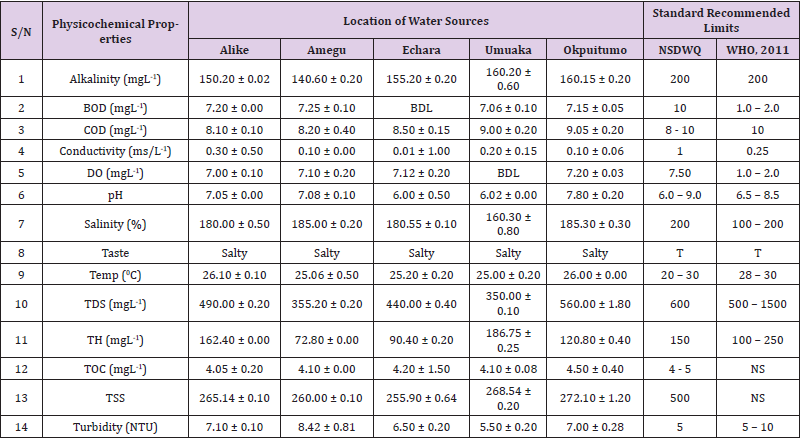
Table 15: Physicochemical Characteristics of Water Samples Collected from Streams in Different Locations of Ikwo Local Government Area Compared with NSDWQ and WHO Recommended Limits.
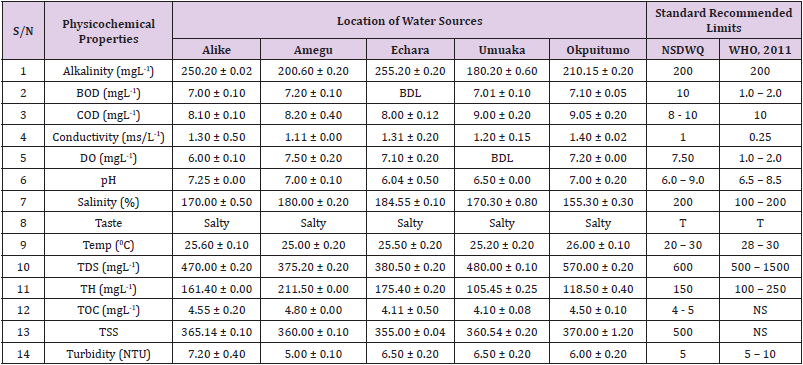
Table 16: Physicochemical Characteristics of Water Samples Collected from Wells in Different Locations of Ikwo Local Government Area Compared with NSDWQ and WHO Recommended Limits.
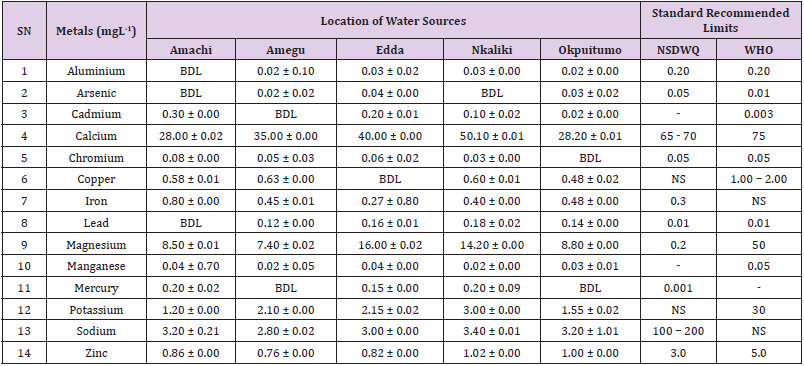
Table 17: Metal Content of Water Samples Collected from Boreholes in Different Locations of Abakaliki Local Government Area Compared with NSDWQ and WHO Recommended Limits.
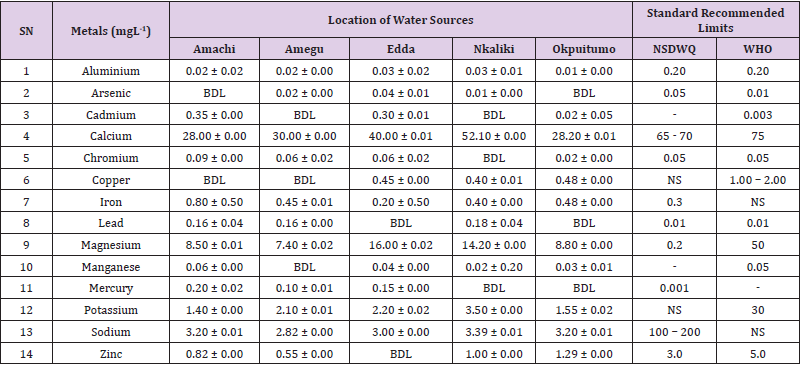
Table 18: Metal Content of Water Samples Collected from Ponds in Different Locations of Abakaliki Local Government Area Compared with NSDWQ and WHO Recommended Limits.
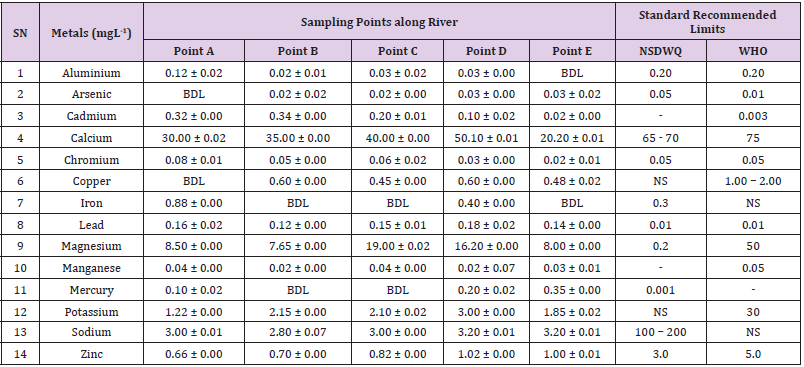
Table 19: Metal Content of Water Samples Collected from Different Sampling Points along Elinwovu River of Abakaliki Local Government Area Compared with NSDWQ and WHO Recommended Limits.
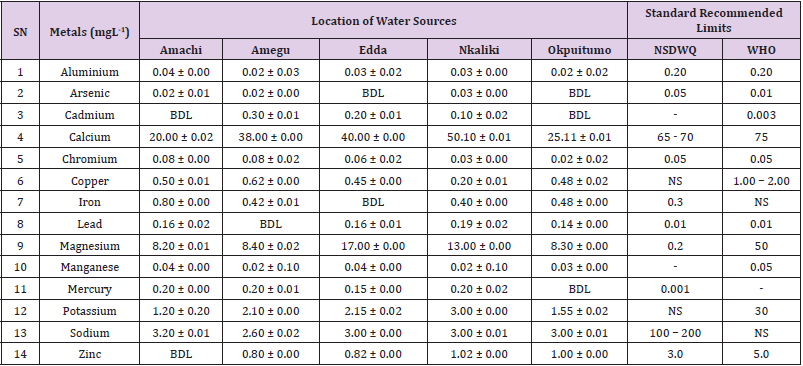
Table 20: Metal Content of Water Samples Collected from Streams in Different Locations of Abakaliki Local Government Area Compared with NSDWQ and WHO Recommended Limits.
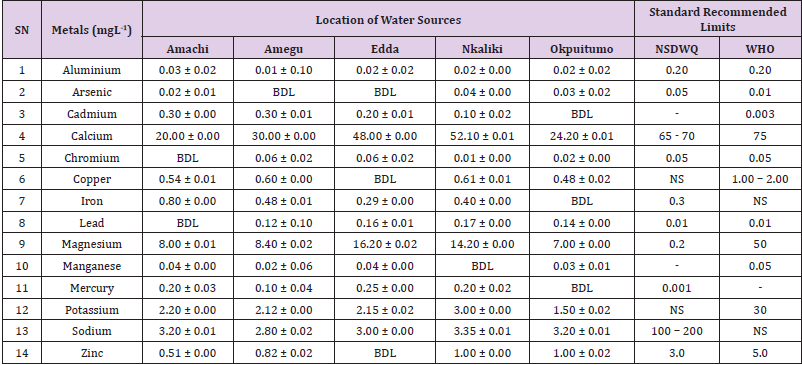
Table 21: Metal Content of Water Samples Collected from Wells in Different Locations of Abakaliki Local Government Area Compared with NSDWQ and WHO Recommended Limits.
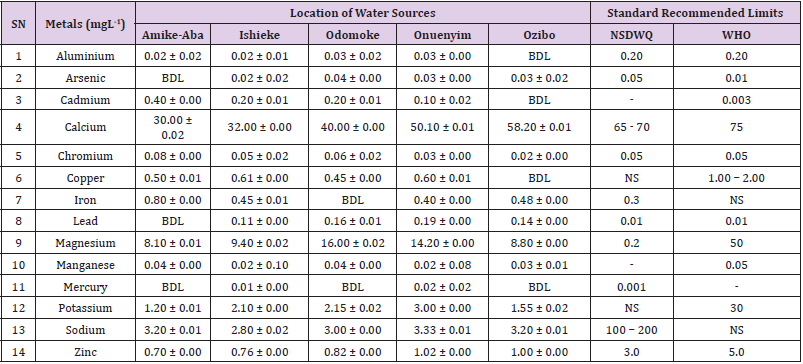
Table 22: Metal Content of Water Samples Collected from Wells in Different Locations of Abakaliki Local Government Area Compared with NSDWQ and WHO Recommended Limits.
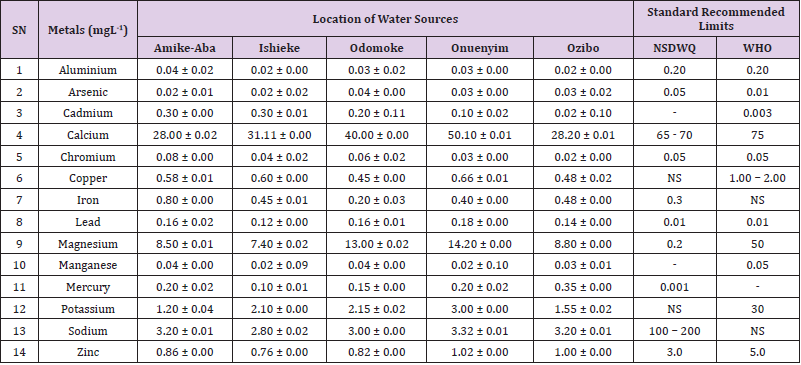
Table 23: Metal Content of Water Samples Collected from Ponds in Different Locations of Ebonyi Local Government Area Compared with NSDWQ and WHO Recommended Limits.
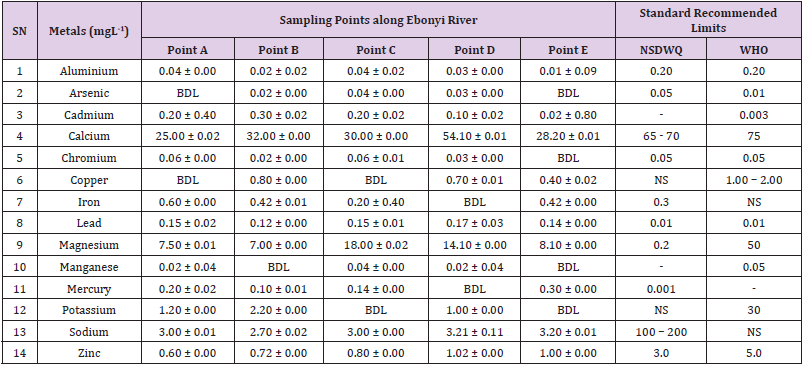
Table 24: Metal Content of Water Samples Collected from Different Sampling Points along Ebonyi River of Ebonyi Local Government Area Compared with NSDWQ and WHO Recommended Limits.
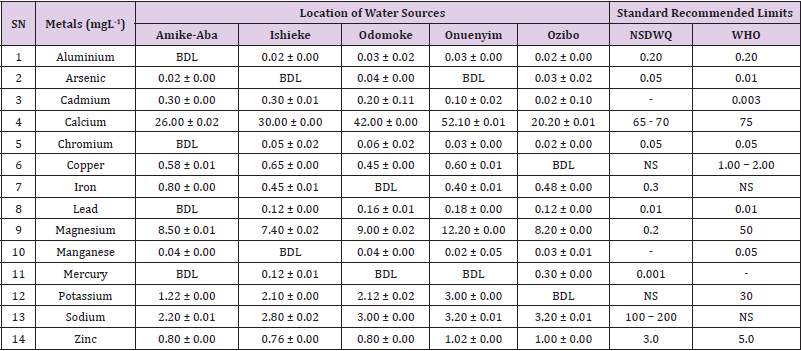
Table 25: Metal Content of Water Samples Collected from Streams in Different Locations of Ebonyi Local Government Area Compared with NSDWQ and WHO Recommended Limits.
Note: key: BDL = Below Detectable Limit, NS = Not Stated, nsdwq = Nigerian Standard for Drinking Water Quality, WHO = World Health Organization.
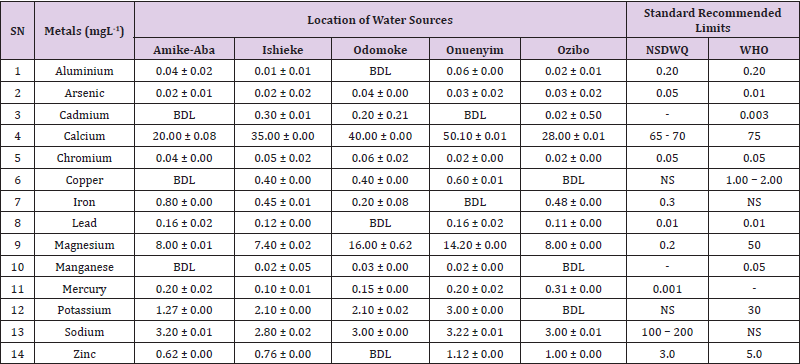
Table 26: Metal Content of Water Samples Collected from Wells in Different Locations of Ebonyi Local Government Area Compared with NSDWQ and WHO Recommended Limits.
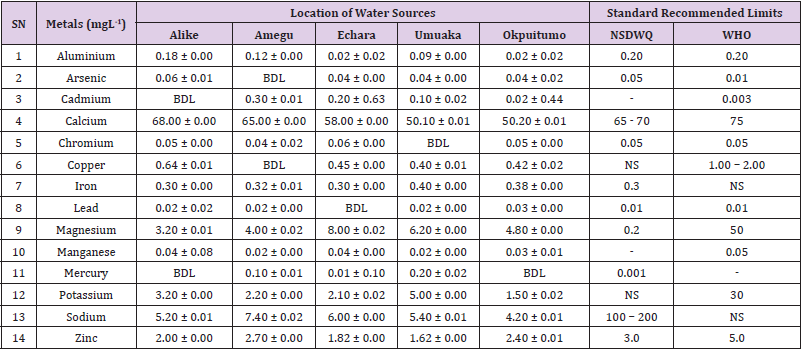
Table 27: Metal Content of Water Samples Collected from Boreholes in Different Locations of Ikwo Local Government Area Compared with NSDWQ and WHO Recommended Limits.
Note: key: BDL = Below Detectable Limit, NS = Not Stated, nsdwq = Nigerian Standard for Drinking Water Quality, WHO = World Health Organization.
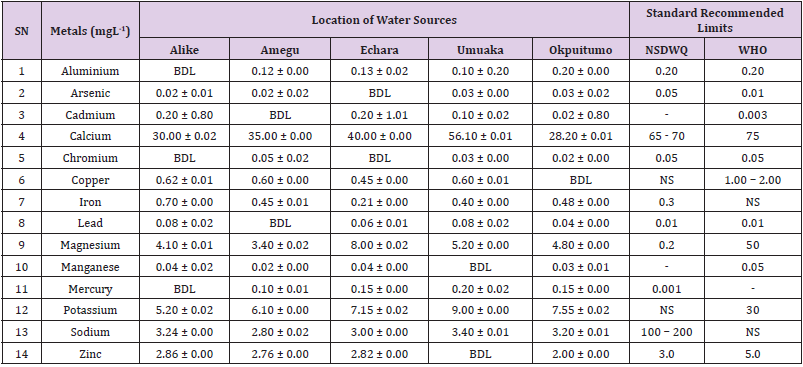
Table 28: Metal Content of Water Samples Collected from Ponds in Different Locations of Ikwo Local Government Area Compared with NSDWQ and WHO Recommended Limits.
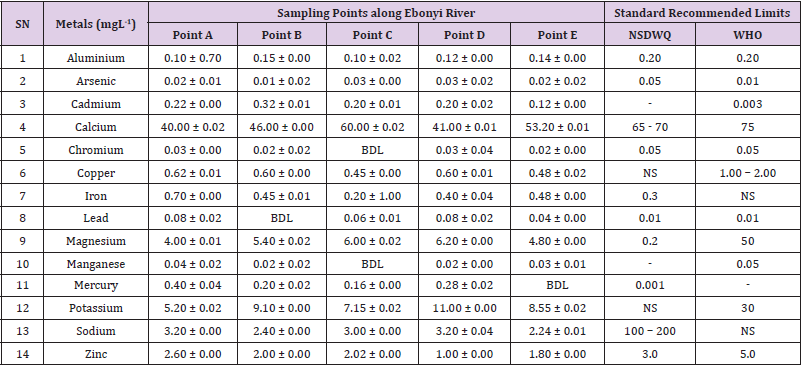
Table 29: Metal Content of Water Samples Collected from Different Sampling Points along Ebonyi River of Ikwo Local Government Area Compared with NSDWQ and WHO Recommended Limits.
Note: key: BDL = Below Detectable Limit, NS = Not Stated, nsdwq = Nigerian Standard for Drinking Water Quality, WHO = World Health Organization.
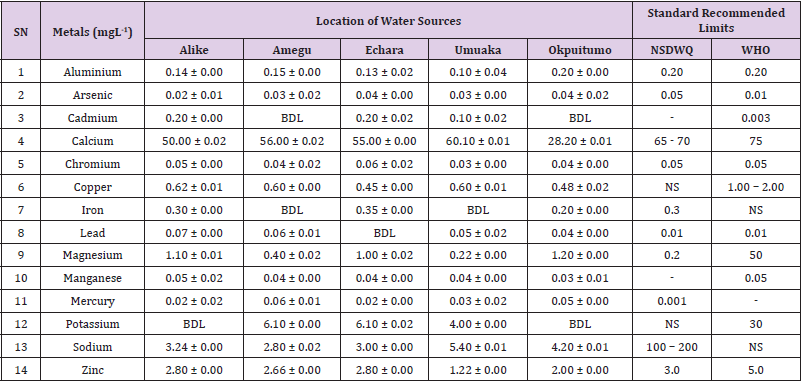
Table 30: MMetal Content of Water Samples Collected from Streams in Different Locations of Ikwo Local Government Area Compared with NSDWQ and WHO Recommended Limits.
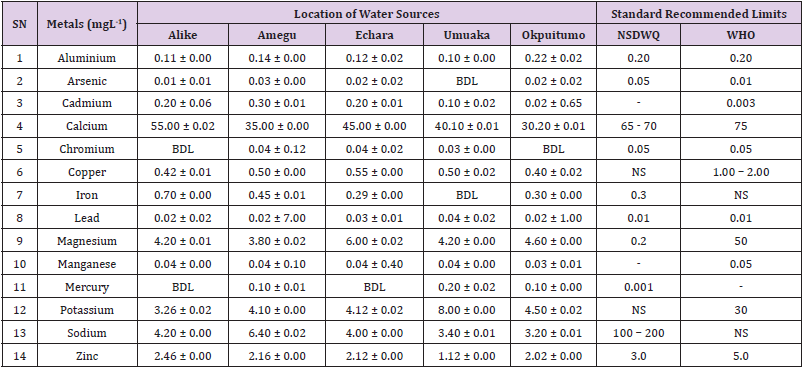
Table 31: Metal Content of Water Samples Collected from Wells in Different Locations of Ikwo Local Government Area Compared with NSDWQ and WHO Recommended Limits.
Note: key: BDL = Below Detectable Limit, NS = Not Stated, nsdwq = Nigerian Standard for Drinking Water Quality, WHO = World Health Organization.
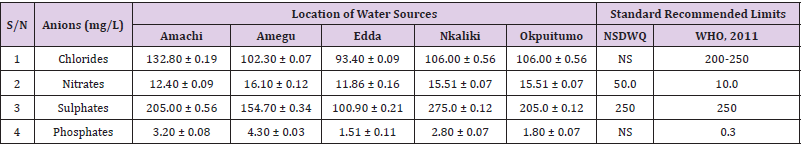
Table 32: Anion Content of Water Samples Collected from Boreholes in Different Locations of Abakaliki Local Government Area Compared with NSDWQ and WHO Recommended Limits.
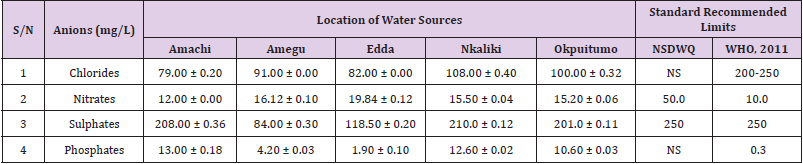
Table 33: Anion Content of Water Samples Collected from Ponds in Different Locations of Abakaliki Local Government Area Compared with NSDWQ and WHO Recommended Limits.
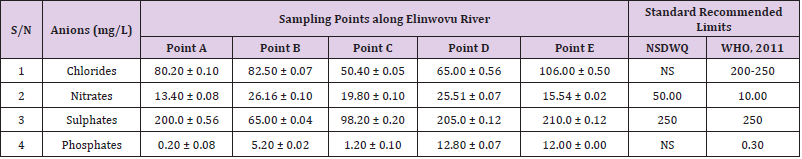
Table 34: Anion Content of Water Samples Collected from Different Sampling Points along Elinwovu River of Abakaliki Local Government Area Compared with NSDWQ and WHO Recommended Limits.
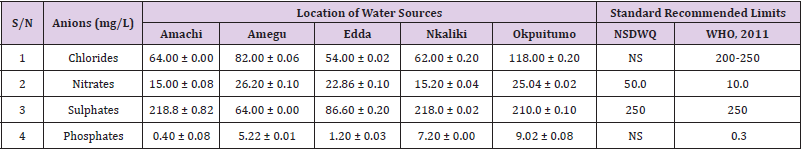
Table 35: Anion Content of Water Samples Collected from Streams in Different Locations of Abakaliki Local Government Area Compared with NSDWQ and WHO Recommended Limits.
Note: KEY: NS = Not Stated, NSDWQ = Nigerian Standard for Drinking Water Quality, WHO = World Health Organization.
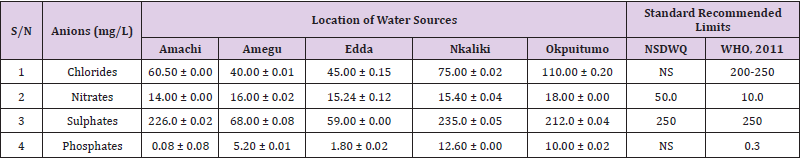
Table 36: Anion Content of Water Samples Collected from Wells in Different Locations of Abakaliki Local Government Area Compared with NSDWQ and WHO Recommended Limits.
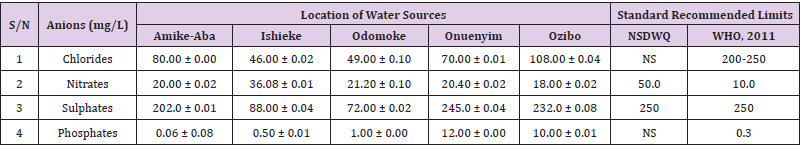
Table 37: Anion Content of Water Samples Collected from Boreholes in Different Locations of Ebonyi Local Government Area Compared with NSDWQ and WHO Recommended Limits.
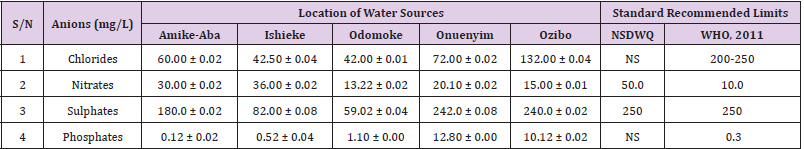
Table 38: Anion Content of Water Samples Collected from Ponds in Different Locations of Ebonyi Local Government Area Compared with NSDWQ and WHO Recommended Limits.
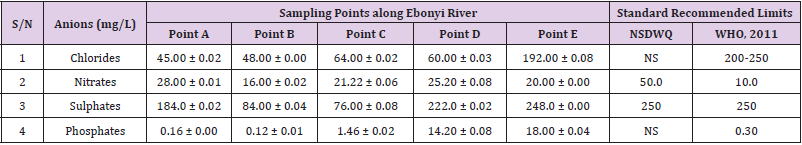
Table 39: Anion Content of Water Samples Collected from Different Sampling Points along Ebonyi River of Ebonyi Local Government Area Compared with NSDWQ and WHO Recommended Limits.
Note: KEY: NS = Not Stated, NSDWQ = Nigerian Standard for Drinking Water Quality, WHO = World Health Organization
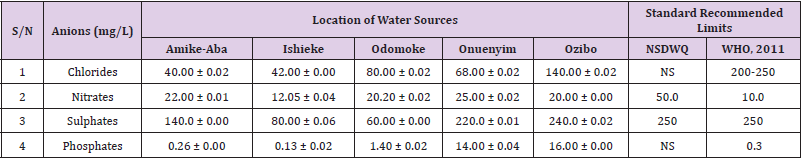
Table 40: Anion Content of Water Samples Collected from Streams in Different Locations of Ebonyi Local Government Area Compared with NSDWQ and WHO Recommended Limits.
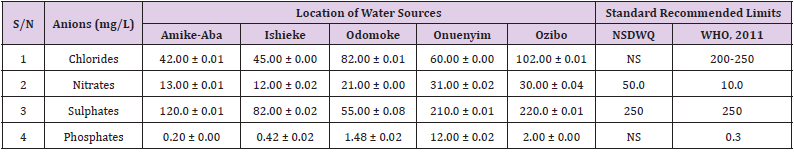
Table 41: MAnion Content of Water Samples Collected from Wells in Different Locations of Ebonyi Local Government Area Compared with NSDWQ and WHO Recommended Limits.
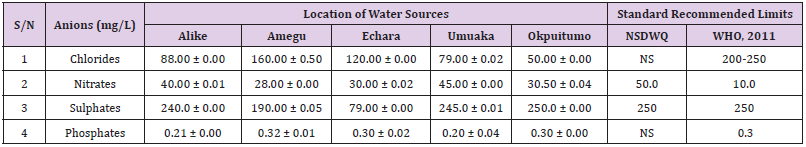
Table 42: Anion Content of Water Samples Collected from Boreholes in Different Locations of Ikwo Local Government Area Compared with NSDWQ and WHO Recommended Limits.
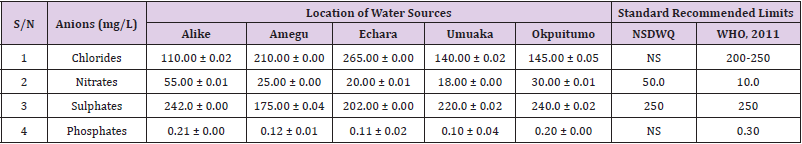
Table 43: Anion Content of Water Samples Collected from Ponds in Different Locations of Ikwo Local Government Area Compared with NSDWQ and WHO Recommended Limits.
Note: KEY: NS = Not Stated, NSDWQ = Nigerian Standard for Drinking Water Quality, WHO = World Health Organization
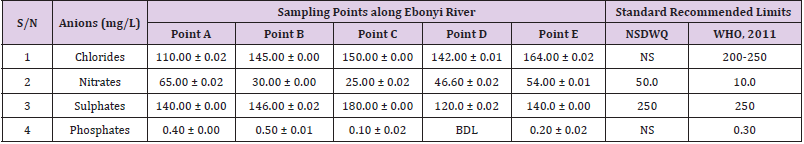
Table 44: Anion Content of Water Samples Collected from Ponds in Different Locations of Ikwo Local Government Area Compared with NSDWQ and WHO Recommended Limits.
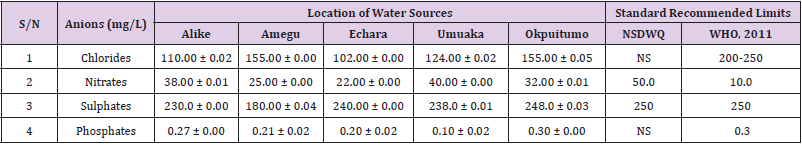
Table 45: Anion Content of Water Samples Collected from Streams in Different Locations of Ikwo Local Government Area Compared with NSDWQ and WHO Recommended Limits.
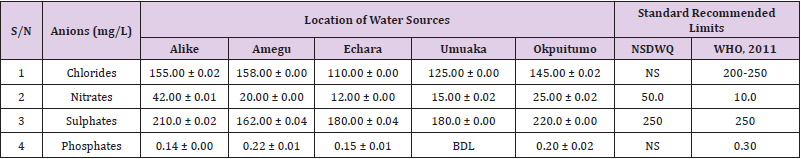
Table 46: Anion Content of Water Samples Collected from Wells in Different Locations of Ikwo Local Government Area Compared with NSDWQ and WHO Recommended Limits.
Note: KEY: NS = Not Stated, NSDWQ = Nigerian Standard for Drinking Water Quality, WHO = World Health Organization.
Discussion
Alkalinity was highest (368.50 ± 0.20mgL-1) in borehole water samples collected from Ebonyi local government area and lowest (140.60 ± 0.20mgL-1) in stream water collected from Ikwo local government area. The alkalinity of water samples from all the study locations showed no significant difference (p > 0.05) throughout the study period. The standard recommended limit of alkalinity in water is 200mgL-1 as given by nsdwq [28] and WHO [29]. The high alkalinity of water samples collected from Ebonyi local government area could be because of location of study, level of industrial activity, and variation in weather patterns. Water with high alkalinity could cause corrosion of metallic pipes thereby reducing the usable diameter. Highly alkaline water is foul-tasting, unpalatable and leads to scale formation [30]. The use of water with a high alkalinity level could lead to diseases like gastrointestinal illnesses such as stomach cramps, abdominal distress and diarrhea. The result of alkalinity in this study agrees with Nwali [31] which reported alkalinity values of 276.50mgL-1 and 22.50mgL-1 for water samples collected from Ope-ekwe and Ikwo-ihie respectively. Saeed and Mahmoud, [8] also reported alkalinity values ranging from 205 ± 5.6 to 850 ± 31.6mgL-1 in borehole water samples from Kano metropolis in Kano State. In another study, Shrestha and Basnet, (2018) reported an alkalinity level of 97.75 ± 54.09mgL-1 in river water samples. Sadiya et al. (2018) obtained a 119.42mgL- 1 alkalinity level in drinking water sources in Jabi District of the Federal Capital Territory, Abuja. Contrary to the result of high alkalinity obtained in this study, Shalom [1] reported low alkalinity levels ranging between 0.26 ± 0.15 to 14.20 ± 1.60mgL-1 in surface water points in Canaan land, Ota in Ogun State. Variations in results may be explained by the differences in hydro-geological regimes, weather patterns and likely contaminant entry point.
Biochemical oxygen demand level was highest in pond water samples from Ikwo having 13.36 ± 0.05mgL-1 and lowest in stream water from Ebonyi with 1.20 ± 0.12mgL-1. There was no significant difference (p > 0.05) in biochemical oxygen demand levels among the water samples at the different locations during the study period. The standard recommended limit of biochemical oxygen demand in water is 10 mgL-1 as given by nsdwq, [29] and 1.00 - 2.00mgL-1 by WHO [28]. High biochemical oxygen demand level in pond water samples from Ikwo could be because of a build-up of organic materials from decaying plant parts, human activities and animal litters. High biochemical oxygen demand in water is indicative of pollution and contamination. Water samples with the biochemical oxygen demand less than 4.00mg/L-1 are considered clean [32]. Michael [33] in a related research, reported an average biochemical oxygen demand level of 9.90 ± 4.78mgL-1 in Kogi State. Nwali et al. [31] reported that observed biochemical oxygen demand values in both fresh waters are 0.03mgL-1 (Ope-ekwe) and 30.50mgL-1 (Ikwo-ihie). In a recent study on water samples collected from three different locations (Abakaliki, Ohaukwu and Onicha local government area) in Ebonyi State, John [34] reported a mean biochemical oxygen demand of 1.00 ± 0.09mgL-1. Reuben [35] in their study reported a biochemical oxygen demand of 8.33 ± 0.830mgL-1 in water samples collected from Nasarawa State.
Chemical oxygen demand was highest (14.20 ± 0.05mgL-1) in well water samples from Ebonyi while borehole water samples from Abakaliki recorded the lowest (3.14 ± 0.95mgL-1). The standard recommended limit of chemical oxygen demand in water is 8 - 10mgL-1 as given by nsdwq [28] and 10mgL-1 by WHO [29]. There was a significant difference (p < 0.05) in the concentration of chemical oxygen demand among the water samples analyzed. Ndamitso et al. [36] in their study reported that chemical oxygen demand in water samples from Minna in Niger State ranged from 104.00 ± 2.00 to 206.53 ± 3.20mg/dm3. Michael et al. [33] reported an average chemical oxygen demand level of 8.6 ± 2.52mgL-1 in Kogi State. Nwali et al. [31] reported that chemical oxygen demand values for freshwater samples ranged from 0.03mgL-1 (Ope-ekwe) to 4.80mgL-1 (Ikwo-ihie). High levels of chemical oxygen demand are an indication of lack of oxygen and can result to death of aquatic organisms and poor growth of aquatic plants. If the chemical oxygen demand is higher than normal limits, it will contain greater number and greater diversity of microorganisms [37]. John [34] reported a chemical oxygen demand of 5.2 + 0.04mgL-1 which is within the values obtained in the present study.
Conductivity was highest (0.01 ± 0.12ms/L) in borehole water samples from Ebonyi while stream water samples from Abakaliki recorded the lowest (2.30 ± 0.40ms/L). The standard recommended limit of conductivity in water is 1ms/L as given by nsdwq [28] and 0.25ms/L by WHO [39]. The conductivity of water samples analyzed showed no significant difference (p < 0.05). This correlates with the report of Yasin et al. [40] which reported a mean conductivity value ranging from 30.77 to 727.67μS/cm. Related results were reported from well water samples where the conductivity levels ranged from 22 to 315 μS/cm [40]. In another research, Michael et al. [31] reported an average conductivity value of 0.16 ± 84.68ms/L in water samples collected in Ankpa urban area of Kogi State. Rahmanian et al. [41] showed that the measured conductivity of all water samples ranged from 69.70μS/cm to 269.30μS/cm in drinking water in suspected parts of Perak state, Malaysia. Njoku and Ngene [42] reported a conductivity in the range of 52.33 ± 0.20 to 114.30 ± 0.21μs/cm in their study on water from Ebonyi river. Ani et al. [43] reported a mean conductivity value of 88.00 ± 7.33μs/cm in water samples collected in Ebonyi State. A higher conductivity value (1.31 ± 0.00) was reported by Igwenyi, [44] in water samples collected from Ikwo local government area. Nwali had reported that the conductivity values of 510.32mgL-1 and 166.72mgL-1 for Opeekwe and Ikwo-ihie respectively which is far higher than our result. Differences in water conductivity could be because of varying climatic factors, high use of agrochemicals, vegetative factors and the general make-up of the water. The conductivity of water increases as the concentrations of ions in water bodies increases. Malla et al. [45] opined that conductivity can be of importance in the measurement of the ionic condition of water which is greatly affected by temperature, concentration of impurities, and mobility of ions. Water samples with high conductivity increases corrosive nature of water [46].
Dissolved oxygen was highest (7.50 ± 0.20mgL-1) in well water samples from Ikwo while Ebonyi river water samples from Abakaliki recorded the lowest (0.02 ± 1.11mgL-1). There was no significant difference (p > 0.05) in dissolved oxygen concentrations among the water samples. The standard recommended limit of dissolved oxygen in water is 7.50mgL-1 as given by nsdwq [28] and 1.00 - 2.00mgL-1 by WHO [39]. The level of dissolved oxygen observed in well water samples from Ikwo met the WHO [29] recommended limit which explains the ability of the water to support aquatic life processes and acceptable aesthetic taste as supported by Sumathi and Manonmani [47]. Dissolved oxygen is known to affect such attributes as growth, survival, distribution, behavior and physiology of aquatic organism. Yasin et al. [39] reported a mean dissolved oxygen values ranging between 3.53 and 5.90mgL-1 in drinking water of different sources in Jimma zone, Southwest Ethiopia. Odikamnoro et al. [48] reported a dissolved oxygen value of 4.00 ± 0.01mgL-1 in borehole water samples from Abakaliki capital city. Purushottam et al. [49] also reported dissolved oxygen values ranging from 1.2 to 4.6mg/l from different lake water samples. Shrestha and Basnet [30] reported a dissolved oxygen value of 6.67mgL-1. Nwali et al. [31] in their study reported a dissolved oxygen value of 12.51mg/L-1 and 12.77mg/L-1 for Ope-ekwe and Ikwo-ihie respectively. A higher dissolved oxygen concentration (9.08 ± 1.54mg/L-1) was reported by Reuben et al. [35]. All the water samples collected from boreholes in all the different study locations were odourless. Some of the water samples collected from other samples sources (ponds, streams and wells) were odourless as well while all the water samples collected from rivers had odour. The nsdwq [28] and WHO [29] recommends that drinking water must be odourless. In support to the result of this study, Odikamnoro et al. [48] reported that borehole water samples from Abakaliki the capital city was odourless. Water samples with bad odour is unpleasant and harmful to the body. It is usually a breeding ground for different pathogenic organisms and when used by humans and animals’ results to a wide array of health hazards.
pH was highest (7.83 ± 0.40) in well water samples from Ebonyi while borehole water samples from Abakaliki recorded the lowest (5.80 ± 0.00). There was no significant difference (p > 0.05) in pH values among the water samples. The standard recommended limit of pH in water is 6.0 - 9.0 as given by nsdwq [28] and 6.50 - 8.50 by WHO [29]. Differences in pH can be attributed to changes in human and non-human processes such as photosynthesis, respiration, temperature exposure to air, disposal of industrial wastes, geology and mineral content of a catchment area, acid mine drainage, agricultural runoff, carbon dioxide concentration in the atmosphere, and accumulation and decomposition of organic detritus in the water producing weak carbonic acids [50]. Majority of the water samples in this study had a pH within the recommended limits of NSDWQ and WHO for human use. This finding is in agreement with the earlier report of Shittu et al. [51], where all the four samples of water examined, agreed with WHO recommended limit for drinking water. With the pH of water samples within acceptable limits, the water may pose no serious health risk to consumers who use the water for agricultural, recreational and domestic uses and so is acceptable. However, it must be noted that borehole samples from Abakaliki needs some treatment as it fell below the acceptable range. A higher pH (9.40 ± 0.00) was reported by Igwenyi [52] in water samples collected from Ikwo local government area. The use of water with a high pH could have adverse effects on the digestive and lymphatic systems of human [1]. In conformity to our results, Odikamnoro et al. [48] reported a pH value of 7.67 ± 0.06mgL-1 in borehole water samples from Abakaliki capital city. Michael et al. [33] reported a ph value of 7.50 ± 0.22 in water samples collected in Ankpa urban area of Kogi State. John [34] reported a mean pH of 8.10 ± 0.10. Reuben et al. [35] in their study reported a pH between 6.19 ± 0.06 - 6.28 ± 0.07 in water samples collected from Nasarawa State.
Salinity was highest (221.20±0.20%) in pond water samples from Ikwo while pond water samples from Abakaliki recorded the lowest (91.59±0.50%). The salinity of water samples from all the study locations showed no significant difference (p >0.05) during the study period. The standard recommended limit of salinity in water is 200% as given by nsdwq [28] and 100 - 200 % by WHO. It is old knowledge that Ebonyi State is blessed with an abundance of salt which earned her the name “Salt of the Nation”. Salinity is an ecological factor of considerable importance, influencing the types of organisms that live in a body of water [28] the consumption of raw water with high salts result to nauseous, saline taste with purgative tendency and dehydration which affects the normal function of body tissues and especially limits the function of the kidney. Prolonged consumption of water with a high salinity concentration results to hypertension. Aside from human intoxication, it may affect the dissolved oxygen level of water as fresh water holds more oxygen than salt water. In agreement to the results of this study, Shalom et al. [1] reported salinity levels ranging between 14.55±1.15 to 162.50±4.5 mgL-1 in surface water points in Ogun State. All the water samples tasted salty. The nsdwq [28] and WHO [29] recommends that drinking water must be tasteless. In agreement to our results, Odikamnoro et al. [48] reported that borehole water samples from Abakaliki capital city all tasted salty. The salty taste of water in the study locations calls for appropriate treatment to remove or reduce the saltiness.
Temperature was highest (29.00 ± 1.50 0C) in river water samples from Abakaliki while stream water samples from Abakaliki recorded the lowest (20.01 ± 1.50 0C). The standard recommended limit of temperature in water is 20 – 30 0C as given by nsdwq and 28 - 30 0C by WHO. There was a significant difference (p < 0.05) in the temperature of water samples collected from the sample locations.
The high temperature values obtained in Abakaliki could be because of agricultural, developmental and industrial activities going on in many areas of Abakaliki local government area especially in the capital territory. Bacteria grow faster at higher temperature than at lower temperature. High levels of nutrient also influence the growth rate of bacteria [53]. The disparity in temperature observed across the locations studied may be due to variations in ambient temperature at the time of sampling and analysis [54]. In a related study, Reuben et al. [31] obtained a temperature ranging from 24.80 to 27.000C. Raji et al. [55] and Olorode et al. [56] reported the temperature range of 25.30 to 29.200C from River Sokoto, and 25.00 to 28.000C from five different Rivers in Port Harcourt respectively. Njoku and Ngene, (2015) reported a temperature in the range of 28.67 ± 0.15 to 31.77 ± 0190C in their study on water from Ebonyi river. In the same line of study, Olaniyan et al. [57] obtained a mean temperature in the range of 23.40 to 26.00°C Nwali et al. [32] in their study reported a temperature of 25.46 ± 1.270c and 25.73 ± 0.020c in water samples from fresh water bodies. In Abakaliki local government area John [33] reported a mean temperature of 32.00 ± 0.100C. Also, Agbazue et al. [58] and Aliyu et al. [59] reported the temperature range of 28.52 ± 1.12 to 28.27 ± 1.290C from Oro-Obor and Ayo Rivers in Enugu South, Enugu State, Nigeria and 27.70 ± 0.76 to 27.95 ± 0.680C from four sampling stations of Udu River, Warri, Nigeria.
Total dissolved solid was highest (750.00±1.80mgL-1) in borehole water samples from Ikwo while river water samples from Ikwo recorded the lowest (89.11±0.50mgL-1). There was a significant difference (p < 0.05) in the total dissolved solid of water samples during the study period. The standard recommended limit of total dissolved solid in water is 600mgL-1 as given by nsdwq [28] and 500mgL-1 by WHO. These values of total dissolved solids in this study were comparable with the result obtained by Iroha et al. [60] which reported a mean total dissolved solid value ranging from 89.4±5.50 to 774±1.30mg/L-1. Nwali et al. [31] in the same vein reported total dissolved solids of 317.25mg/L-1 (Ope-ekwe) and 353.25mg/L-1 (Ikwo-ihie) in their study. A total dissolved solid as low as 3.90±1.50mgL-1 was obtained by Michael et al. [34] in Kogi State. In water samples from Abakaliki local government area, John reported a mean total dissolved solid of 610.03±0.08mg/L-1. Reuben et al. [32] in their study, reported a total dissolved solid level of 38.38±8.240mg/L-1. Total dissolved solids affect the taste and acceptability of drinking water if present at levels beyond recommended limits. Accordingly, the total dissolved solid values recorded in this study could be considered intolerable. The use of water with a high total dissolved solid as obtained in this study could result to the deposit of unwanted dissolved minerals in the body or on agricultural fields after evaporation. High total dissolved solid waters interfere with the clarity, colour and taste of water, thereby indicating the presence of toxic minerals and microorganisms of health importance in the water [61].
Total hardness was highest (262.30 ± 0.10 mgL-1) in borehole water samples from Ikwo while stream water samples from Ikwo recorded the lowest (72.80 ± 0.00 mgL-1). There was a significant difference (p < 0.05) in the total hardness of the water samples analyzed. The standard recommended limit of total hardness in water is 150 mgL-1 as given by nsdwq and 100 - 250 mgL-1 by WHO. High total hardness is due to the concentration of calcium and magnesium ions which are the principal cations impacting hardness. Reuben et al. [38] in their study reported a total hardness of 375.50 ± 83.53 mgL-1in water samples collected from Nasarawa State. John [33] reported a mean total hardness of 230.01 ± 0.15 mg/L-1 in water samples from Onicha local government area. Water with a high level of hardness could cause serious problems in domestic, agricultural and industrial settings [62]. To reduce the total hardness of water, certain processes such as water softening can help. With softening, the adverse effects of hard water can be reduced significantly [63].
Total organic carbon was highest (5.50 ± 0.60 mgL-1) in stream water samples from Ebonyi while pond water samples from Ebonyi recorded the lowest (0.64 ± 1.50 mgL-1). There was no significant difference (p > 0.05) in total organic carbon during the study period. The standard recommended limit of total organic carbon in water is between 4.00 - 5.00 mg/L-1 as given by nsdwq. Increased total organic carbon concentration could be due to the increase of dissolved organic substances in the water, this condition can be detrimental to fish production and other aquatic life forms [46]. High TOC in water can confirm the presence of potentially harmful organic chemicals in water used to manufacture pharmaceutical products [64]. Total suspended solid was highest (485.90 ± 0.20 mgL-1) in stream water samples from Ebonyi while pond water samples from Ikwo recorded the lowest (152.10 ± 1.20 mgL-1). There was a significant difference (p < 0.05) in the level of total suspended solids during the study period. The standard recommended limit of total suspended solid in water is 500 as given by nsdwq. Hence, the total suspended solid was not above standard limit and so acceptable. Harrison [65] reported that higher total dissolved solids reduces water clarity, which could contribute to reduced photosynthetic activities and possibly lead to an increase in water temperature. It plays major roles in pathogen transmissions. There is a big relationship between the disease-causing microbes and parasites and high level of total suspended solids [66]. Shittu et al. (2008) recorded low values of total suspended solids from four water bodies studied. Igwenyi [52] reported a total suspended solid of 310.00 ± 0.00 ppm in water samples collected from Ikwo local government area. Nwidembia et al. [67] obtained a total suspended solid of 837.08 ± 0.03 mgL-1 in pond water samples.
Turbidity was highest (11.40 ± 0.81 NTU) in Ebonyi river water samples from Ebonyi while well water samples from Abakaliki recorded the lowest (3.38 ± 0.98 NTU). The standard recommended limit of turbidity in water is 5.00 NTU as given by nsdwq and 5.00 - 10.00 NTU by WHO. The turbidity profile of the examined water samples did not vary significantly (p < 0.05) amongst the water bodies throughout the study period. The level of turbidity obtained in this study is lower than 3.9 ± 1.54 NTU obtained by Michael et al. [34] in Kogi State. Reuben et al. (2018) obtained higher turbidity (20.89 ± 6.23 NTU) in their analysis of river water collected from Nasarawa State. The turbidity levels of the water sources suggests that they contain high suspended materials, bacteria, planktons, dissolved organic and inorganic materials [68]. Water samples with high turbidity has a cloudy appearance and is usually not acceptable for drinking purposes unless when treated. A higher value of turbidity reduces the aquatic vegetation and subsequently reduces the food sources for many aquatic animals [69]. This situation can also interfere with disinfection and provides a medium for microbial growth that causes symptoms such as nausea, cramps, diarrhea, and associated headaches [70]. John reported a mean turbidity of 6.00 ± 0.08 mg/L-1 in water samples from Abakaliki local government area. Bisi-Johnson et al. [71] reported that suspended particles act as a substrate for microorganisms in the water, thus promoting growth of the microbial populations. Hence, the more turbid water is the greater the chances of water borne diseases.
Aluminum was highest (0.22 ± 0.02 mgL-1) in well water samples from Ikwo while pond water samples from Abakaliki recorded the lowest (0.01 ± 0.00 mgL-1). The standard recommended limit of aluminum in water is 0.20 mgL-1 as given by nsdwq [28] and WHO. There was a significant difference (p < 0.05) in the aluminum concentration of water samples during the study period. In his study, John [33] reported a mean aluminum content of 0.04 ± 0.00 mg/L-1 in water samples from Abakaliki local government area. High aluminum concentration in water can lead to vitamin D-resistant osteomalacia, central nervous system alterations and erythropoietin-resistant microcytic anemia. In very high doses, aluminum is associated with altered function of the blood–brain barrier [72]. People with kidney insufficiency are especially at a risk. Hence, drinking any of the boreholes without treatment are at risk of Alzheimer’s disease [73,74]. Aluminium increases estrogenrelated gene expression in human breast cancer cells cultured in the laboratory. In very high doses, aluminium is associated with altered function of the blood–brain barrier. A small percentage of people have contact allergies to aluminium and experience itchy red rashes, headache, muscle pain, joint pain, poor memory, insomnia, depression, asthma, irritable bowel syndrome, or other symptoms upon contact with products containing aluminium [72].
Arsenic was highest (0.06 ± 0.01 mgL-1) in borehole water samples from Ikwo while well water samples from Ikwo recorded the lowest (0.01 ± 0.01 mgL-1). There was a significant difference (p < 0.05) in the concentration of arsenic throughout the study period. The standard recommended limit of arsenic in water is 0.05 mgL-1 as given by nsdwq and 0.01 mgL-1 by WHO. Although the arsenic content of water was within the NSDWQ limit, it was above the recommended limits of WHO, 2011. The occurrence of arsenic in water could be as a result of local mining activities in nearby environment which releases heavy metals into surrounding water bodies under study. Arsenic occurs in water due to mineral dissolution, industrial wastes or the application of pesticides and insecticides [1]. It can also be released into the environment through bush burning, volcanic erosion and weathering of rocks. It is present in dyes, paints, soap and drugs [75]. Arsenic concentrations as high as 2.50 ± 0.01 mgL-1 was reported by Nnabo [76] in water samples collected from Enyigba, Ebonyi State. It has been reported that the combustion of fossil fuels particularly coal, introduces large quantities of arsenic into the water bodies [1]. Other possible sources of arsenic in water include contaminated foods or medications. Industrial sources are ore melting/refining/ processing plants, galvanizing, etching and plating processes. Arsenic accumulates in the body and low intake for prolong period may result in arsenic poison (Sharma, 2011). Drinking water that contains arsenic at high concentrations for many years may be linked to a variety of health problems like constriction of the throat, difficulty in swallowing; garlic taste, severe thirst; severe intestinal pain, vomiting, diarrhea, muscle cramps, cardiac arrhythmias, coma and death eventually.
Cadmium was highest (0.40 ± 0.00 mgL-1) in borehole water samples from Ebonyi while borehole water samples from Abakaliki recorded the lowest (0.02 ± 0.00 mgL-1). There was a significant difference (p < 0.05) in the concentration of cadmium. The standard recommended limit of cadmium in water is 0.003 mgL-1 as given by WHO. This shows that water samples in the study locations contains high and unacceptable amounts of cadmium. Similar results were revealed by Michael et al. [33] who reported a mean cadmium concentration of 0.001 mgL-1 in Kogi State. Nnabo [76] in his study reported very high concentration of cadmium (6.03± 0.00 mgL-1) in water samples from Enyigba. Cadmium is a natural constituent of surface and groundwater. John [33] reported a mean cadmium content of 0.03 ± 0.01 mg/L-1 in water samples from Ohaukwu local government area. It enters aquatic systems through weathering and erosion of bedrocks and soils. Much of the cadmium entering fresh waters may be rapidly adsorbed by sediments which are significant sinks for cadmium emitted to the aquatic environment [39]. Cadmium find their way into the water through industrial and agricultural discharges. Exposure to high levels of cadmium produces deleterious effects on the cellular architecture and metabolism in a variety of body tissues, including testis, liver and pancreas, kidneys and bone [77-79].
Calcium was highest (68.00 ± 0.00 mgL-1) in borehole water samples from Ikwo while stream water samples from Abakaliki recorded the lowest (20.00 ± 0.02 mgL-1). There was a significant difference (p < 0.05) in the concentration of calcium in the water samples. The standard recommended limit of calcium in water is 65 – 70 mgL-1 as given by nsdwq and 75 mgL-1 by WHO. The high levels of calcium in water could be as a result of weathering of rocks, human activities and sediments in water. John in his study, reported a mean calcium concentration of 52.80 ± 0.08 mg/L-1 in water samples from Abakaliki local government area. A lower calcium content (11.70 ± 3.77 mgL-1) was obtained by Michael et al. [33] in Kogi State. Calcium is essential for living organisms particularly in cell physiology, bone formation and other cellular processes [80]. Water samples with a high concentration of calcium is a nuisance because of mineral build up on fixtures and poor soap and/or detergent performance [81]. Several epidemiological investigations have demonstrated the relation between risk for cardiovascular disease, growth retardation, reproductive failure, and other health problems and hardness of drinking water or its content of magnesium and calcium (Hui-Fen, 1999). Studies conducted in several animal models of hypertension have also been consistent in demonstrating a hypotensive effect of calcium supplementation [82]. Other studies correlate domestic hard water usage with increased eczema in children [62,63].
Chromium was highest (0.09 ± 0.00 mgL-1) in pond water samples from Abakaliki while well water samples from Abakaliki recorded the lowest (0.01 ± 0.00 mgL-1). The concentrations of chromium in water samples from all the study locations showed no significant difference (p > 0.05) among the water samples during the study period. The standard recommended limit of chromium in water is 0.05 mgL-1 as given by nsdwq, (2007) and WHO. In water, chromium exists as the hydroxides and complexes although its concentration depends on the type of water [83]. Ndamitso et al. reported that the chromium contents of the water samples analysed in their study ranged from 0.01 ± 0.00 to 0.04 ± 0.01 mg/ dm3. In their study, Sa’eed and Mahmoud, [8] also reported a mean and standard deviation value chromium of 0.065 ± 0.095 mgL-1 in borehole water samples from Kano metropolis in Kano State. Also, John [32] reported a mean chromium concentration of 0.07 ± 0.01 mg/L-1 in water samples from Abakaliki local government area. Chromium potentiates insulin sensitivity and insulin-dependent signaling [84]. In addition, chromium inhibits phosphotyrosine phosphatase, which decreases insulin sensitivity [85]. Chromium toxicity causes chlorosis and necrosis in plants and can pose serious poisonous effects on humans [86]. Drinking hard water and eating food cooked with stainless steel utensils increases the chromium content of food materials [1]. Chromium is highly toxic nonessential element for microorganism and plants [87]. The source of chromium in environment are both natural and anthropogenic, natural source include burning of oil and coal, petroleum from ferro chromate refractory material, chromium steels, pigments oxidants, catalyst and chemical fertilizers [88]. Chromium has its effect on certain enzymes such as catalase, peroxidase, a cytochrome oxidase, which have iron as constituent.
Copper was highest (0.80 ± 0.00 mgL-1) in river water samples from Ebonyi while stream water samples from Abakaliki recorded the lowest (0.20 ± 0.01 mgL-1). There was a significant difference (p < 0.05) in the concentration of copper in the water samples. The range of copper observed in this study was below the standard recommended limit of 1.00 – 2.00 mgL-1 as given by WHO. Ndamitso reported that copper content in their study ranged from 0.04 ± 0.01 (FUTMin) to 1.48 ± 0.10 (Sabo Best) mg/dm3. Reuben et al. [33] obtained a mean copper concentration of 0.01 ± 0.002 mg/L-1, which is lower than our result. Copper is an essential element for living organisms including human and in small amount necessary in our diet to ensure good health. This is an important micronutrient associated with many metalloenzymes especially cytochrome-c oxidase. Cytochrome-c oxidase plays an essential role in oxidative metabolism. Dissolved copper sometimes imparts a light blue or blue-green colour and an unpleasant metallic, bitter taste to drinking water [89]. It is a potential health hazard that causes various health problems when people are exposed to it at levels above the permissible value. Short periods of exposure can cause gastrointestinal disturbance, including nausea, diarrhea, dizziness and vomiting while use of water whose copper level exceeds the maximum value over many years causes liver or kidney damage [90-92]. Excessive intake of copper causes wide spread capillary damage, gastrointestinal irritation and damages to surrounding tissues [93].
Iron was highest (0.88 ± 0.00 mgL-1) in river water samples from Abakaliki while stream water samples from Ikwo recorded the lowest (0.20 ± 0.00 mgL-1). There was a significant difference (p < 0.05) in the concentration of iron in the water samples. The standard recommended limit of iron in water is 0.30 mgL-1 as given by nsdwq [28]. The detection of iron in water is an indication of possible contamination from geology of the water channel, rock mineral types present and waste inflows. High concentration of iron in water can lead to the formation of blue baby syndrome in babies and goitre in adults [93]. This implies that the consumption of water containing high iron concentration will have negative health implications as iron overload is associated with polycythemia. Ndamitso reported that the iron concentration of the water samples in their study ranged from 0.24 ± 0.01 to 1.63 ± 0.10 mg/dm3. Igwenyi [52] reported an iron concentration of 0.211 ± 0.001 μg/ ml in water samples from Ikwo. A higher iron content (0.10 ± 0.11 mgL-1) was obtained by Michael et al. [34] in Kogi State. High level of iron as was observed in this study is in tandem with the study carried out on surface water of Bompai-Jakara drainage basin, Kano State, Nigeria by Imam [94]. High iron concentration in water gives a metallic taste and an offensive scent.
Lead was highest (0.19 ± 0.02 mgL-1) in stream water samples from Abakaliki while borehole water samples from Ikwo recorded the lowest (0.02 ± 0.00 mgL-1). There was a significant difference (p < 0.05) in the concentration of lead in the water samples. The standard recommended limit of lead in water is 0.01 mgL-1 as given by nsdwq and WHO. Lead is the most prevalent heavy metal contaminant. It finds their way into water bodies from a number of industrial and mining sources as observed in many areas of the study locations. Lead is well known for being poisonous for mammals and there are fears that human body burdens below those at which clinical symptoms of lead toxicity appear may cause mental impairment in young children [95]. Lead is considered to be particularly harmful for women’s ability to reproduce. Lead concentration is still increasing in some parts of the world such as Nigeria where there has reported cases of lead poisoning in Zamfara and Niger States which claimed the lives of over 500 persons. It is particularly a dangerous metal, as it can accumulate in individual organisms and also in entire food chains (Nnabo, 2015). Lead has been implicated in the ethiology of functional diseases such as cramps, irritability, fatigue, vomiting, constipation, sleep disorder, poor appetite, microcytic anaemia, inhibitory effects on deltaaminolevulinic acid dehydratase [96] and in neurological damage in young children [97]. Natural waters (streams, ponds, rivers, wells) usually contain up to 0.02 mgL-1, however in some cases they have reported as high as 0.4 mgL-1 [1]. These water bodies are sources of our public water supply, and once they are polluted at the source, every other public water supply is contaminated and poses a major risk to the consumers if not well treated. Oluwande et al. [98] observed that human activities such as mining, industries and natural ways such as leaching and erosion of soils by rainfall push or move these heavy metals down the water bodies. Nnabo, (2015) reported an average lead content of 0.23 mg/L-1 in surface water. Reuben et al. [33] obtained a mean lead concentration of 0.03 ± 0.02 mg/L-1, which is higher than our report. A lower lead concentration (0.01 ± 0.81 mgL-1) was obtained by Michael et al. [34] in Kogi State.
Magnesium was highest (19.00 ± 0.02 mgL-1) in river water samples from Abakaliki while stream water samples from Ikwo recorded the lowest (0.22 ± 0.00 mgL-1). The concentrations of magnesium in water samples from all the study locations showed no significant difference (p > 0.05) among the water samples during the study period. The standard recommended limit of magnesium in water is 0.20 mgL-1 as given by nsdwq and 50 mgL-1 by WHO. Magnesium ions are essential to the basic nucleic acid chemistry of life, and thus are essential to all cells of all known living organisms. Over 300 enzymes require the presence of magnesium ions for their catalytic action, including all enzymes utilizing or synthesizing ATP, or those that use other nucleotides to synthesize DNA and RNA [99]. However, too much magnesium can cause several serious health problems, including nausea, vomiting, severely lowered blood pressure, confusion, slowed heart rate, respiratory paralysis, coma, cardiac arrhythmia, cardiac arrest, and eventually death. Excess magnesium in the blood is freely filtered at the kidneys, and for this reason it is difficult to overdose on magnesium from dietary sources alone [100].The most common side effects of magnesium toxicity are stomach upset and diarrhea [101]. Igwenyi reported a magnesium concentration of 0.274 ± 0.002 μg/ml which is lower than our result. John [33] reported a magnesium concentration of 16.90 ± 0.21 mgL-1 which falls within the range of values obtained in this study.
Manganese was highest (0.06 ± 0.00 mgL-1) in pond water samples from Abakaliki while well water samples from Abakaliki recorded the lowest (0.01 ± 0.02 mgL-1). The concentration of manganese in water samples from all the study locations showed no significant difference (p >0.05) among the water samples during the study period. The standard recommended limit of manganese in water is 0.05 mgL-1 as given by WHO. Manganese is more prevalent in ground water supplies than in surface water supplies owing to the reducing condition that exist underground [102]. In his study, John [33] reported a manganese concentration of 0.04 ± 0.01 mgL-1 which is within the range of values obtained in this study. According to results from a 2010 study, higher levels of exposure to manganese in drinking water are associated with increased intellectual impairment and reduced intelligence quotients in school-age children [103]. Waterborne manganese has a greater bioavailability than dietary manganese. It is hypothesized that long-term exposure due to inhaling the naturally occurring manganese in shower water puts up to 8.7 million Americans at risk [104]. The high content of manganese as obtained in this study means that continuous use of water with high manganese may trigger diseases like cancer, diabetes, heart disease, and damage to the central nervous system [105].
Mercury was highest (0.35 ± 0.00 mgL-1) in pond water samples from Ebonyi while borehole water samples from Ebonyi recorded the lowest (0.01 ± 0.00 mgL-1). The concentrations of mercury in water samples from all the study locations showed no significant difference (p >0.05) among the water samples during the study period. The standard recommended limit of mercury in water is 0.001 mgL-1 as given by nsdwq [28]. A mercury concentration of 0.010 ± 0.01 mgL-1 was reported in drinking water sources in Ivo Local Government Area of Ebonyi State by Nzubechukwu et al. [106]. Inhalation of mercury causes tremors, lungs and brain damages [105]. Increased levels of mercury in water can lead to mercury poisoning leading to diseases like acrodynia or Pink disease. Mercury concentration in the surrounding environment should be monitored by government regulatory agency because of its toxicity to the brain, heart, kidneys, lungs and immune system of all ages [107].
Potassium was highest (11.00 ± 0.00 mgL-1) in river water samples from Ikwo while borehole water samples from Abakaliki recorded the lowest (1.20 ± 0.00 mgL-1). The concentrations of potassium showed no significant difference (p > 0.05) among the water samples during the course of the study. The standard recommended limit of potassium in water is 30 mgL-1 as given by WHO. In their study, Sa’eed and Mahmoud reported that potassium recorded a mean and standard deviation value of 6.70 ± 0.24 mgL- 1 in borehole water samples from Kano metropolis in Kano State. In agreement with the range of values obtained for potassium in the present study, John in his study reported a potassium concentration of 4.82 ± 0.00 mgL-1. Potassium is the major positive ion or cation found in a human body and is essential for normal functioning of body cells. It also plays a major role in proper digestion, transmission of nerve impulses, regulation of heartbeats and muscle contraction. Potassium is important for the normal functioning of kidneys and heart. Sodium was highest (7.40 ± 0.02 mgL-1) in borehole water samples from Ikwo while river water samples from Abakaliki recorded the lowest (2.20 ± 0.01 mgL-1). The concentrations of sodium showed no significant difference (p >0.05) during the study period. The standard recommended limit of sodium in water is 100 – 200 mgL-1 as given by nsdwq. In their study, Sa’eed and Mahmoud reported that sodium recorded a mean and standard deviation value of 11.20 ± 0.00 mgL-1 in borehole water samples from Kano metropolis in Kano State. In his study, John reported a sodium concentration of 9.02 ± 0.02 mgL-1 which is within the range of values obtained in this study. Sodium helps keep the water (the amount of fluid inside and outside the body’s cells) and electrolyte balance of the body.
Zinc was highest (2.86 ± 0.00 mgL-1) in pond water samples from Ikwo while pond water samples from Abakaliki recorded the lowest (0.55 ± 0.00 mgL-1). No significant difference (p >0.05) was observed in the concentrations of zinc in water samples from all the study locations. The standard recommended limit of zinc in water is 3.0 mgL-1 as given by nsdwq and 5.0 mgL-1 by WHO. In their study, Ndamitso reported that zinc contents of water samples analyzed ranged from 0.28 ± 0.01 (Happy Days) to 2.41 ± 0.10 mgdm-3 (Evershine). In agreement with the results of this study; Nnabo reported an average zinc content of 3.53 mg/L-1 in surface water. Samuel et al. [108] reported an average zinc content of 0.034 ± 0.001 mgL-1 in a study which assessed levels of heavy metals in drinking water sources in two small-scale mining communities (Nangodi and Tinga) in northern Ghana. Reuben et al. [33] obtained a mean zinc concentration of 0.03 ± 0.017 mg/L-1, which is lower than our result. Zinc is a major component of insulin and is essential in the formation of proteins. It helps in the regulation of vitamin A concentration in the blood. High concentrations of zinc can cause a bitter, undesirable astringent taste and forms an opalescent and greasy film especially when boiled [109]. The presence of these trace metals in excess indicates danger and drinking such water without treatment may lead to liver and kidney damages, asthma and permanent disability.
Chlorides was highest (265.00 ± 0.00 mg/L) in pond water samples from Ikwo while well water samples from Abakaliki recorded the lowest (40.00 ± 0.01 mg/L). The concentrations of chloride in water samples from all the study locations showed a significant difference (p < 0.05) among the water samples during the study period. The standard recommended limit of chloride in water is 200 - 250 mg/L as given by WHO. Chloride is an indispensable electrolyte, trafficking in and out of cells through chloride channels and playing a key role in maintaining cell homeostasis and transmitting action potentials in neurons [110]. Chloride is a dominant anion in water and is essential for life. Its excessive amount can constitute a health hazard [111]. Nwali et al. [31] reported that observed chloride values in both fresh waters are 10.62 mgL-1 (Ope-ekwe) and 14.35 mgL-1 (Ikwoihie) which falls below the result of the present study. John [33] in their study reported a chloride concentration of 101.01 ± 0.09 mgL-1 in water samples collected from Onicha which is within the range of values obtained in this study. Chloride can impede plant growth, slow reproduction and reduce the diversity of aquatic life. Excessive chloride concentration increases rates of corrosion of metals and can cause hypertension and increased concentration of other metals in water. High level of chloride ions may result in an objectionably salty taste [111].
Nitrates was highest (65.00 ± 0.02 mg/L) in river water samples from Ikwo while borehole water samples from Abakaliki recorded the lowest (11.86 ± 0.16 mg/L). There was a significant difference (p < 0.05) in nitrates among the water samples. The standard recommended limit of nitrates in water is 50.0 mg/L as given by nsdwq and 10.0 mg/L by WHO. The constant use of organic fertilizer is responsible for the heightened levels of nitrates as observed in Ikwo in this study. The somewhat high concentrations of nitrate in the water may be as a result of extensive farming activities taking place at the bank of these rivers with the possibility of the farmers making use of fertilisers which can easily be washed into the rivers. High nitrate content in the presence of microbial contamination can lead to cyanosis disease or “blue baby syndrome” in bottlefed infants. Nevertheless, the high nitrate content as obtained in this study will be advantageous to agriculturists since it is a source of the organic nitrogen content of plant proteins. The high level of nitrates obtained in this study authenticates the results of Igwenyi which reported a high concentration (248.00 ± 0.984 μg) of nitrates in water samples collected from Ikwo. Contrary to the value of nitrates obtained in this study, Michael et al. [34] reported a low nitrate concentration of 0.58 ± 0.6 mg/L in Kogi State. Nitrate concentration as high as 341.00 ± 1.87 μg/ 100 m was reported by Igwenyi and Aja-Okorie in water samples collected from Ohaozara, Ebonyi State. Nwali reported nitrate values in water samples collected were 70.14 mgL-1 (Ope-ekwe) and 84.15 mgL-1 (Ikwoihie) which exceeds the highest value obtained in the present study. A study by Adekunle et al. [112] of groundwater quality in a typical rural settlement in Southwest Nigeria showed that Nitrate levels in some borehole water exceeded the WHO permissible limits of 10 mgL-1.
Sulphate was highest (275.0 ± 0.12 mg/L) in borehole water samples from Abakaliki while pond water samples from Ebonyi recorded the lowest (59.02 ± 0.04 mg/L). There was a significant difference (p < 0.05) in sulphate concentration. The standard recommended limit of sulphate in water is 250 mg/L as given by nsdwq [28] and WHO [39]. Sulphate is one of the major dissolved compounds of rain. It occurs naturally in water as a result of leaching from gypsum and other common minerals [113]. In 2010, Adefemi and Awokunmi revealed the concentration of sulphate found in Itaogbolu River in Ondo state to be 300 milligram per litre. Excess sulphate in water, imposes danger to health. Similar to the result obtained in this study, Igwenyi reported a high sulphate concentration (3.685 ± 0.010 μg/100 ml) in water samples collected from Ikwo local government area. Michael et al. [34] obtained a sulphate concentration of 118.9 ± 76.32 mg/L in Kogi State. High concentration of sulphate in water can have a laxative effect leading to kidney disorder when combined with calcium and magnesium, the two most common constituents of water hardness (EPA, 2011). Health concerns regarding sulphate in drinking water have been raised because of reports that may be associated with ingestion of water which contain high level of sulphate (WHO, 2011).
Phosphates was highest (16.00 ± 0.00 mg/L) in stream water samples from Ebonyi while well water samples from Abakaliki recorded the lowest (0.08 ± 0.08 mg/L). There was no significant difference (p > 0.05) in phosphate values among the water samples. The standard recommended limit of phosphates in water is 0.30 mg/L as given by WHO [114]. This is in agreement with the work of Nwali et al. [33] which reported phosphate values of 4.61 mgL- 1 (Ope-ekwe) and 3.81 mgL-1 (Ikwo-ihie). A lower phosphate level (1.60 ± 1.41 mgL-1) was obtained by Michael et al. [34]. John, (2018) in his study reported a phosphate concentration of 12.20 ± 0.10 mgL-1. Water samples from Ebonyi having high phosphate concentration could be as a result of high use of chemical fertilizer in farming activities. Phosphate is useful in animal cells as a buffering agent. However, high concentrations of phosphate in surface waters indicate the presence of pollution and are largely responsible for eutrophic conditions [115]. Lifetime exposure to phosphate at levels above the maximum acceptable concentration could cause such problems as diuresis and haemorrhaging of the spleen [116-122].
Conclusion
In conclusion, this investigation has revealed that the levels of physicochemical parameters in the water samples were beyond NSDWQ and who recommended limits signifying a potential risk for human and animal health. It is imperative to monitor the quality of water and strict quality control measures should be strengthened to ensure the effective treatment of drinking water. Educative programmes should be organized by researchers, and government agencies to enlighten the villagers on the potential danger associated with human consumption of contaminated water.
Conflict of Interest Statement
None to declare.
References
- Shalom NC, Obinna CN, Adetayo YO, Vivienne NE (2011) Assessment of Water Quality in Canaanland, Ota, Southwest Nigeria. Agriculture and Biology Journal of North America 2(4): 577-583.
- Tchobanoglous G, Burton FL, Stensel HD (2003) Wastewater Engineering (Treatment Disposal Reuse) /Metcalf and Eddy, Inc. (4th Edn). McGraw-Hill Book Company 521.
- Odeyemi AT, Agunbiade RO (2012) Bacteriological and Metal Analyses of Water Samples from Awotunde Fish Pond and River. Scientific Journal of Microbiology 1(2): 48-54.
- Ibe S, Okplenye J (2005) Bacteriological Analysis of Borehole Water in Uli, Nigeria. African Journal of Applied Zoology and Environmental Biology 7: 116-119.
- Onwughara NI, Ajiwe VE, Nnabuenyi HO, Chima CH (2013) Bacteriological Assessment of Selected Borehole Water Samples in Umuahia North Local Government Area, Abia State, Nigeria. Journal of Environmental Treatment Techniques 1(2): 117-121.
- Isa MA, Allamin IA, Ismail HY, Shettima A (2013) Physicochemical and Bacteriological Analyses of Drinking Water from Wash Boreholes in Maiduguri Metropolis, Borno State, Nigeria. African Journal of Food Science 7(1): 9-13.
- Ukpong E, Okon B (2013) Comparative Analysis of Public and Private Borehole Water Supply Sources in Uruan Local Government Area of Akwa Ibom State. International Journal of Applied Science and Technology 3: 7.
- Saeed MD, Mahmoud AM (2014) Determination of Some Physicochemical Parameters and Some Heavy Metals in Boreholes from Fagge Local Government Area of Kano Metropolis Kano State-Nigeria. World Journal of Analytical Chemistry 2(2): 42-46.
- Ehiowemwenguan G, Iloma AO, Adetuwo JO (2014) Physico-Chemical and Bacteriological Quality of Borehole Water in Eyaen Community Area of Edo State, Nigeria. International Journal of Basic and Applied Science 3: 60-68.
- Ezeribe A, Oshieke K, Jauro A (2012) Physicochemical Properties of Well Water Samples from some Villages in Nigeria with Cases of Stained and Mottle Teeth. The Scientific World Journal 7: 1-3.
- Mile I, Jande J, Dagba B (2012) Bacteriological Contamination of Well Water in Makurdi Town, Benue State, Nigeria. Pakistan Journal of Biological Sciences 15(21): 1048-1051.
- Aboh EA, Giwa FJ, Giwa A (2015) Microbiological Assessment of Well Waters in Samaru, Zaria, Kaduna, State, Nigeria. Annals of African Medicine 14(1): 32-38.
- Gambo J, James Y, Yakubu M (2015) Physico- Chemical and Bacteriological Analysis of Well Water at Crescent Road Poly Quarters, Kaduna. International Journal of Engineering Science 4(11): 11-17.
- Allamin I, Borkoma M, Joshua R, Machina I (2015) Physicochemical and Bacteriological Analysis of Well Water in Kaduna Metropolis, Kaduna State. Library Journal 2: 1-5.
- Okorondu S, Anyadoh Nwadike S (2015) Bacteriological and Physiochemical Analysis of Oguta Lake Water, Imo State, Nigeria. African Journal of Natural Science 3(5-1): 14-19.
- Joshi DM, Kumar A, Agrawal N (2009) Studies on Physicochemical Parameters to Assess the Water Quality of River Ganga for Drinking Purpose in Haridwar District. Rasayan Journal of Chemistry 2(1): 195-203.
- Lawal R, Lohdip Y (2011) Physicochemical and Microbial Analysis of Water from Mimyak River in Kanke LGA of Plateau State, Nigeria. African Journal of Natural Science 14: 5-7.
- Ugochukwu S, Giwa F, Giwa A (2015) Bacteriological Evaluation of Sampled Sachet Water Sold in Samaru-Zaria, Kaduna-State, Nigeria. Nigerian Journal of Basic and Clinical Science 12: 6.
- Halage AA, Ssemugabo C, Ssemwanga DK, Musoke D, Mugambe RK, et al. (2015) Bacteriological and Physical Quality of Locally Packaged Drinking Water in Kampala, Uganda. Journal of Environmental Public Health 2015: 942928.
- Sadiya A, Chukwuma CO, Olatunbosun OA, Onyinye FN (2018) Comparative Study of the Physicochemical and Bacteriological Qualities of some Drinking Water Sources in Abuja, Nigeria. Global Journal of Pure and Applied Sciences 24(1): 91-98.
- (2015) American Public Health Association (APHA). Standard Methods for the Examination of Water and Wastewater, 16th (Edi.). American Public Health Association, Washington.
- (2012) American Public Health Association (APHA), American Water Works Association (AWWA) and Water Environment Federation (WEF), Standards Methods for the Examination of Water and Wastewater (22nd (Edi.). New York: American Public Health Association (APHA), American Water Works Association (AWWA) and Water Environment Federation (WEF). New York, McGraw-Hill p. 11-25.
- Ademoroti CMA (1996) Standard Methods for Water and Effluents Analysis, Foludex Press, Ibadan 3: 29-118.
- Abulude FO, Obidiran GO, Orungbemi S (2006) Determination of Physico-chemical Parameter and Trace Metal Contents of Drinking Water Samples in Akure Nigeria. Trends in Applied Sciences Research 1(5): 534-537.
- Shalom NC, Obinna CN, Adetayo YO, Vivienne NE (2011) Assessment of Water Quality in Canaanland, Ota, Southwest Nigeria. Agriculture and Biology Journal of North America 2(4): 577-583.
- Sharma BK (2011) Industrial Chemistry (Including Chemical Engineering). Goel Publishing House 173 -176.
- Omaka ON (2007) Phosphorus in the Environment, Effects of Eutrophication, Cycle, Fractionation, Determination and Procedures for Sampling and Storage - A Review. Journal of Applied and Natural Sciences 1(1): 27-36.
- (2007) Nigerian Standard for Drinking Water Quality, NSDWQ. Nigerian Industrial Standard Price group D Standards Organisation of Nigeria p. 1-30.
- (2011) World Health Organization. Guidelines for Drinking water Quality. Geneva: World Health Organization (WHO).
- Shrestha AK, Basnet NB (2018) The Correlation and Regression Analysis of Physicochemical Parameters of River Water for the Evaluation of Percentage Contribution to Electrical Conductivity. Journal of Chemistry 8: 6-9.
- Nwali BU, Okaka ANC, Ogbanshi ME, Idenyi JN (2016) Physicochemical Water Analysis of Ikwo-Ihie River in Ivo Local Government Area and Ope-Ekwe River in Izzi Local Government Area in Ebonyi State, Nigeria. Advances in Biological Research 10(2): 82-85.
- Rajini K, Roland P, John C, Vincent R (2010) Microbiological and Physicochemical Analysis of Drinking Water in George Town. Nature and Science 8(8): 261-265.
- Michael CO, Johnmark FO, Victor CN (2015) Analysis of the Physicochemical and Microbiological Quality of Imabolo Stream Water in Ankpa Urban Area of Kogi State, Nigeria. Mediterranean Journal of Social Sciences 6(S4).
- John J (2018) Studies on Metal - Based Coagulant, Disinfectant and Adsorbent Prepared from Waste Derived Inorganics for Point of Use Water Purification. A Thesis Submitted to the Department of Industrial Chemistry, Faculty of Science, Ebonyi State University, Abakaliki, in Partial Fulfilment of the Requirements for the Award of Degree of Doctor of Philosophy (Ph.D.) in Inorganic Chemistry pp. 118-198.
- Reuben RC, Gyar SD, Aliyu Y (2018) Physicochemical and Microbiological Parameters of Water from Rivers in Keffi, Central Nigeria. Microbiology Research Journal International 24(3): 1-12.
- Ndamitso MM, Idris S, Likita MB, Jimoh OT, Ajai AI, et al. (2013) Physicochemical and Escherichia coli Assessment of Selected Sachet Water Produced in some Areas of Minna, Niger State, Nigeria. International Journal of Water Resources and Environmental Engineering 5(3): 134-140.
- Choudhury SS, Ajay K, Hiramoni D, Mukutamoni D (2016) Preliminary Physicochemical and Microbiological Analysis of Bahini River Water of Guwahati, Assam, India. International Journal of Current Microbiology and Applied Sciences 5(2): 684-692.
- (2011) World Health Organization. Guidelines for Drinking Water Quality (4th Ed.), Acceptability Aspects: Taste, Odour and Appearance. Geneva.
- Yasin M, Tsige K, Ketema B (2015) Physico-chemical and Bacteriological Quality of Drinking Water of Different Sources, Jimma Zone, Southwest Ethiopia. BMC Resources Notes 8: 541.
- Oparaocha ET, Iroegbu OC, Obi RK (2010) Assessment of Quality of Drinking Water Sources in the Federal University of Technology, Owerri, Imo State, Nigeria. Journal of Applied Biosciences 32: 1964-1976.
- Rahmanian N, Siti Hajar BA, Homayoonfard M, Ali NJ, Rehan M, et al. (2015) Analysis of Physiochemical Parameters to Evaluate the Drinking Water Quality in the State of Perak, Malaysia. Journal of Chemistry 7: 10.
- Njoku C, Ngene PN (2015) Evaluation of Water Qualities of Ebonyi River for Drinking Purposes in Abakaliki Southeastern Nigeria. Journal of Agriculture and Ecology Research International 2(4): 254-258.
- Ani C, Okogwu OI, Nwonumara GN, Nwani CD, Nwinyimagu AJ (2016) Evaluation of Physicochemical Parameters of Selected Rivers in Ebonyi State, Southeast, Nigeria. Greener Journal of Biological Sciences 6(2): 34-41.
- Igwenyi IO, Aja Okorie N (2014) Physicochemical Properties and Heavy Metal Analysis of Major Water Sources in Ohaozara, Ebonyi State Nigeria. IOSR Journal of Environmental Science, Toxicology and Food Technology (IOSR-JESTFT) 8(6): 41-44.
- Malla R, Shrestha S, Chapagain SK, Shakya M (2015) Physicochemical and Oxygen-Hydrogen Isotopic Assessment of Bagmati and Bishnumati Rivers and the Shallow Groundwater along the River Corridors in Kathmandu Valley, Nepal, Journal of Water Resource and Protection 7: 1435-1448.
- Patil PN, Sawant DV, Deshmukh RN (2012) Physico-chemical Parameters for Testing of Water-A Review. International Journal of Environmental Sciences 3(3): 1202-1203.
- Sumathi S, Manonmani E (2016) Physiochemical and Microbiological Study of River Water in Nagapattinam District Tamilnadu, India. World Journal of Pharmacy and Pharmaceutical Sciences 5(5): 1063-1090.
- Odikamnoro OO, Omowaye OS, Aneke GU (2014) The Quality and Composition of Borehole Water in Ebonyi State, Nigeria. Sci-Afric Journal of Scientific Issues, Research and Essays 2(1): 15-18.
- Purushottam JP, Yenkie MKN, Battalwar DG, Nilesh VG, Dewanand BD (2010) Study and Interpretation of Physico-chemical Characteristic of Lake Water Quality in Nagpur City, India. Rasayan Journal of Chemistry. 3(4): 800-1010.
- Sibanda T, Chigor VN, Koba S, Obi CL, Okoh AI (2014) Characterization of the Physicochemical Qualities of a Typical Rural-Based River: Ecological and Public Health Implications. International Journal of Environmental Science and Technology 11: 1771-1780.
- Shittu OB, Olaitan JO, Amusa JS (2008) Physic-chemical and Bacteriological Analysis of Water used for Drinking and Swimming Purposes in Abeokuta, Nigeria. African Journal of Biomedical Research 11: 285-290.
- Igwenyi IO (2017) Analysis of Water Sources in Ikwo Local Government Area of Ebonyi State, Nigeria. IDOSR Journal of Applied Sciences 2(2): 35-42.
- Joshua NE, John OO, Elizabeth OP, Titus AM (2018) Evaluation of Microbiological and Physicochemical Parameters of Alternative Source of Drinking Water: A Case Study of Nzhelele River, South Africa. The Open Microbiology Journal 12: 18-27.
- Ayandele AA, Umon A, Amao JA (2015) Microbial and Physico-Chemical Analysis of Water from Boreholes in Mosimi and Environs, Ogun State, Nigeria. British Journal of Applied Science and Technology 8(2): 219-225.
- Raji MIO, Ibrahim YKE, Tytler BA, Ehinmidu JO (2015) Physicochemical Characteristics of Water Samples Collected from River Sokoto, Northwestern Nigeria. Atmospheric Climate Science 5: 194-199.
- Olorode OA, Bamigbola EA, Ogba OM (2015) Comparative Studies of some River Waters in Port Harcourt Based on their Physicochemical and Microbiological Analysis, Niger Delta Region of Nigeria. International Journal of Basic and Applied Sciences 3(3): 29-37.
- Olaniyan OS, Akeredolu DA, Showale OS, Akolade AS (2016) Assessment of Microbial Quality of Some Selected Shallow Wells in Ogbomoso, South Western Nigeria. American Journal of Water Resources 4(2): 30-34.
- Agbazue VE, Ewoh JC, Madu CN, Ngang BU, Otuu FC, et al. (2017) Comparative Analysis of Physicochemical and Microbial Parameters of Water Samples from Oro-obor and Ayo Rivers in Enugu South, Enugu State, Nigeria. IOSR Journal of Applied Chemistry 10(9): 49-54.
- Aliyu HSA, Ekhaise FO, Adelusi D, Oviasogie FE (2006) Effect of Human Activities and Oil Pollution on the Microbiological and Physicochemical Quality of Udu River, Warri, Nigeria. Biology 28(62): 35-43.
- Iroha C, Matthew O, Grace E, Emmanuel N, Chika E, et al. (2016) Bacteriological and Physicochemical Parameters of some Selected Borehole Water Sources in Abakaliki Metropolis, Nigeria. International Journal of Community Medicine and Public Health 3(11): 3271-3277.
- (1999) US Environmental Protection Agency. Volunteer lake monitoring: A methods manual; EPA 440/4-91-002; Office of Water US Environ-Mental Protection Agency: Washington DC, USA.
- Perkin MR, Craven J, Logan K, Strachan D, Marrs T, et al. (2016) Association between Domestic Water Hardness, Chlorine, and Atopic Dermatitis Risk in Early Life: A population-based Cross-Sectional Study. Journal of Allergy Clinical Immunology 138(2): 509-516.
- Arnedo Pena A, Bellido Blasco J, Puig Barbera J, Artero Civera A, Campos Cruañes JB, et al. (2007) Domestic Water Hardness and Prevalence of Atopic Eczema in Castellon (Spain) School Children. Salud Pública De México 49(4): 295-301.
- Nie X, Wan Y, Bie F (2017) Dual-shale-content Method for Total Organic Carbon Content Evaluation from Wireline Logs in Organic Shale. Open Geosciences 9(1): 133-137.
- Harrison RM (2007) Understanding our Environment: An Introduction to Environmental Chemistry and Pollution. Royal Society of Chemistry 65.
- Ho KC, Chow YL, Yau JTS (2003) Chemical and Biological Qualities of East River, Water with Particular References in Hong Kong. Chemiosphere 52(9): 1441-1450.
- Nwidembia CV, Odikamnoro OO, Nnachi AU, Egwuatu CC, Nwinyimagu AJ, et al. (2016) Examination of the Physicochemical Characteristics of Domestic Water Sources in Ebonyi Local Government Area of Ebonyi State, Nigeria. International Journal of Scientific and Technology Research 5(6): 306-311.
- Reza R, Jain M, Singh G (2009) Pre and Post Monsoon Variation of Heavy Metals Concentration in Ground Water of Angul-Talcher Region of Orissa, India. Natural Science 7(6): 52-56.
- Tiwari S (2015) Water Quality Parameters A Review. International Journal of Engineering Science Invention Research and Development 1: 319-324.
- Akoto O, Adiyiah J (2007) Chemical Analysis of Drinking Water from some Communities in the Brong Ahafo Region. International Journal of Environmental Science and Technology 4(2): 211-214.
- Bisi Johnson MA, Kehinde O, Adediran SA, Akinola EOP, Anthony IO (2017) Comparative Physicochemical and Microbiological Qualities of Source and Stored Household Waters in some Selected Communities in Southwestern Nigeria. Sustainability 9(3): 454.
- Bingham E, Cohrssen B (2012) Patty's Toxicology, 6th (Edn). John Wiley and Sons 6: 244.
- Lee JD (2009) Concise Inorganic Chemistry, 5th (Edi.), Blackwell Science Limited, S. P. Printers, Delhi, pp. 308-309.
- Exley C (2016) Aluminum should now be Considered a Primary Etiological Factor in Alzheimer’s Disease. Journal of Alzheimer's Disease Reports 1(1): 23-25.
- Sabine M, Wendy G (2009) Human Health Effects of Heavy Metals. Environmental Science and Technology Briefs for Citizens.
- Nnabo PN (2015) Assessment of Heavy Metal Contamination of Water Sources from Enyigba Pb-Zn District, South Eastern Nigeria. International Journal of Scientific and Technology Research 4(9): 187-197.
- Al Motabagani MAH (2002) Effect of Cadmium on the Morphology of Adrenal Gland in Mice. Journal of Anatomy Society of India 51(2): 212-216.
- Jarup L, Alfven T (2004) Low Level Cadmium Exposure, Renal and Bone Effects--the OSCAR Study. BioMetals 17(5): 505-509.
- Udu Ibiam A, Emmanuel IU, Christ E, Okechukwu U (2013) Cadmium-Induced Toxicity and the Hepatoprotective Potentials of Aqueous Extract of Jessiaea nervosa Leaf. Advanced Pharmaceutical Bulletin. 3(2): 309-313.
- Marque S, Jacqmin Gadda H, Dartigues JF, Commenges D (2003) Cardiovascular Mortality and Calcium and Magnesium in Drinking Water: An Ecological Study in Elderly People. European Journal of Epidemiology 18(4): 305-309.
- McTigue NE, Symons JM (2011) The Water Dictionary: A Comprehensive Reference of Water Terminology. American Water Works Association pp. 333.
- Yang CY, Cheng MF, Tsai SS (1998) Calcium, Magnesium, and Nitrate in Drinking Water and Gastric Cancer Mortality. Japanese Journal of Cancer Research, 89(2): 124-130.
- (2003) World Health Organization (WHO). Zinc in Drinking-water: Background Document for Development of WHO Guidelines for Drinking-Water Quality. Published by WHO.
- Vincent JB (2013) Chromium: Is it Essential, Pharmacologically Relevant, or Toxic? In: Sigel A, Sigel H, Sigel R, eds. Interrelations between Essential Metal Ions and Human Diseases: Springer Science Business Media Dordrecht 1: 171-198.
- Davis CM, Sumall KH, Vincent JB (1996) A Biologically Active Form of Chromium May Activate a Membrane Phosphotyrosine Phosphatase (PTP). Biochemistry 35(39): 12963-12969.
- Ghani A (2011) Effect of Chromium Toxicity on Growth, Chlorophyll and some Mineral Nutrients of Brassica juncea L. Egyptian Academy Journal of Biological Science 2(1): 9-15.
- Cervantes C, Campos Garcia J, Debars S, Gutierrez Corona F, Loza Tavera H, et al. (2001) Interaction of Chromium with Microgenesis and Plants. Federation of European Microbiological Societies Microbiology Review 25(3): 335-347.
- Pillay AE, Williams JR, EL Mardi MO, AI Lawati SMH, AI Hadabbi MH, et al. (2003) Risk Assessment of Chromium and Arsenic in Date Palm Leaves used as Livestock Feed. Environment International 29(5): 541-545.
- (2008) Agency for Toxic Substances and Disease Registry, ATSDR. Public Health Statement Aluminium.
- World Health Organization (2004) Guideline for Drinking Water Quality, Volume I. WHO Geneva Switzerland pp. 11-17.
- Chinwe O, Ukabiala N, Obinna C, Abayomi A, Alo BI (2010) Assessment of Heavy Metals in Urban Highway Runoff from Ikorodu Expressway Lagos, Nigeria. Journal of Environmental Chemistry and Ecotoxicology 2(3): 34-37.
- Zaira ZC, Sharifuddin MZ, Rashid AK, Abdulbari AA (2011) Equilibrium Kinetics and Isotherm Studies of Cu (II) Adsorption from Waste unto Alkali Activated Oil Palm Ash. American Journal of Applied Sciences 8 (3): 230-237.
- Shyamala R, Shanti M, Lithia P (2008) Physicochemical Analysis of Bore Well Water Samples of Telungupalayam Area in Coimbatore District, Tamilnadu, India. E-Journal of Chemistry 5(4): 924-929.
- Imam TS (2012) Assessment of Heavy Metal Concentrations in the Surface Water of Bompai-Jakara Drainage Basin, Kano State, Northern Nigeria. Bayero Journal of Pure and Applied Science 5(1): 103-108.
- Grandjean P (1978) Widening Perspectives of Lead Toxicity. Environmental Research 17(2): 303-321.
- Olewinska E, Kasperczyk A, Kapka L, Kozlowska A (2010) Level of DNA Damage in Lead-exposed Workers. Annals of Agricultural and Environmental Medicine 17(2): 231-236.
- Fatoki OS, Awofolu R (2002) Levels of Cd, Hg and Zn in some Surface Waters from the Eastern Cape Province, South Africa. Water Scarcity in Africa 29(4): 375.
- Oluwande PA, Sridhar MKC, Bammeke AO, Okubadejo AO (1983) Pollution Levels in some Nigeria Rivers. Water Resources 7(9): 957-863.
- Turgut F, Kanbay M, Metin MR, Uz E, Akcay A, et al. (2008) Magnesium Supplementation Helps to Improve Carotid Intima Media Thickness in Patients on Hemodialysis. International Urology and Nephrology 40(4): 1075-1082.
- Hashimoto T, Hara A, Ohkubo T, Kikuya M, Shintani Y, et al. (2010) Serum Magnesium, Ambulatory Blood Pressure, and Carotid Artery Alteration: The Ohasama Study. American Journal of Hypertension 23(12): 1292-1298.
- Rob PM, Dick K, Bley N, Seyfert T, Brinckmann C, et al. (1999) Can One Really Measure Magnesium Deficiency using the Short-term Magnesium Loading Test? Journal of International Medicine 246(4): 373-378.
- Brady GS, Clauser HR, Vaccari JA (2002) Materials Handbook: An Encyclopedia for Managers, Technical Professionals, Purchasing and Production Managers, Technicians, and Supervisors. New York, NY: McGraw-Hill, pp. 585-587.
- Yin Z, Jiang H, Lee ES, Ni M, Erikson KM, et al. (2010) Ferroportin is a Manganese-responsive Protein that Decreases Manganese Cytotoxicity and Accumulation. Journal of Neurochemistry 112(5): 1190–1198.
- Bouchard MF, Sauvé S, Barbeau B, Legrand M, Bouffard T, et al. (2011) Intellectual Impairment in School-age Children Exposed to Manganese from Drinking Water. Environmental Health Perspectives 119(1): 138-143.
- Thirulogachandar A, Rajeswari ME, Ramya MS (2014) Assessment of Heavy Metals in Gallus and their Impacts on Human. International Journal of Scientific and Research Publications 4(6): 234-239.
- Nzubechukwu E, Udu AI, Ikechukwu OI, Victor CU, Solomon NE (2015) Evaluation of Physicochemical Properties, Mineral and Heavy Metal Content of Drinking Water Samples in Two Communities in South-East, Nigeria: A Public Health Implication. Journal of Environment and Earth Science 5(9): 89-94.
- Mayell H (2007) Did Mercury in Little Blue Pills make Abraham Lincotn Erratic? National Geographic News 24: 18-89.
- Samuel JC, Abudu BD, Reginald Q, Samuel O, Noel B (2015) Comparative Assessment of Heavy Metals in Drinking Water Sources in Two Small-Scale Mining Communities in Northern Ghana. International Journal of Environmental Research and Public Health 12(9): 10620-10634.
- WHO (2006) Guidelines for Drinking Water Quality? Vol. 1 Geneva. Addendum to the 3rd Volume 1 Recommendations. World Health Organization.
- Jentsch TJ, Stein V, Weinreich F, Zdebik AA (2002) Molecular Structure and Physiological Function of Chloride Channels. Physiological Reviews 82(2): 503-568.
- Tay CK (2007) Chemical Characteristics of Groundwater in the Akatsi and Ketu Districts of the Volta Region, Ghana. West African Journal of Applied Ecology 11: 1.
- Adekunle IM, Adetunji MT, Gbadebo AM, Banjoko OB (2007) Assessment of Groundwater Quality in a Typical Rural Settlement in Southwest Nigeria. International Journal of Environmental Research and Public Health 4(4): 307-318.
- Shrinivasa RB, Venkateswaralu P (2000) Physicochemical Analysis of Selected Groundwater Samples. Indian Journal of Environmental Protection 20(3): 161.
- WHO (2012) Guidelines for Drinking Water Quality- 2nd edn World Health Organization, Geneva? P 43
- Venkatesharaju K, Ravikumar P, Somashekar RK, Prakash KL (2010) Physico-Chemical and Bacteriological Investigation on the River Cauvery of Kollegal Stretch in Karnataka. Kathmandu University Journal of Science, Engineering and Technology 6: 50-59.
- Reimann C, Bjorvatn K, Frengstad B, Melaku Z, Teklehaimanot R (2003) Drinking Water Quality in the Ethiopian Section of the East African Rift Valley I Data and Health Aspects. Science Total Environment 311: 65-80.
- Adefemi SO, Awokunmi EE (2010) Determination of Physicochemical Parameters and Heavy Metals in Water Samples from Itaogbolu Area of Ondo State, Nigeria. African Journal of Environmental Science and Technology 4(3): 145-148.
- Hoareau L, Dasilva EJ (1999) Medicinal Plants: A Re-emerging Health Aid. Electronic Journal of Biotechnology 2: 56-70.
- Yang CY, Hui Fen C (1999) Calcium and Magnesium in Drinking Water and the Risk of Death from Hypertension. American Journal of Hypertension 12(9): 894-899.
- Leverstein van Hall MA, Paauw A, Box ATA, Blok HEM, Verhoef J, et al. (2002) Presence of Integron-associated Resistance in the Community is Widespread and Contributes to Multidrug Resistance in the Hospital. Journal of Clinical Microbiology 40(8): 3038-3040.
- Jeffery GH, Bassett J, Mendham J, Denney RC (2004) Vogel's Textbook of Quantitative Chemical Analysis (6thedn). Delhi, India: Pearson Education Ltd. Methods for the Examination, of Water and Wastewater pp. 456.
- World Health Organization (2006) World Health Organization Guidelines for Drinking Water quality in small community supplies Geneva pp. 19-34.
