 Research Article
Abstract
Objectives: This study aimed to examine predictors of malnutrition in patients undergoing hemodialysis (HD).
Methods: We enrolled 596 patients undergoing HD and divided them into malnourished and non-malnourished groups based on a serum albumin (ALB) cutoff value of 35 g/L. We completed between-group comparisons of different nutritional biomarkers using correlational and receiver operating curve (ROC) analyses.
Results: Using an ALB cutoff threshold, 17.42% of patients undergoing HD met criteria for malnourished. The serum levels of total protein (TP), hemoglobin (HGB), pre- HD creatinine (Cr) and high-density lipoprotein (HDL) exhibited significant and weak to moderately-strong positive correlations with ALB, with correlation indices of 0.555, 0.300, 0.209 and 0.144, respectively. In contrast, pre-HD uric acid (UA), pre-HD blood urea nitrogen (BUN), triglycerides (TG), cholesterol (CHOL), low-density lipoprotein (LDL) and body mass index (BMI) showed no correlation with ALB. ROC analyses revealed areas under the curve (AUC) of 0.732 for TP, 0.670 for HGB, 0.611 for Cr, 0.583 for HDL. We used the Youden index to define a cutoff value for TP of <63.85 g/L. The sensitivity and specificity of TP were 85.39% and 50.48% respectively; for HGB, the cutoff value was <108.5 g/L, and the sensitivity and specificity were 51.1% and 77.7%, respectively. The association of additional indices did not significantly change these values.
Conclusion: ALB, TP, and HGB are useful indices for evaluating nutritional status in patients undergoing daily HD. For these patients, these indices may provide additional information on malnutrition risk at an earlier disease stage.
Keywords: Hemodialysis; Malnutrition; Evaluation; Biomarker; Albumin
Abbreviations: HD: Hemodialysis; ALB; Albumin; ROC: Receiver Operating Curve; TP: Total Protein; HGB: Hemoglobin; Cr: Creatinine; HDL: High-Density Lipoprotein; BUN: Blood Urea Nitrogen; TG: Triglycerides; CHOL: Cholesterol; LDL: Low-Density Lipoprotein; AUC: Areas Under The Curve; PEW: Protein-Energy Wasting; ESRD: End- Stage Renal Disease; UA: Uric Acid; SGA: Subjective Global Assessment; MIS: Malnutrition- Inflammation Scores; PPV: Positive Predictive Value; NPV: Negative Predictive Value; STP: Serum Total Protein
Introduction
Malnutrition is one of the most common complications in patients undergoing maintenance hemodialysis (HD) [1] and is an independent risk factor for mortality in these patients [2-4]. Past research [5-7] has found that malnutrition was positively correlated with cardiovascular events, which are leading causes of death in patients undergoing HD. Because nutritional status is so vital to these patients, the concept of Protein-Energy Wasting (PEW) is an increasing area of focus for practitioners who treat patients with end-stage renal disease (ESRD). PEW is mainly caused by inadequate energy intake, aggravated by ESRD itself and nutrient consumption during dialysis. Clinically, malnutrition is characterized by low BMI, low serum ALB, micro-inflammation, renal anemia, and amyotrophy. The lower the serum ALB level, the higher the likelihood of developing pulmonary hypertension, which significantly impacts survival [8]. Reduced serum ALB levels independently predicted mortality in patients undergoing HD [9].
Low serum UA was considered a mortality risk factor for patients with many comorbidities and hypoalbuminemia [10]. The relationship of other biomarkers to the nutritional status of patients undergoing HD, such as total protein (TP) and hemoglobin (HGB), have not been fully explored, and the relationship of these biomarkers to prognosis is unknown. The findings of recent nutrition biomarker studies of patients undergoing HD were limited by methodological issues such as a small sample size and single center data. Thus, studies with larger cohorts of patients undergoing HD are needed. Consequently, the aims of this study were to determine the nutritional status of patients undergoing HD and to explore predictors of malnutrition in these patients.
Materials and Methods
Study Design and Participants
This was a cross-sectional, retrospective, observational nutritional investigation of patients receiving HD for at least three months at the time of enrollment. All patients received routine measurements of biochemical indicators as standard-of-care. We excluded patients with limited life expectancy due to cachexia, malignancies, decompensation-stage hepatopathy, and those who developed acute inflammation during the study. All patients’ demographic characteristics and clinical information were collected, including body mass index (BMI), TP, HGB, pre-HD creatinine (Cr), blood urea nitrogen (BUN), uric acid (UA), cholesterol (CHOL), triglycerides (TG), high-density lipoprotein (HDL), and low-density lipoprotein (LDL). Patients were considered malnourished if ALB <35 g/L.
Hemodialysis
All patients underwent two to three HD sessions per week, with a session length of 3.5 to 4.0 hours. Duration of treatment was individualized according to the urea kinetics model. During the HD sessions, blood flow was 250-300 mL/min, and the dialysate flow was 500 mL/min. The buffer that was used was bicarbonate, at a concentration of 35 mmol/L. The glucose concentration of the dialysate was 100 mg/dL. The HD machines were of the proportion type with a controlled ultrafiltration module, and water treatment was performed using reverse osmosis.
Statistical Analysis
Data are expressed as the mean + standard deviation for continuous variables and as percentages for categorical variables. Data were analyzed using unpaired t-tests for two-group comparisons using IBM SPSS Statistical Software Package version 19.0. Correlation and receiver operating curve (ROC) analyses were performed using GraphPad Prism, version 5.0 for Windows (GraphPad Software, San Diego, California, USA), and SPSS, version 19.0 for Windows. Differences were considered statistically significant when p<0.05.
Results
Patients’ Baseline Characteristics
We enrolled 596 patients undergoing HD in this study. Baseline characteristics are shown in Table 1. There were 353 (59.2%) males and 243 (40.8%) females. Their mean age was 57.1±14.1 years, and the mean duration of HD was 50.6±34.7 months. Patients were divided into a malnutrition group (ALB >35 g/L; n=493, 82.7%) and a normal nutrition group (ALB <35 g/L; n=103 patients, 17.3% ). TP, HGB, Cr, and HDL were significantly higher in the normal nutrition group than in the malnutrition group. In contrast, there were no significant between-group differences in UA, BUN, TG, CHOL, LDL, and BMI. Interestingly, the two groups had nearly identical mean BMI, reminding us that BMI may not be a meaningful index of nutritional status for certain patients receiving HD, as shown in Table 2.
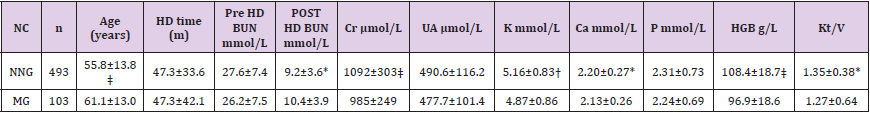
Table 1: Comparison of demographic and laboratory data between normal nutrition group and malnutrition group in patients undergoing HD program. p < 0.05; † p < 0.01; ‡ p < 0.001; NC: Nutrition Classification; NNG: Normal Nutrition Group; MG: Malnutrition Group; HD: Hemodialysis; BUN: Blood Urea Nitrogen; Cr: Creatinine; UA: Uric Acid; HGB: Hemoglobin. Unless stated, data are presented as mean ± SD.
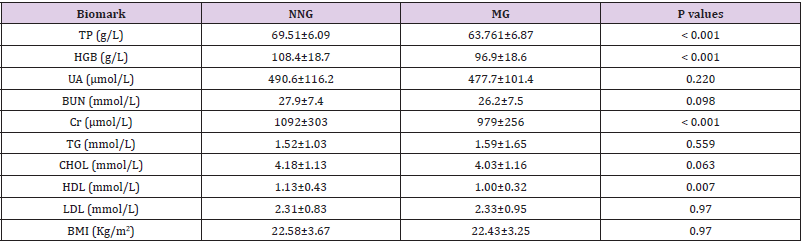
Table 2: Comparison of nutrition-related biomark between normal nutrition group and malnutrition group in patients undergoing HD program. TP, HGB, Cr and HDL were at higher level in nutrition normal group. NNG: normal nutrition group; MG: malnutrition group; TP: Serum Total Protein; HGB: Hemoglobin; UA: Uric Acid; BUN: Blood Urea Nitrogen; Cr: Creatinine; TG: Triglyceride; CHOL: Cholesterol; HDL: High Density Lipoprotein; LDL: Low-Density Lipoprotein; BMI: Body Mass Index. Unless stated, data are presented as mean ± SD.
Correlation Analysis of ALB and Other Biochemical Indicators
Correlation analysis was carried out to compare the “gold standard” ALB with another biochemical indicators. As shown in Table 3 & Figure 1, TP had a moderately strong and positive correlation with ALB, with a correlation coefficient of 0.555. HGB, Cr, and HDL were significantly and positively correlated with ALB, with correlation coefficients of 0.300, 0.209, and 0.144, respectively. However, like a traditional nutritional index, BMI did not correlate with ALB. In addition, UA, BUN, TG, CHOL, and LDL were not correlated with ALB.
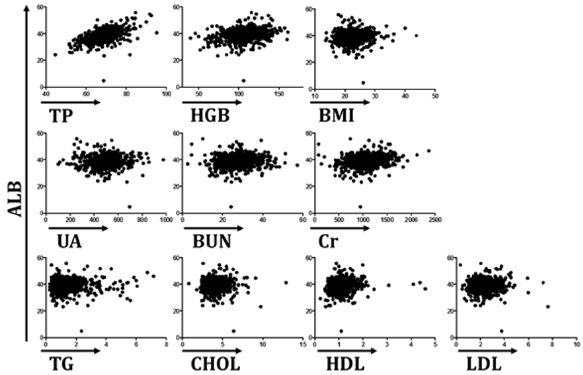
Figure 1: Serum TP, HGB, Cr or HDL had significantly positive correlations with ALB, with correlation coefficients of 0.555, 0.3, 0.209, and 0.144, respectively.
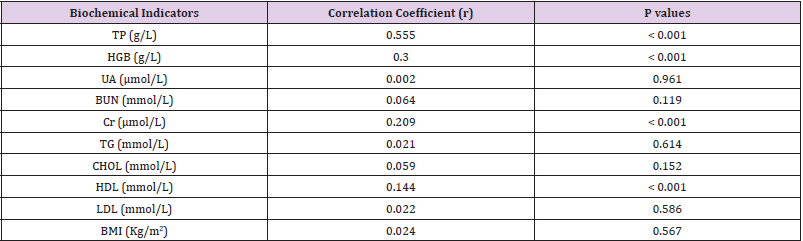
Table 3: Correlation analysis between ALB and other nutrition-related biomark.
ROC Analysis to Determine the Appropriate Biochemical Indicators for Evaluating Malnutrition in Patients Undergoing HD
During ROC analysis, we used ALB as the “gold standard” to determine suitable biochemical indicators for malnutrition. The ROC curves for the variables with significant between-group differences between the normal and malnutrition groups are shown in Table 4. The AUC for the following variables were as follows: TP, 0.732; HGB, 0.670; Cr, 0.611; and HDL, 0.583. Based on the ROC curves and the means and standard deviations of those variables, we selected indices for subsequent sensitivity and specificity analyses. After those analyses, the values selected were as follows: TP <63.85 g/L; HGB <108.5 g/L; Cr <649.6 μmol/L; HDL <1.045 mmol/L. For UA, BUN, TG, CHOL, LDL, and BMI, the AUC values were <0.5, meaning these biochemical indicators were not suitable for evaluating malnutrition in patients receiving HD. Table 4 & Figure 2 include the sensitivity, specificity, positive and negative predictive values for each variable. TP had 85.39% sensitivity and 50.48% specificity, while HGB had 77.7% specificity and 51.1% sensitivity. Unlike the high negative predictive values of these variables (94.3% for TP and 88.38% for HGB), the positive predictive values were low at 26.48% for TP and 32.37% for HGB. The association of two or more of these indices did not significantly change the predictive values (data not shown).

Figure 2: TP and HGB can be used to evaluate the nutritional status of patients undergoing HD. During ROC analysis, where ALB was used as the “gold standard” diagnostic criteria for malnutrition in patients receiving HD, the AUC values were: 0.732 for TP, 0.670 for HGB, 0.611 for Cr, 0.583 for HDL. We used the Youden index to define specific cutoff values. TP<63.85 g/L had 85.39% sensitivity and 50.48% specificity; HGB <108.5 g/L had 51.1% sensitivity and 77.7% specificity.
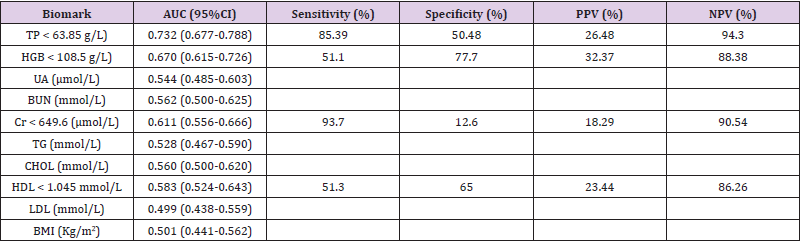
Table 4: Sensitivity and specificity of different biomark in evaluating malnutrition in patients undergoing HD program
Discussion
Malnutrition is a common complication in patients undergoing HD, and it is an independent risk factor for cardiovascular events [7,11]. Also, malnutrition and reduced ALB levels are known independent predictors of mortality in patients receiving HD [3,9]. Physicians must examine the nutritional status of patients undergoing HD early in the disease. Some studies have shown that nutrition interventions significantly improved physical functioning, quality of life, and survival in patients with malnutrition [12,13]. Nutritional evaluations for patients undergoing HD include subjective global assessment (SGA) and malnutrition-inflammation scores (MIS). SGA [14] is a valid nutritional marker for patients with ESRD [15] and an independent predictor of mortality for patients receiving HD [9]. MIS [16] includes subjective nutritional evaluation and objective indices, and are applicable to patients receiving HD [17,18]. However, because of the complexity of these techniques, they have limited use in clinical practice. Additionally, many hospitals lack professional nutritionists who would normally implement such methods.
Objective and common indicators for evaluating the nutrition status of patients undergoing HD, particularly early on, are important. Physicians should therefore attend to patients’ nutritional status and implement nutrition interventions when indicated. ALB, a traditional nutritional marker, is used as a predictive biomarker in various fields [9,19-21]. These include nutritional evaluation in patients with diseases that produce edematous symptoms [22]. ALB is therefore useful for evaluating nutritional status in patients undergoing HD. In addition, ALB can be compared to other nutrition-related biochemical indicators. Previous research has supported the usefulness of TP and HGB as potential malnutrition biomarkers in certain patients, such as those who are status-post total joint replacement, elderly patients, and others [23-25]. We found that TP and HGB had relatively high AUC values during ROC analyses. These results suggested that TP or HGB could serve as feasible indicators for evaluating the nutritional statuses of patients receiving HD. Patients with poor renal function may require two, three, or more sessions of HD per week, which means the serum levels of small-molecule substances are continually undulating.
However, ALB, TP, and HGB are proteide; they have steady blood concentrations during HD and can therefore be used as reliable tools to assess the nutritional status of patients undergoing HD. BMI, considered a classical nutritional index [26], failed to adequately reflect the nutritional status of patients undergoing HD in our study. Various lipid-related indicators including TG, CHOL, LDL, and HDL performed similarly. Other small-molecule biochemical indicators like Cr, BUN, and UA often clear during HD and are of limited usefulness, likely because of their unstable serum levels during HD. Our results were inconsistent with those of previous studies. One previous study showed that lower Cr levels in patients who received peritoneal dialysis or HD was associated with lower muscle mass and malnutrition [27,28]. The authors concluded that Cr levels might provide additional information regarding nutritional status in patients undergoing HD [29]. Future, well-powered studies are needed to determine the Cr threshold with prognostic value for nutritional assessments.
In conclusion, we examined the usefulness of ALB, TP, and HGB for evaluating malnutrition in patients undergoing HD. Our results may provide additional information for detecting and treating malnutrition in this population.
Practical Application
This article explored the value of nutrition-related biochemical indicators for evaluating nutritional status in patients undergoing maintenance hemodialysis. Of note, the biomarkers of interest are routinely obtained as per standard-of care. The study cohort consisted of 596 patients who were receiving hemodialysis at ten hospitals in south China. Our results indicated that serum albumin, total serum protein, and hemoglobin were useful predictors of malnutrition in these patients. Comparing patients’ values with predetermined threshold values may provide additional information regarding patients’ nutritional statuses, even during early disease stages.
Supplementary Material
No supplementary material.
Funding
This research did not receive any specific grant from funding agencies in the public, commercial, or not-for-profit sectors.
Support and Financial Disclosure Declaration
All the authors declared no competing interests.
References
- Beberashvili I, Azar A, Sinuani I, Yasur H, Feldman L, et al. (2010) Objective Score of Nutrition on Dialysis (OSND) as an alternative for the malnutrition-inflammation score in assessment of nutritional risk of haemodialysis patients. Nephrol Dial Transplant 25(8): 2662-2671.
- Stolic RV, Trajkovic GZ, Peric VM, Stolic DZ, Sovtic SR, et al. (2010) Impact of metabolic syndrome and malnutrition on mortality in chronic hemodialysis patients. J Ren Nutr 20(1): 38-43.
- Kalantar Zadeh K, Kopple JD, Block G, Humphreys MH (2001) A malnutrition-inflammation score is correlated with morbidity and mortality in maintenance hemodialysis patients. Am J Kidney Dis 38(6): 1251-1263.
- Chan M, Kelly J, Batterham M, Tapsell L (2012) Malnutrition (subjective global assessment) scores and serum albumin levels, but not body mass index values, at initiation of dialysis are independent predictors of mortality: a 10-year clinical cohort study. J Ren Nutr 22(6): 547-557.
- Spatola L, Finazzi S, Calvetta A, Reggiani F, Morenghi E, et al. (2018) Subjective Global Assessment-Dialysis Malnutrition Score and cardiovascular risk in hemodialysis patients: an observational cohort study. J Nephrol 31(5): 757-765.
- Perunicic Pekovic G, Pljesa S, Rasic Milutinovic Z, Stankovic S, Ilic M, et al. (2008) Inflammatory cytokines and malnutrition as related to risk for cardiovascular disease in hemodialysis patients. Can J Physiol Pharmacol 86(4): 205-209.
- Honda H, Qureshi AR, Heimburger O, Barany P, Wang K, et al. (2006) Serum albumin, C-reactive protein, interleukin 6, and fetuin a as predictors of malnutrition, cardiovascular disease, and mortality in patients with ESRD. Am J Kidney Dis 47(1): 139-148.
- Genctoy G, Arikan S, Eldem O (2015) Pulmonary hypertension associates with malnutrition and body composition hemodialysis patients. Ren Fail 37(2): 273-279.
- Chan M, Kelly J, Batterham M, Tapsell L (2012) Malnutrition (subjective global assessment) scores and serum albumin levels, but not body mass index values, at initiation of dialysis are independent predictors of mortality: a 10-year clinical cohort study. J Ren Nutr 22(6): 547-557.
- Lee SM, Lee AL, Winters TJ, Tam E, Jaleel M, et al. (2009) Low serum uric acid level is a risk factor for death in incident hemodialysis patients. Am J Nephrol 29(2): 79-85.
- Spatola L, Finazzi S, Calvetta A, Reggiani F, Morenghi E, et al. (2018) Subjective Global Assessment-Dialysis Malnutrition Score and cardiovascular risk in hemodialysis patients: an observational cohort study. J Nephrol 31(5): 757-765.
- Magnard J, Deschamps T, Cornu C, Paris A, Hristea D (2013) Effects of a six-month intradialytic physical ACTIvity program and adequate NUTritional support on protein-energy wasting, physical functioning and quality of life in chronic hemodialysis patients: ACTINUT study protocol for a randomised controlled trial. BMC Nephrol 14: 259.
- Molfino A, Chiappini MG, Laviano A, Ammann T, Bollea MR, et al. (2012) Effect of intensive nutritional counseling and support on clinical outcomes of hemodialysis patients. Nutrition 28(10): 1012-1015.
- Detsky AS, Mc Laughlin JR, Baker JP, Johnston N, Whittaker S, et al. (1987) What is subjective global assessment of nutritional status? JPEN J Parenter Enteral Nutr 11(1): 8-13.
- Cooper BA, Bartlett LH, Aslani A, Allen BJ, Ibels LS, et al. (2002) Validity of subjective global assessment as a nutritional marker in end-stage renal disease. Am J Kidney Dis 40(1): 126-132.
- Kalantar Zadeh K, Kopple JD, Humphreys MH, Block G (2004) Comparing outcome predictability of markers of malnutrition-inflammation complex syndrome in haemodialysis patients. Nephrol Dial Transplant 19(6): 1507-1519.
- Hou Y, Li X, Hong D, Zou H, Yang L, et al. (2012) Comparison of different assessments for evaluating malnutrition in Chinese patients with end-stage renal disease with maintenance hemodialysis. Nutr Res 32(4): 266-271.
- Kara E, Sahutoglu T, Ahbap E, Sakaci T, Koc Y, et al. (2016) The predictive value of malnutrition - inflammation score on 1-year mortality in Turkish maintenance hemodialysis patients. Clin Nephrol 86(2): 94-99.
- Wagner D, Adunka C, Kniepeiss D, Jakoby E, Schaffellner S, et al. (2011) Serum albumin, subjective global assessment, body mass index and the bioimpedance analysis in the assessment of malnutrition in patients up to 15 years after liver transplantation. Clin Transplant 25(4): E396-400.
- Prenner G, Wasler A, Fahrleinter Pammer A, Werkgartner G, Mischinger HJ, et al. (2014) The role of serum albumin in the prediction of malnutrition in patients at least five yr after heart transplantation. Clin Transplant 28(6): 737-742.
- Morey VM, Song YD, Whang JS, Kang YG, Kim TK (2016) Can Serum Albumin Level and Total Lymphocyte Count be Surrogates for Malnutrition to Predict Wound Complications After Total Knee Arthroplasty? J Arthroplasty 31(6): 1317-1321.
- Hay RW, Whitehead RG, Spicer CC (1975) Serum-albumin as a prognostic indicator in oedematous malnutrition. Lancet 2(7932): 427-429.
- Greene KA, Wilde AH, Stulberg BN (1991) Preoperative nutritional status of total joint patients. Relationship to postoperative wound complications. J Arthroplasty 6(4): 321-325.
- Sagawa M, Kojimahara N, Otsuka N, Kimura M, Yamaguchi N (2011) Immune response to influenza vaccine in the elderly: association with nutritional and physical status. Geriatr Gerontol Int 11(1): 63-68.
- Astor BC, Muntner P, Levin A, Eustace JA, Coresh J (2002) Association of kidney function with anemia: the Third National Health and Nutrition Examination Survey (1988-1994). Arch Intern Med 162(12): 1401-1408.
- Campillo B, Paillaud E, Uzan I, Merlier I, Abdellaoui M, et al. (2004) Value of body mass index in the detection of severe malnutrition: influence of the pathology and changes in anthropometric parameters. Clin Nutr 23(4): 551-559.
- Park J, Mehrotra R, Rhee CM, Molnar MZ, Lukowsky LR, et al. (2013) Serum creatinine level, a surrogate of muscle mass, predicts mortality in peritoneal dialysis patients. Nephrol Dial Transplant 28(8): 2146-2155.
- Yildiz A, Tufan F (2015) Lower creatinine as a marker of malnutrition and lower muscle mass in hemodialysis patients. Clin Interv Aging 10: 1593-1594.
- Tufan F, Yildiz A, Dogan I, Yıldız D, Sevinir S (2015) Urea to creatinine ratio: a forgotten marker of poor nutritional state in patients undergoing hemodialysis treatment. Aging Male 18(1): 49-53.
