 Short Communication
Abstract
Samples of surface water were collected from Edagberi Creek from three different stations at intervals of two months for a one-year period. The samples were treated using standard methods and then analyzed for heavy metals concentrations using atomic absorption spectrophotometry (AAS). The metals analyzed were manganese (Mn), mercury (Hg), cadmium (Cd), lead (Pb), copper (Cu), nickel (Ni), iron (Fe), chromium (Cr) and zinc (Zn). The result of the metal concentrations in both stations and months showed the order as Hg < Cd < Pb < Cr < Cu < Zn < Fe < Mn < Ni. The values observed for Fe, Mn and Ni were higher than the WHO and NAFDAC requirement for drinking water, while those of Hg, Cd, Pb, Cr, Cu and Zn were lower than the stipulated values for drinking water by the stated agencies. Contamination factor test carried out on the different heavy metals based on their concentrations and the WHO standard showed that the studied heavy metals were at different level of contamination and pollution classification in the creek. The creek was slightly contaminated–severely polluted with Mn, while that of Hg was within contamination range, Cd and Pb fall within non-contamination to moderate contamination, not contaminated with Cu and Zn, but the creek was moderately polluted with Ni, and non-contaminated to slightly contaminated with Fe and uncontaminated to moderately contaminated with Cr. Pollution index showed that the creek is not polluted with heavy metals. Contamination degree values showed that the creek is at different levels of heavy metals contamination, while modified contamination degree indicated that the creek experienced nil to very low degree of contamination by the metals examined. From the results obtained in the creek, it is advisable that the water should be subjected to treatment before consumption.
Keywords: Edagberi Creek; Contamination; Heavy metals; Water; Assessment
Abbreviations: CF: Contamination Factor; PLI: Pollution index CD: Contamination Degree MCD: Modified Contamination Degree; ND: Non-Detected; Cu: Copper; Ni: Nickel; Fe: Iron; Cr: Chromium; Zn: Zinc
Introduction
The continuous monitoring of any aquatic medium is very important in the evaluation, management and legislative process for the renewal, restoration, safety and protection of the aquatic environment. These combined activities help to put in place the integrity of aquatic biota and the general environmental geochemistry. Documented evidence has proven that heavy metals are increased in the environment as a result of industrial and agricultural activities [1,2]. Different Aquatic environments such as lakes, streams, rivers, creeks, reservoirs, seas, oceans and even rainwater have been found to be polluted and their pollution has been traced to some human activities such as flared gases from industrial sites [3]. Similarly, other pollution agents are precipitation, runoffs, discharged effluents and direct waste dumping into water [4,2]. The result of increased population growth has led to increased waste production. Increased wastes discharge, bunkering activities, illegal refining of petroleum products, application of pesticides and fertilizers in agricultural farms have been associated with rise in population [5].
Prior to the present era where the drilling of boreholes by private individuals and establishments, creeks and rivers had been the only sources of portable water (except rainwater and well water) for both domestic and industrial uses. Water bodies have until now been used for transportation of waste, public toilet and also for fishing especially for homes and commercial purposes [6]. Heavy metals belong to a group of metals and metalloids which have densities greater than 5g/cm3. They all fall into the group of transition elements. The presence of heavy metals in water, food, soil and air at some concentrations is a risk to human health and at such levels are considered as toxicants and pollutants, yet some at low levels are vital to both plants and animals [7]. Some of these metals (Hg, Pb and Cd) are not required by man body system and the environment even at very low concentrations because of their toxicity. This is because they interfere with the physiological system of animals which lead to different ailments [8]. However, others such as iron, copper, zinc, manganese and selenium are required at trace levels for proper physiological and biochemical body functions [9]. According to [10], the constant deterioration and degradation of the different water bodies and sources is alarming and thus becoming a societal issue which must be addressed urgently. Therefore, this study was carried out to determine the concentrations of heavy metals in Edagberi Creek, an important river that cuts through communities in Rivers and Bayelsa States.
Materials and Methods
The geographic positions of the sampled points were determined by the use of compass integrated in a Tecno 7C model handset. It was determined by putting on the data (internet) and the compass was put on alongside the location indicator of the handset and then left for ten seconds to stabilize and then the locations were obtained (Table 1). Water samples were collected from the creek between 7. 00 am to 9.00 am with pre-acid rinsed plastic sample bottles. The samples were fixed with two drops of nitric acid to stabilize the content and prevent adsorption of metals to the surface of the container. Water samples were collected at a depth of 25 cm into the water. The samples were put into ice cold packs and then transported to the laboratory for analysis.
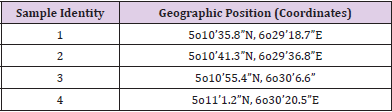
Table 1: Geographic Positions of the Sample Locations along Edagberi Creek.
A known volume of 50 cm3 of water samples were digested in a steam bath in a combination of concentrated acids (HNO3, HCl and H2SO4) in the ratio 5:3:2. The digestion was completed when the mixture turned clear or colorless. The samples were filtered, and the filtrate made up to 50 cm3 with deionized water. The final filtered digest was analyzed for heavy metals using thermo Atomic Elemental Absorption Spectrophotometer (model SE-71906). To reduce error in the analytical results, a blank was run at intervals of 10 sample runs in the machine. Each sample was analyzed three times for every individual metal and the results stated as mean ± standard deviation [11].
Contamination factor (CF), Pollution index (PLI), contamination degree (CD) and modified contamination degree (mCD) were used to evaluate the level of pollution by the heavy metals in the Creek. The interpretations of the different assessment equations were based on proposed intervals of contaminations and pollution descriptions. Contamination Factor was calculated using the equation proposed by Lacatusu [12] as
Contamination Factor (CF) = Cm/Cb
The Pollution Index (PI) was obtained using the equation
Pollution Index (PLI) = n√(CF1 X CF2 X CF3 X… X CFn)
(CF = contamination factor, n = number of metals, Cm = metal concentration in polluted water or sediments,
Cb = background value of the metal or maximum recommended value of the metal in water, sediment or soil).
The contamination (CD) was calculated using the equation proposed by proposed by Hakanson [13] to establish the collective effect of contamination by heavy metals in an environment. The contamination degree equation was applied as:

and the modified contamination degree equation applied was

where
CD = the degree of contamination
CF = contamination factor of the individual metal,
n = the number of the heavy metals investigated
Results and Discussion
Manganese (Mn)
The concentrations of Mn in Edagberi Creek among the stations varied between 0.005 ± 0.003 - 0.486 ± 0.06 mg/L. The mean monthly variation in the concentrations of Mn fall within the range of 0.024 ± 0.00 in April to 0.486 ± 0.21 mg/L in October. The values observed for Mn in the different stations were either lower or higher than the WHO and NAFDAC minimum requirement (0.05 mg/L) for drinking water. The observations on the concentrations of Mn in the present work fall within the range of value observed in in Drini Bardhë River [14] and also within the range of values observed in Orashi River, Rivers State, Nigeria [15]. Mn is abundant metal in natural environments such as soil, sediment and water. Sources of Mn in water can either be natural or anthropogenic. Mn is released into water from rocks washed along as the river flows along its course. Other sources are from runoffs discharged into the river, soil weathering and from industrial and domestic wastewater discharges [16,17].
Mercury (Hg)
The variation in concentrations of Hg in Edagberi Creek fall within the range of Non-Detected (ND) – 0.0006 ± 0.00 mg/L. The observed concentration of Hg in the water samples within the sampled months ranged within non-detected (ND) in December to 0.0006 ± 0.00 mg/L in August. The concentrations of Hg observed from the creek were all lower than the WHO value of 0.006 mg/L and the NAFDAC limit of 0.001 mg/L. the values of Hg in the Edagberi Creek is lower than the observed values in different stations of Silver River [18]. Mercury (Hg) is one of the metals that is not essential for metabolic activities in both plants and animals [19]. Natural sources of Hg in water and the general environment are atmospheric deposition through precipitation and storm water runoffs, while human sources include engineering practices, quarrying and excavation of rocks during search for minerals [18]. Human Contact with Hg whether for a short or long term has different negative physiological outcomes and diseases such as destruction of protoplasm, cough, painful wound in the throat, difficulty in breathing, aching chest, biliousness, queasiness, diarrhea, amplified heartbeat, hypertension, perception of metallic taste in the mouth, touchiness of the eye, worries, loss of vision and deafness [20].
Cadmium (Cd)
The observed concentrations of Cd in Edagberi Creek in the stations varied within the range of Non Detected ND – 0.0008 ± 0.00 mg/L. The observed value range in the concentrations of Cd in the sampled months ranged from non-detected (ND) in February to 0.001 ± 0.00 mg/L in December. The observed values of Cd in the present work were lower than the 0.003 mg/L limit set by the WHO and NAFDAC for drinking water. The values observed for Cd in the present work is lower than those of Edori et al. [19], in Elelenwo River in Rivers State, Nigeria, but either within the same range or lower than the values observed in different Nigerian bodies [21]. The presence of Cd in human, animal or plant tissue has the propensity to infect indispensable amino acids and get stored up in the proximal tubular cells at very high concentrations, which then cause brittleness in bones and further result in form and nature of the kidney and lung. Elevated amount of Cd can lead to malfunctioning of the liver, reduction in the weight of newborn babies, untimely childbirth in expectant women [22]. Others diseased conditions associated with Cd intake are procreative disorder, behavior, cardiac and vascular neurology, hematology and kidney dysfunction, damage of hepatocytes and other vital body organs [23].
Lead (Pb)
The concentrations of Pb in the various stations from Edagberi Creek fall within the range of 0.0006 ± 0.00 - 0.003 ± 0.00 mg/L. The variation in the concentrations of Pb in the months wherein sampling was conducted in Edagberi Creek fall within the range of 0.001 ± 0.00 in December and February to 0.004 ± 0.00 mg/L in April. The concentrations of Pb in the different sample stations and months were all lower than the WHO and NAFDAC set limit of 0.01 mg/L in drinking water. Lead (Pb) concentrations in this work are lower than the values observed by Asonye et al. [21], but within the range observed by Haxhibeqiri et al. [14] in similar works. Lead (Pb) is a toxic metal in human systems. When consumed, causes alterations in different cell pathways which include the bonding of cells, discharge of information by neurons, transmission of information among and between cells, compactness of protein cells, time of maturing of cells, transportations of electrolytes in the body and regulation of the effectiveness of enzymes [24,25]. Elevated levels of Pb in humans can lead to long time destruction of body neurons in newborn and kids [26]. Lead (Pb) is known only for the negative roles it plays in metabolic purposes in biological organisms in the surroundings [27]. The presence of Pb in the environment originates from natural and anthropogenic activities, but majorly from human engineered sources [28]. Some of the human sources of Pb are fossil fuels, elastic tools, batteries, dyes and coating paints, amalgams, insecticides, particle emission inhibition equipment, polyvinyl chloride conduits, cable concealments etc [29].
Copper (Cu)
The concentrations of Cu observed within the stations sampled in Edagberi Creek varied between 0.004 ± 0.00 - 0.058 ± 0.02 mg/L. The variation in the concentrations of Cu in the sampled months as observed ranged from 0.002 ± 0.00 in December to 0.137 ± 0.02 mg/L in April. The values of Cu obtained in the present work were lower than the recommended limit by NAFDAC (1.5 mg/L) and WHO (2.00 mg/L). The concentrations of Cu observed in this work is lower than the values observed in Bomu and Oginigba Rivers in Rivers State, Nigeria [30], but are higher than those of Asonye et al. [21], who did not detect Cu in any of the water samples from various water sources examined. Cu is a known indispensable metal needed for effective breakdown and build-up of cells, but high content in water and food will be able to cause nervous system exasperation, dejection, necrosis in hepatic and renal cells [31]. The maintenance of effective metabolic processes in animal and system is facilitated by Cu and also, its presence in human body prevents certain ailments which disrupt DNA functions in humans [32], which is consequent on heart muscle injury and spinal cord myelination, spots in the colour of the skin, disordered formation of bones and connective tissues and replication [33]. Deficiency of Cu in faunae has some undesirable consequences on the central nervous system (CNS), tissue enzymes, hepatocytes and renal nerves and blood receptacles. However, there are risks of excessive intake and retention in human body of Cu [34]. This is because high concentrations of Cu prevent the activities of enzymes, cause anaemia, dilution of the blood. The enzymes affected by excess Cu in human system include pepsin, aldolases, alkaline phosphodiesterase, lipase adenosine triphosphate, and aminoacyl RNA [35].
Nickel (Ni)
The concentrations range for Ni observed in the different sampled stations in Edagberi Creek differed within the range of 0.176 ± 0.00 - 0.219 ± 0.01 mg/L. The variation of the concentrations of Ni within the sampled months in the Creek fall within the range of 0.167 ± 0.02 in December to 0.271 ± 0.10 mg/L in April. The concentrations of Ni observed in the present work were higher than the WHO and NAFDAC standard or requirement of 0.15 mg/L for drinking water. The observed Ni concentrations in the present work is lower than the values of Nwineewii et al. [36], in New Calabar River and also those of Ekpete et al. [18], in Silver River, Bayelsa State, Nigeria. Ni compounds are very useful in battery production industries, ceramic manufacturing companies as colourants and as catalyst in different chemical processes. High level consumption of Ni has different physiological effects on laboratory test animals and can cause deadly lung infection [37]. In life-lethal conditions and declining intake and exchange of gases in and out of the lungs, it is likely to facilitate death. Those working in metallurgic industries are susceptible to Ni harm due to Ni dust arising from the production process especially having worked for a long time. Human exposures to Ni have been controlled not to exceed 0.05 mg/cm³ in Ni equivalents within a time interval of 40-hour period in a week. Ni dust and its compounds are considered as carcinogens [37].
Iron (Fe)
The observed variations in the stations concentrations of Fe in Edabgeri Creek fall within a value range of 0.028 ± 0.00 - 0.075 ± 0.03 mg/L. The observed changes in the concentrations of Fe in the different months of sampling in the creek ranged from 0.006 ± 0.00 in December to 0.324 ± 0.12 mg/L in April. The measured concentrations of Fe in the present study were generally lower than the value of 0.3 mg/L stipulated by WHO and NAFDAC for drinking water. Iron (Fe) values in the Edagberi Creek is lower than those of Nwineewii et al. [36] Haxhibeqiri et al. [14], but within the value range observed by Asonye et al. [21] in similar research study. Iron (Fe) is very important in various human natural biochemical purposes. Regardless of the fact that Fe facilitates different enzyme functions in plants and animals, yet it is poisonous to man if present at high levels in the tissues and organs [38]. Iron (Fe) when present as Fe3+ oxide in water damages fish gills and also reduce the amount of oxygen intake according Ogaga et al. [39], thereby disturbing the regular respirational procedures of the fish. Iron (Fe) is beneficial to mammals because of hemolytic characteristics by helping to transport oxygen throughout the body. It also helps in the biomolecules which are very useful facilitating the different functions of blood. According to Sundaray et al. [40] and Action [41], the two species of Fe in water are Fe2+ and Fe3+, which are different in strength, stability and solubility and as such the rate of their absorption into different tissues of biotic organism is controlled based on these three factors and other environmental favourable conditions.
Chromium (Cr)
The concentrations of Cr in the different sampled stations in Edabgeri Creek varied between 0.003 ± 0.00 and 0.015 ± 0.00 mg/L. The observed changes or variation in the concentrations of Cr in the sampled months in the creek were within the range of 0.002 ± 0.00 in the months of December and February to 0.017 ± 0.00 mg/L in August and October. The observed concentrations of Cr in all the stations and months were lower than the WHO and NAFDAC recommended value of 0.05mg/L in domestic water usage. The values of Cr observed in the creek when compared with other works in similar environments showed that the values were lower than those observed in some rivers in Niger Delta Nigeria [30,36,18] Chromium (Cr) has been identified to cause different haematological problems in fish. The effects include reduction in serum hemoglobin, erythrocytes count and thrombocytes. Others are degeneration of proteins, fats and sterols and glycogen [23]. Chromium (Cr) although is an essential micronutrient required by both animals and plants, yet is also a pollutant when found in the environment at elevated concentrations above the accepted value [42]. Anthropogenic activities have only contributed little to the actual concentration of Cr in the environment, but only in extraction activities where Cr deposits are found and geologic compositions of rocks where humans may have interfered with. Chromium (Cr) perturbs fish behavior and physiology at high concentrations, but may not lead to mortality of fishes in majority of the cases. Any environment with high values may probably be affected by effluents discharged by manufacturing and quarrying activities [43].
Zinc (Zn)
The variations in the concentrations of Zn in the different Stations in Edabgeri Creek fall between the ranges of 0.016 ± 0.00 - 0.076 ± 0.00 mg/L. In the creek, it was observed that the concentrations of Zn in the different months of sampling varied from 0.011 ± 0.00 in December to 0.263 ± 0.11 mg/L in April. The observed concentrations of Zn in the water from the creek were lower than the WHO and NAFDAC required limit of 5.0 mg/L for potable water. Zinc (Zn) concentrations from the creek is within the value range observed in a similar environment being the Orashi River by Odoemelam et al. [15], but lower than those of Elelenwo River (Edori et al.) and Bomu and Oginigba Rivers [30]. Zn is a requisite element in human system because of the different biochemical and metabolic roles it plays in body tissues and cell growth. The presence of concentrated values of Zn may possibly lead to intestinal itching, queasiness, despondency, ailment and cough, which however, are temporal [44,45]. Although, there have not been any experimental or scientific proof of physiological problems when Zn is taken-up at concentrations more than 5 mg/L, it is known to lead to bitter taste of water and increase opacity especially at alkaline pH in domestic water [46] Sources of Zn discharges or input into rivers are effluents from industries, runoffs, washing of the surface of soil by the sea or river shore which contains Zn. In fishes living within a contaminated water environment, it alters the nature of the distribution of other important trace metal by the liver. When found deficient in human system, it can possibly cause hypogonadism with its associated compromised reproductive ability, development impedance; dermatitis, anorexia and inability of wounds to get healed on time (Tables 2 & 3).
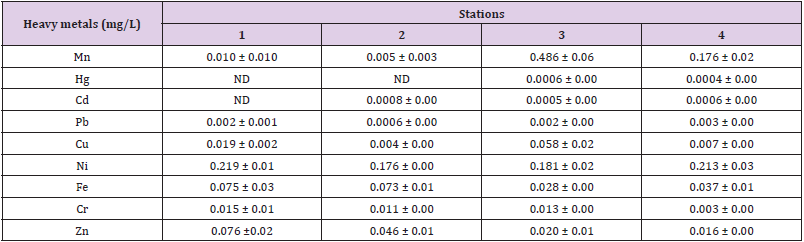
Table 2: Heavy Metals Concentrations in Water Samples from Taylor Creek at the Different Sample Stations.
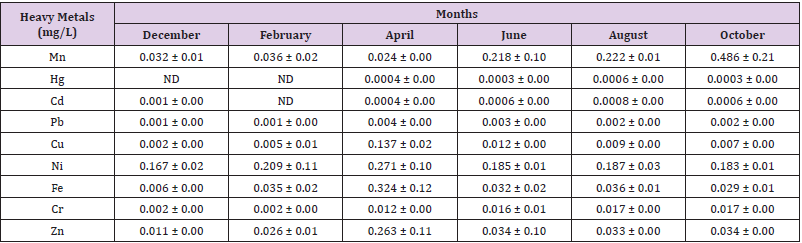
Table 3: Mean Monthly Variation of Heavy Metals Concentrations in Water Samples from Taylor Creek.
Pollution Indices for Estimation of Heavy Metals Pollution in Water
A. Contamination Factor
The contamination factor of heavy metals in the Creeks and River is given in Table 4. The contamination data obtained from the different stations in the Edagberi Creek when interpreted on the basis of intervals of contamination proposed by Lacatusu [12], showed that the water samples were slightly contaminated in station 1 and 2, moderately polluted in Station 4 and severely polluted in station 3 with Mn. The samples were practically uncontaminated with Hg in station 1, 2 and 4, but in station 3, it is a very slight contamination. The values obtained for Cd in the stations indicated no contamination at station 1, but slight contamination at stations, 3 and 4 and moderate contamination at station 2. The values obtained for Pb showed non contamination at 2, slight contamination at stations 1 and 3 and moderate contamination at station 4. The values obtained for Cu and Zn in all the stations (1-4) showed that the water was practically non contamination with Cu and Zn. The analysis of the values obtained for Ni in the water samples from the different stations (1-4) indicated moderate pollution of the water samples with Ni. The interpretation of the values obtained for Fe in the examined water samples showed non contamination in station 3 and slight contamination in stations 1, 2 and 4 with Fe. The values obtained for Cr indicated non contamination at station 4, slight contamination at station 2 and moderate contamination at stations 1 and 3 (Table 4).
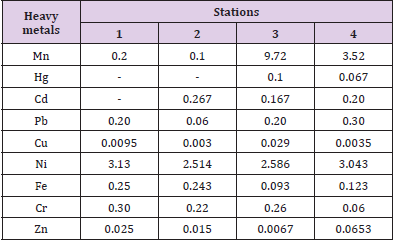
Table 4: Contamination Factor Analysis of Heavy Metals Contamination of Water Samples from the Different Stations in Taylor Creek.
Pollution Index, Contamination Degree and Modified Contamination Degree of Water Samples
The levels of pollution index and degree of contamination and modified degree of contamination of the water from the different stations in Edagberi Creek are shown in Table 5. The pollution index results obtained from the stations when examined with the intervals of pollution index assessment as proposed by Zhang et al. [47] indicated that all the stations from Edagberi Creek were not polluted with heavy metals. This is based on the fact that all the results fall within the category of (0 < PLI ≤ 1), which represents unpolluted environment with heavy metals. The assessment of the results of heavy metals in water samples based on the contamination degree evaluation as proposed by Hakanson [13] indicated that in Edagberi Creek, stations 1, 2 and 4 showed low contamination degree, while station 3 showed moderate contamination degree. The Hakanson [13] classification for the interpretation and description of modified contamination degree showed that all the values obtained in Edagberi Creek in the different stations analyzed fall within the category of nil to very low degree of contamination (mCD < 1.5) (Table 5).
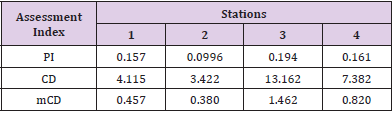
Table 5: Pollution Index, Contamination Degree and Modified Contamination Degree of Water Samples from Taylor Creek.
Conclusion
The observations from the concentrations of heavy metals in the creek showed that there were slight spatial and temporal variations. The observed values indicated that water has been contaminated with some the metals above acceptable limits for drinking. Therefore, for the water to be safe for human consumption there must be little treatment. More so, adequate monitoring of the creek and enlightenment of the rural dwellers should be put in place, so that the usability of the water can be restored to its natural state where the locals were using it as the only source of water for drinking and other domestic uses.
References
- Williams AB, Benson NU (2010) Interseasonal hydrological characteristics and variabilities in surface water of tropical estuarine ecosystems within Niger Delta, Nigeria. Environmental Monitoring and Assessment, 165: 399-404.
- Edori OS, Kpee F (2018) Assessment of heavy metals content in water at effluents discharge points into the New Calabar River, Port Harcourt, Southern Nigeria. Global Journal of Science Frontier Research (B) 18(2): 52-58.
- Uzoekwe SA, Achudume AC (2011) Pollution Status and Effect of Crude Oil Spillage in Ughoton Stream Ecosystem in Niger Delta. Journal of Ecology and the Natural Environment 3: 469-473.
- Abam A (1999) The Okrika Kingdom: An Analysis of the Dynamics of Historical Events. 1st Springfield Publishers, Owerri, Nigeria, pp: 2- 12.
- Ghosh M, Singh SP (2005) A review on phytoremediation of heavy metals and utilization of its byproducts. Applied Ecology and Environmental Research 3(1): 1-18.
- Iyama, WA, Edori OS, Ikpe S (2014) Study of pollution levels in Ahoada-Ihuaba axis of Sombreiro River, Ahoada Rivers State, Nigeria. International Research Journal of Pure & Applied Chemistry 4(4): 378-387.
- Hogstand C, Haux C (2011) Binding and detoxification of heavy metals in lower vertebrates with reference to metallothionein. Comparative Biochemistry and Physiology C 100: 137-214.
- Damek Proprawa M, Sawicka Kapusta K (2003) Damage to the liver, kidney and testes with reference to burden of heavy metals in yellow-necked mice from areas around steel workers and zinc smelters in Poland. Toxicology 86: 1-10.
- Edori OS, Marcus AC (2017) Phytochemical Screening and Physiologic Functions of Metals in Seed and Peel of Citrullus lanatus (Watermelon). International Journal of Green and Herbal Chemistry 6(1): 35-46.
- Ekpenyong SN, Udofia SU (2015) Oil Pollution and Its Impact on Water Quality in Ibeno Community. Studies in Sociology of Science 6(2): 8-12.
- Sehgal M, Garg A, Suresh R, Dagar P (2012) Heavy metal contamination in the Delhi Segment of Yamuna basin. Environmental Monitoring and Assessment 184: 1181-1196.
- Lacatusu R (2000) Appraising levels of soil contamination and pollution with heavy metals. European Soil Bureau Research Report 4: 393-402.
- Håkanson L (1980) Ecological risk index for aquatic pollution control, a sedimentological approach. Water Research 14: 975-1001.
- Haxhibeqiri B, Alikaj M, Brahushi F (2015) Occurrence of heavy metals in Drini Bardhë River. Agroenvironment and Ecology 4(2): 200-204.
- Odoemelam SA, Edori OS, Ogbuagu NM (2019) Assessment of Heavy Metal Status of Orashi River Along the Engenni Axis, Rivers State of Nigeria. Communication in Physical Sciences 4(2): 74-80.
- Nádaská G, Lesný J, Michalík I (2010) Environmental aspect of manganese chemistry. Hungarian Journal of Sciences ENV-100702-A: 1-16.
- Mesıas M, Seiquer I, Pilar NM (2013) Iron nutrition in adolescence. Critical Review in Food Science and Nutrition 53(11): 1226-1237.
- Ekpete OA, Edori OS, Kieri BSI (2019) Assessment of heavy metals concentrations in surficial water of Silver River, Southern Ijaw, Bayelsa State, Niger Delta, Nigeria. Journal of Basic and Applied Research International 25(4): 186-193.
- Edori OS, Iyama WA, Amadi MC (2019) Status of Heavy Metals Contamination in Water from Elelenwo River, Obio-Akpor, Rivers State, Nigeria. Direct Research Journal of Chemistry and Material Science 6(3): 25-31.
- Environmental Fact Sheet (EFS) (2003) Mercury: Sources, Transport, Deposition, and Impacts. New Hampshire Department of Environmental Services, New Hampshire, 03301, UK.
- Asonye CC, Okolie NP, Okenwa EE, Iwuanyanwu UG (2007) Some physico-chemical characteristics and heavy metal profiles of Nigerian rivers, streams and waterways. African Journal of Biotechnology 6(5): 617-624.
- Adelekan BA, Alawode AO (2011) Contributions of municipal refuse dumps to heavy metals concentrations in soil profile and groundwater in Ibadan Nigeria. Journal of Applied Biosciences 40: 2727-2737.
- Hanser R, Marrion H (2009) Articles on natural medicine, “The dangers of heavy metals. Environmental Health Perspectives 89: 91-94.
- Tirkey A, Shrivastava P, Saxena A (2012) Bioaccumulation of heavy metals in different components of two Lakes ecosystem. Current World Environment 7(2): 293-297.
- Puri P J, Yenkie MKN, Kharkate SK, Choudhary AV, Borkar TC (2015) Assessment of heavy metal contents in surface water-bodies (lakes). International Journal of Advances in Science Engineering and Technology 1: 21-26.
- Lawson EO (2011) Physico-Chemical Parameters and Heavy Metal Contents of Water from the Mangrove Swamps of Lagos Lagoon, Lagos, Nigeria. Biological Resources 5(1): 8-21.
- Brochin R, Leone S, Phillips D, Shepard N, Zisa D, et al. (2008) The cellular effect of lead poisoning and its clinical picture. Journal of Health Science 5(2): 1-8.
- Adebanjo JA, Adedeji WO (2019) Studies on heavy metals contents of Osun River at the pre-urban settlement and across Osogbo City, Nigeria. Journal of Taibah University for Science 13(1): 318-323.
- Bytyçi P, Fetoshi O, Durmishi BH, Etemi FZ, Çadraku H, et al. (2018) Status Assessment of Heavy Metals in Water of the Lepenci River Basin, Kosova. Journal of Ecological Engineering 19(5): 19-32.
- Marcus AC, Edori OS (2016) Assessment of contamination status of Bomu and Oginigba Rivers, Rivers State, Nigeria, using some trace metals and Callinectes gladiator as indices. Chemical Science International Journal 17(4): 1-10.
- Edori OS, Kpee F (2016) Physicochemical and heavy metals assessment of water samples from boreholes near some abattoirs in Port Harcourt, Rivers State, Nigeria. American Chemical Science Journal 14: 1-8.
- Anderson M (1997) Long term copper availability and adsorption in a sludge amended Davidson clay loam. Dissertation, April 1997, Blacksburg, VA, USA.
- Buck W (1978) Copper/molybdenum toxicity in animals: Toxicity of heavy metals in the environment, Part I, edited by FW Oehme, Marcel Dekker, Inc. New York and Basel, USA.
- Howell J, Gawthorne J (1987) Copper in Animals and Man. Volume II CRC Press, Inc. Boca Raton, Florida, USA.
- Owens C (1981) Copper Deficiency and Toxicity. Noyes Publications, Park Ridge, New Jersey, USA.
- Nwineewii JD, Edori OS, Marcus AC (2019) Heavy metal content in surface water and crab (Potamon fluviatile) from New Calabar River, Rivers State, Niger Delta Nigeria. Journal of Chemical Society of Nigeria, 44(6): 1035-1043.
- (2005) ATSDR, Agency for Toxic Substances and Disease Registry, Public health statement on Nickel. A division of Toxicology, Department of Health and Human Services, Public Health Service National Technical Information Service (NTIS) 5285 Port Royal Road Springfield, VA 22161, USA.
- Abbaspour N, Hurrell R, Kelishadi R (2014) Review on iron and its importance for human health. Journal of Research in Medical Sciences 19(2): 164 -174.
- Ogaga AA, Faith AM, Sylvester CL (2018) Impacts of anthropogenic activities on heavy metal levels in surface water of Nun River around Gbarantoru and Tombia towns, Bayelsa State, Nigeria. Annals of Ecology and Environmental Science 2: 1-8.
- Sundaray SK, Nayak BB, Kanungo TK, Bhatta D (2012) Dynamics and quantification of dissolved heavy metals in the Mahanadi river estuarine system, India. Environmental monitoring and assessment 184(2): 1157-1179.
- Action QA (2013) Advances in Oxygen Research and Application. Scholarly Brief, Atlanta, Georgia p. 306.
- Rajappa B, Manjappa S, Puttaiah ET (2010) Monitoring of Heavy metal in groundwater of HakinakaTaluk, India. Contemporary Engineering Sciences 3(4): 183-190.
- Krishna PV, Rao KM, Swaruparani V, Rao DS (2014) Heavy metal concentrations in Fish Mugilcephalus from Machilipatnam Coast and possible health risks to fish consumers. British Biotechnology Journal 4(2): 126-135.
- Rodier J (2009) Lanalyse de L’eau, (9th ), Dunod: Paris, France, p. 1526.
- Tepe Y (2014) Toxic Metals: Trace Metals- Chromium, Nickel, Copper, and Aluminum, In Encyclopedia of Food Safety, edited by Yasmine Motarjemi,, Academic Press, Waltham, pp. 356-362.
- Ngaram N, Yohann C, Alain M, Tchadanaye NM, Pierre L (2017) Heavy metal pollution of Chari River water during the crossing of N’Djamena (Chad) Toxics 5: 1-12.
- Zhang C, Qiao Q, Piper JDA, Huang B (2011) Assessment of heavy metal pollution from a Fe-smelting plant in urban river sediments using environmental magnetic and geochemical methods. Environmental Pollution 159(10): 3057- 3070.
