 Research Article
Abstract
Background: Drug provocation is the gold standard test in drug hypersensitivity reactions. It is time and Resources consuming. Heart rate variability (HRV) is a useful tool to help diagnose non-cardiac diseases in a non-invasive way.
Objective: To explore the use of an electronic system able to analyze HRV, to precociously detect allergic Reactions during drug provocation test (DPT).
Methods: Patients with suspected drug hypersensitivity were prospectively studied and classified as allergic or non-allergic after a DPT. A portable device able to acquire the ECG signal and to process it in real time was placed on the patients during the test. Changes in HRV were processed using mathematical algorithm in order to automatically detect the onset of the allergic reaction. Data of DPT and electronic system results were recorded and analyzed in a separate and independent manner.
Results: One hundred and thirty-five patients were studied, 8 of them were diagnosed with drug Hypersensitivity after a positive provocation test (5.9%). The automatic analysis showed a positive result in 23 patients. Sensitivity and specificity were 75% and 91.7% when no steroidal anti-inflammatory drugs DPT were excluded. The global negative predictive value was 98.6%. The electronic system was able to detect the allergic reaction at least 90 minutes before the onset of symptoms.
Conclusions: The use of an electronic computerized system for processing HRV can be a useful tool in drug Hypersensitivity diagnosis. It detects the allergic reaction before the appearance of physical symptoms, which improves the patients’ safety during a drug allergy study?
Highlights Box
1. Heart rate variability is a useful tool to help diagnose non-cardiac diseases in a non-invasive way. It is able to detect allergic reactions.
2. The analysis of heart rate variability can detect the allergic reaction during a drug provocation test even before the appearance of physical symptoms, except for no steroidal anti-inflammatory drugs.
3. It improves the safety of the patients during a drug allergy study and optimizes hospital resources.
Keywords: Heart Rate Variability; Drug Hypersensitivity; Drug Provocation Test; Electronic System; Drug Hypersensitivity Diagnosis
Abbreviations: ANS: Autonomic Nervous System; DHS: Drug Hypersensitivity; DPT: Drug Provocation Test; HRV: Heart Rate Variability; NSAID: No Steroidal Anti-Inflammatory Drugs
Introduction
Drug hyper sensitivity (DHS) is an important cause of an a phyla axis in adults [1,2]. The prevalence of self- Reported DHS is 8.5% in general population [3]. Patients mislabeling of allergies limit their therapeutic options, with the use of second-line drugs, increasing health costs [4,5], the time of hospitalization and Patients’ morbidity [6,7]. Therefore, it represents an important public health problem so allergy work-out should be as complete as possible. It includes clinical history, skin test, laboratory tests if available and, in some cases, drug provocation test. In the diagnostic study for drug hypersensitivity reactions drug provocation test (DPT) is considered the gold standard to establish or exclude the diagnosis of DHS [8]. DPT requires clinical expertise, time and hospital resources and has in here tricks [9]. It is usually restricted to specialist centers in which equipment, supplies, and personnel are present to manage serious reactions, and that personnel are well trained and experienced in performing this procedure in properly selected patients [8]. Improvement of the safety profile of DPT is therefore a matter of concern. Heart rate variability (HRV) can have a diagnostic relevance. Thanks to the ease of acquiring this signal, it has become a very useful tool to help diagnose non-cardiac diseases in a non-invasive way [10]. Its use has generated a great interest in several engineering investigation groups. Several parameters of heart rate Variability have been established. They could help not only to reach a diagnosis of several diseases but also to encourage their study with the goal of correlating these parameters with patients’ health situation, both in the physical and mental aspects [11].
Studies have been carried out on sero positive and diabetic Patients [12]; on the correlation with external factors that affect cardiac function [13]; and on the relationship between HRV and health status [14,15]. Recent research on HRV applicability focuses on two directions: novel devices and their use in different medical areas. A non-invasive system for monitoring the electrocardiographic signal composed of 8 textiles electrodes settled in a line on sheets has been developed. It allows the patient´s comfort without reducing the system´s efficiency [16]. Data on the use of mobile phones for measuring HRV, breathing frequency and oxygen saturation have been published [17]. The main advantage of their use is the economical saving and the patients’ implication in their own care. A wireless sensor platform has been developed for Measuring HRV [18]. Its specificity allows optimizing power consumption and time process. In order to discriminate between healthy subjects and patients, studies of “short-term” parameters of HRV have been performed [19]. The authors have proposed a classification model based on the specific parameters of HRV. Studies of “long-term” (typically measured during 24 hours) parameters have been performed to detect physical conditions of the individuals with the use of intelligent computing algorithms [20,21]. The results have been used to analyze patients with Parkinson disease and children with seps are [22].
The design of algorithms for automated analysis of ECG data has been an area of research for more than 40 Years. QRS detection algorithms are needed to analyze ECG recordings generated in telehealth environments. They automatically locate QRS complex and calculate HRV [23-25]. Few data on the field of allergology are available. Several studies evaluating patients with allergic rhinitis and bronchial asthma have been performed [26-30]. A study carried out in Cork University Hospital (Cork, Ireland) with 24 pediatric patients undergoing food challenge tests [31] showed a link between HRV and the development of allergic reactions. In this paper, the normal (i.e., non allergic) HRV features are modeled with Gaussian mixture models (GMMs). From ECG data recorded during oral food challenge tests, QRS points are extracted by an automatic QRS detector. HRV features are extracted from these points. A GMM is then utilized to continuously estimate the likelihoods that the subject has no allergic symptoms during the food challenges. After post processing the likelihoods, a decision was made as to whether the subject is allergic to a food type or not. This electronic system showed high sensitivity and specificity and was able to detect allergy reactions on average 17 min earlier than trained clinicians.
Aim of the Study
The objective of this study is to analyze the utility of an electronic system that implement a diagnostic algorithm for automatic analysis of HRV, to early detect the allergic reactions during the realization of a drug provocation test. Allergists and an engineering team were participating in this novel line of research.
Patients and Method
This was a prospective observational study carried out in the Allergy Section of the University Hospital of Guadalajara, Spain. The clinical work included patient’s ent to the allergy service with suspected drug hypersensitivity who underwent to a DPT as a part of usual clinical practice. The period of analysis was from February 2015 to February 2016. The study was approved by the hospital Ethics Committee
Patients
Inclusion criteria: 1. Patients older than 12 years, who experienced a drug reaction that clinically resemble Allergy [32] and at the end of the step wise approach a drug provocation test, was indicated following the EAACI-DAIG/ENDA guideline to establish or exclude the diagnosis of drug hypersensitivity [9] and 2. Those who agreed to undergo a DPT and to participate in this study.
Exclusion criteria: 1. Patients who refused to undergo a DPT or to participate in the study; 2. Who suffered non-controllable and/or severe life-threating drug hypersensitivity reactions in which DPT was Contraindicated [9]; 3. Those who presented severe concurrent illness or pregnancy; 4.or patients with arrhythmia. Written informed consent was obtained in all the cases.
Material
In this study a system able to acquire the ECG signal and to process it in order to warn about the onset of allergic reactions was used. The complete system was composed of a Shimmer device [18] and a host (a computer) as (Figure 1) shows The Shimmer device acquired the ECG signal during the provocation test. It is a portable device, small, light (23.6g), robust and with low power consumption, and it is able to store the measured data in its internal memory card and send it via Bluetooth. Furthermore, it is capable to measure, store and send the acquired data related to the inertial sensors (3-axisaccelerometer, 3-axisgyro scope and 3-axis magneto meter). An advantage of this system is that the patients can move freely with the device in their pocket. This device uses a differential measure men to the ECG signal from the three electrodes placed on the patient’s chest with the E in throve configuration. The allergic reaction detection algorithm that will be described below was running in the host which received the ECG signal from the Shimmer via Bluetooth.
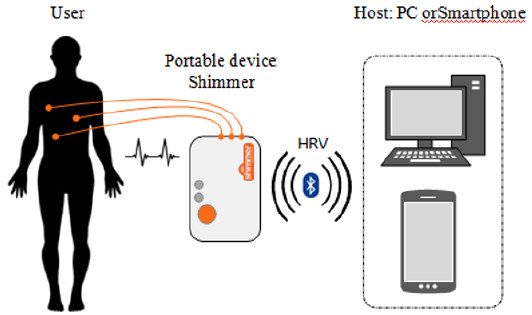
Figure 1: Electronic system for the early detection of allergic reactions.
Drug Provocation Test
It is the gold standard test for diagnosing drug allergy [9]. A single-blind DPT was performed following the Usual protocol of the Allergy Section by administering increasing doses at 30 minutes intervals (60 minutes in case of NSAID), till reaching therapeutic doses or the onset of clinical symptoms of a hypersensitivity reaction, according to the recommendations of the European Academy of Allergy and Clinical Immunology [8]. Most of the drugs were administered in three doses: 25%, 50% and 100% of the therapeutically dose. After the DPT patients were classified as allergic, if clinical symptoms of a hypersensitivity reaction were documented, or non-allergic when a good tolerance to the administered drug was achieved.
Working Protocol
Patient’s Evaluation: Every patient was evaluated before the starting of the test, including blood pressure, heart rate, peripheral arterial oxygen saturation and peak-flow measurement.
Back Ground Period: Before the onset of DPT. Placing of the Shimmer device and measurement during 10 minutes. Patient´s movements could hamper the correct detection of HRV. During these 10 minutes the detected signal is averaged out, which reduces the effect of incorrect QRS complex detection.
DPT Period: A single-blind DPT was performed as explained before until reaching therapeutic doses or the onset of an allergic reaction. Patients were classified as allergic or non-allergic after evaluating the clinical picture. (Figure 2) summarizes a generic provocation test.
HRV analysis during DPT: In this work, a QRS complex detector previously proposed by the authors has been used [24].
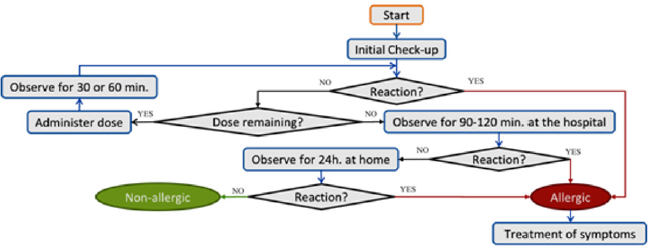
Figure 2: Drug provocation test flowchart.
The QRS complex detector provides the instant of time when each R peak is detected. Through these detections, we calculate the HRV. We have checked that there is a relationship between changes on several patients’ HRV signal and the onset of hypersensitivity reactions. After an in-depth analysis, the results demonstrate that the HRV mean feature (from now on MRR signal) provides useful information regarding the physiological changes produced by a hypersensitivity reaction. The MRR signal is computed in a 60-second window with1-second shift. (Figure3) shows an example of the differences between the MRR signal (black solid line) of an allergic and a non-allergic patient during a DPT. The background data has been shadowed with grey, and each one of the check-up periods (in which new doses of the allergen are given to the patients) has been colored with light blue. As (Figure 3) shows, the MRR signal of the patient has arrange and standard deviation much higher in the case of the allergic patient. We have proposed a mathematical algorithm [33] to detect these changes. (Figure 4) represents the flow chart of the designed allergy detection algorithm. It is composed of the following stages:
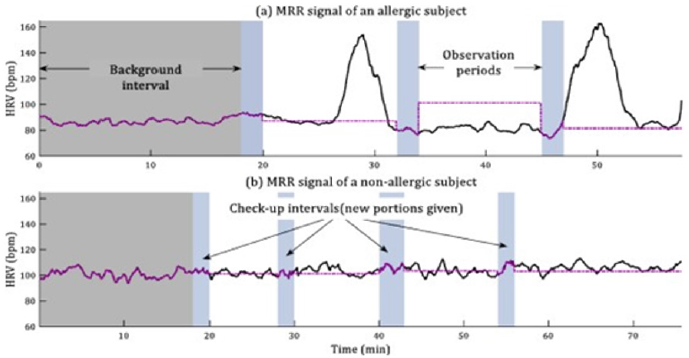
Figure 3: MRR signal of allergic and non-allergic patients.
Note: MRR signal of an allergic (a) and a non-allergic (b) patients. Purple dotted line represents the mean value of the MRR signal during each “background” period, or MBG signal.
MRR= Heart rate variability mean feature; MBG= Mean value of MRR signal during the background period (period prior to the first drug provocation dose).
1. When the first check-upends, the mean of the MRR signal from the beginning of the test is computed. This is a reference signal, called MBG (in purple in (Figure 3). This signal represents the normal HRV of each subject.
2. During the following observation period, the MRR signal is compared with the background data, i.e. the MBG value is subtracted from each new sample of the MRR signal. The result of this operation provides the NMRR signal (Normalized MRR). This signal represent how different is the MRR signal from the background data, i.e. how the actual value of the mean HRV differ from its ‘normal’ value. (Figure 5) represents the NMRR signal for an allergic subject and a non-allergic one (b).
3. The mean value of the NMRR signal during each increment has been computed, the obtained result is called Mean Peak .If the value of a Mean Peak is higher than a threshold (Th), it is considered a hyper sensitivity reaction.
4. When the next Check-Up starts, the last observation period is considered as the new background interval and the algorithm returns to the first stage. It is required to fix the value of the parameter Th to distinguish between allergic and nonallergic patients. We have carried out a study with 24patients [33], and the results indicate that the suitable value of the threshold Th is 10 (Th=10).
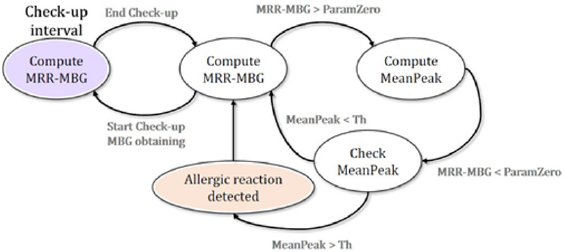
Figure 4: Flow chart of the proposed allergy detection algorithm.
Note: MRR= Heart rate variability mean feature; MBG= Mean value of MRR signal during the background period (period prior to the first drug provocation dose).
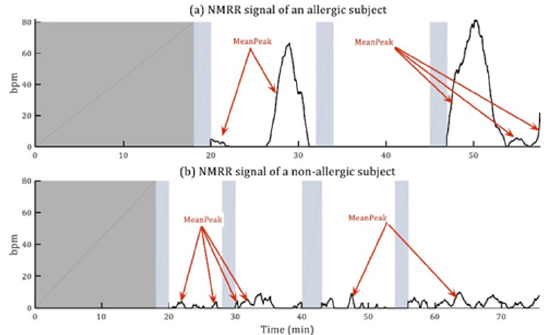
Figure 5: Normalized HRV mean feature (NMRR) signal for an allergic
(a) and a non-allergic
(b) subject.
Data Collection
We included data on age (date of birth), gender, heart rate, blood pressure, and peripheral arterial oxygen saturation and peak-flow results. The initial drug hypersensitivity reaction was graded in accordance with the World Allergy Organization (WAO) classification as reported by Cox et al [34]. Involved drug and group from which it belonged (antibiotics, NSAID…) were specified. Data of gold standard test (DPT) and test to validate (electronic system) were recorded: administered doses, positive or negative DPT, electronic detection (positive or negative), time of onset of clinical symptoms and time of detection of HRV signal with the proposed electronic system. To guarantee the objectivity of the data analysis, the allergists attending DPT and the engineers who evaluated signals from the Shimmer device and computerized algorithm analysis classified patients as allergic or non-allergic in a separate and independent manner.
Statistical Analysis
Quantitative variables are presented as medians with corresponding inter quartile ranges (IQRs). Categorical variables are shown as percentages. To quantify the HRV diagnostic accuracy we evaluated sensitivity, specificity, predictive positive and negative values, likelihood ratios, and you den index. ROC curve analysis and area under the curve (AUC) scores were obtained. The Youden’s index, the indicator that combines the highest positive and negative predictive values, was used to select the optimal Cutoff. All statistical analyses were performed using SPSS Statistics 22 (SPSSInc., Chicago, IL).
Results
Sample Profile
A total number of 135 patients were studied: 89 women, 46 men, mean age 41.7 years (IQR29.95–50.95 y). Grade 1 reaction was the most frequent (73.3%) reaction presented, followed by Grade 3 reactions (13.3%). Coetaneous tests were negative in all the patients tested. They were not performed in 26 patients (19.2%), all of them undergone NSAIDs studies. A total number of 92 patients (68.1%) were challenged with the suspected offending drug and 43 (31.9%) with an alternative drug from the same chemical group. Clinical and demographic data are summarized in (Table1). Drugs tested included 47 NSAID, 60 antibiotics (50 Beta-lactam) and 28 other drugs (2 monoclonal antibodies, 5local anesthetics, 3antihistaminesH1, 1antihistamineH2, 3pump proton inhibitors, 4 opioids, 4 corticosteroids, 2 benzodiazepines, 1, antimycotic, 1 antitussive, 1 ACE inhibitors and 1statin).
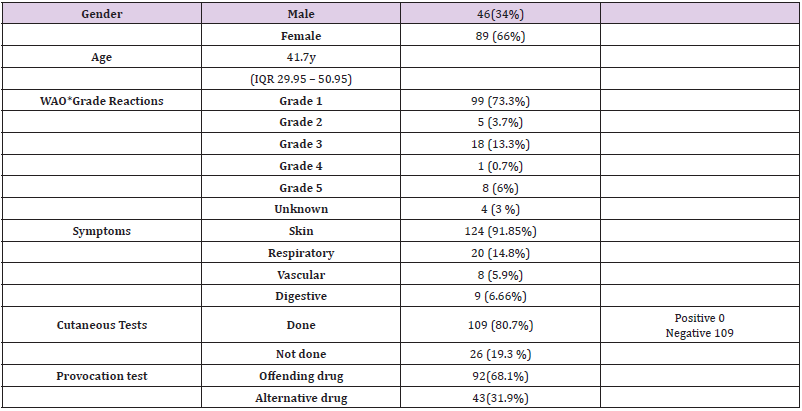
Table 1: Clinical and demographic data in the 135 patients.
Note: Gender: M= Male, F= Female; Age (y)= years;
*Cox LS (2017) J Allergy Clin Immunol Pract 5: 58-62.
Drug Hypersensitivity Diagnosis
Eight out of the 135 patients were diagnosed with drug hypersensitivity after the positive provocation test (5.9%). The 8 positive DPT and their characteristics are described in (Table 2). Symptoms were coetaneous In 7 patients and respiratory in 2. Meantime of onset of symptoms after the last administrated dose was 39 minutes. Two patients suffered a delayed reaction 8 and 14 hours respectively, after receiving the last dose.
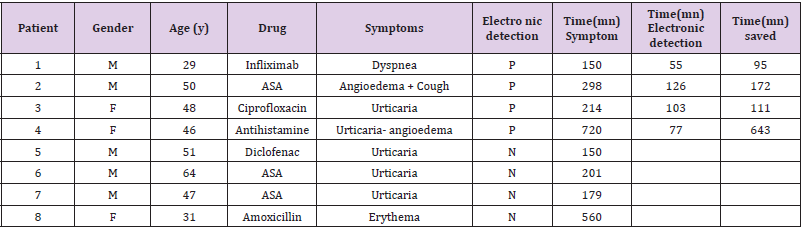
Table 2: Patients who developed a positive provocation test.
Note: Gender: M= Male, F= Female; Age (y)= years; Electronic detection: P = Positive, N= Negative; (mn) = Minutes; Time (mn) Symptoms= minutes from the onset of the provocation test and the development of clinical symptoms; Time(mn) Electronic detection= minutes from the onset of the provocation test and the detection of the positive HRV signal in the electronic device; Time (mn) saved = minutes saved if the drug provocation test was stopped when the HRV signal appeared instead of waiting for the clinical symptoms onset.
ASA= Acetyl salicylic acid Patients No 4 and 8 experienced a no-immediate hypersensitivity reaction.
Positive Electronic Detection
The electronic detection showed a positive result in 23 patients and a negative one in 112. Patient’s characteristics are detailed in (Table 3). Its global sensitivity and specificity were 50% (95% CI: 15.4 -84.6) And 89.7% (95%CI:93.6-97.5) respectively. When NSAIDDPT were ruled out the results improved reaching 75% (95%CI:32.6-100) sensitivity and 91.7%(95%CI:85.8–97.6) specificity. The global negative predictive value was 98.6%. The detection was evidenced at least 90 minutes before the onset of symptoms. Accuracy is shown in (Table 4). Receiver operating characteristic (ROC) curve analysis in (Figure 6) shows how the electronic system can predict that a patient will developed an allergic reaction during the DPT (area under curve AUC:0.85,95%CI:0.6-1). It must be remarked that none of the patients who had a false negative result experienced a severe reaction during the DPT.
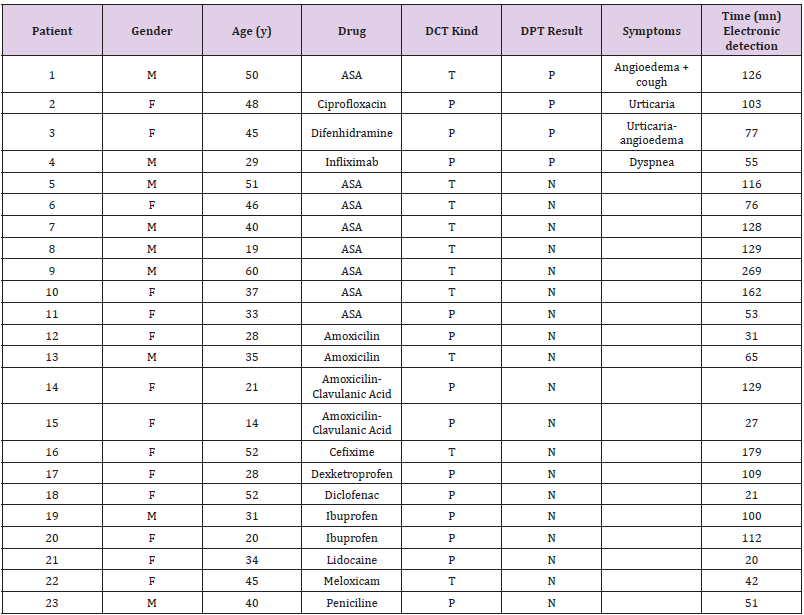
Table 3: Patients who developed a positive electronic detection.
Note: Gender: M= Male, F= Female; Age (y)= years; DPT result= Drug provocation test result: P = Positive, N= Negative; DCT kind= Kind of Drug challenge test: P = provocation with the offending drug, T= Tolerance with an alternative drug; (mn) = minutes; Time(mn) Electronic detection= minutes from the onset of the provocation test and the detection of the positive HRV signal in the electronic device.

Table 4: Accuracy of HRV algorithm detection.
Note: Se= Sensitivity; Sp= Specificity; PPV= Positive predictive value; NPV= Negative predictive value; PLR= Positive likelihood ratio; NLR= Negative likelihood ratio; AUROC= area under the curve; Y= Youden index; NSAIDs= No steroidal anti-inflammatory drugs; () = Confidence Interval.
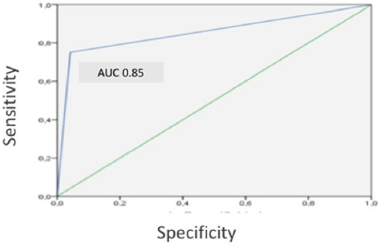
Figure 6: ROC Curve for drugs except N SAID.
Note: ROC curve analysis showing how the electronic system can predict an allergic reaction during drug provocation test, excluding NSAID (Nonsteroidal anti-inflammatory drugs). AUC= area under curve (0.85, 95% CI 0.6 –1).
Discussion
In this study an algorithm capable of detecting hypersensitivity reactions in real time has been used in Adults who underwent a DPT. In a previous study, focused on food provocation test in children, the effect of an allergic reaction in the HRV was analyzed, showing that was notice able even before the appearance of physical symptoms in most patients who suffered an allergic reaction. However, this method was not suitable since the computational complexity of the model designed required hours of analysis to perform that detection [31]. DPT consumes time and requires resources. Furthermore, they could trigger reactions potentially severe. A diagnostic tool that allows minimizing risks would be very important to improve patient’s safety. With the electronic system and the algorithm we propose, changes of HRV were detected At least 90minutes before the onset of clinical symptoms, which could have avoided in several cases the administration of higher doses. HRV analysis has been used in several studies to investigate the autonomic nervous system (ANS) in other allergic conditions: allergic rhinitis or asthma patients. Spectral analysis of heart rate variability allowed extraction of low-(LF) and high-(HF) frequency components, markers of sympathetic and vagal modulation respectively.
HRV has been measured to assess the association of nasal air flow resistance and the underlying function of ANS during the birch pollen provocation as latest [26]. In this study, after the provocation, the nasal airflow resistance rose gradually, whereas HRV changes implied gradually increasing sympathetic withdrawal in allergic patients during the provocation with allergen. With this proposed method the authors open new possibilities to assess accurately the dynamic and short-term changes in non- stationary nasal function and could increase the accuracy and reliability of diagnostics and assessment of the effect of nasal treatments. Lan et al suggest that patients with allergic rhinitis may have poor sympathetic modulation in the sitting position and that autonomic dysfunction may therefore play a role in the patho physiology of allergic rhinitis [27]. Other authors find differences in patients with more persistent allergic rhinitis and severe symptoms [28]. HRV has been investigated in asthma patients and high HRV was associated to control as th ma compared with uncontrolled asthma patients [29]. It has also been used to compare the autonomic modulation of heart rate (HR) in asthmatic and healthy Volunteers and correlate it with the forced expiratory volume in the first second (FEV1). The authors achieved a correlation between the airways’ obstruction and HRV [30]. Four allergic patients had a negative electronic detection. All of them developed onlycutaneous Symptoms. One of them experience dano-immediate reaction, 8 hours after the last administered dose. The other 3 had been challenged with NSAID.
The proposed algorithm was not useful in patients with NSAID hypersensitivity. There a son is unknown. In a study to evaluate the relationship between ANS and contact/complement system activation, in patients with hereditary angioedema authors found an increased sympathetic activation at rest and blunted response to orthostatic challenge, data consistent with altered ANS modulation in hereditary angioedema patients. Authors suggest a link between ANS and Brady kin in production [35]. It is possible that the inhibition of the synthesis of prostaglandins by the NSAID and their interference in the function of the haemostatic system could somehow influence the HRV. Our results, with a high sensitivity and specificity, support this electronic system as a promising tool for improving drug hypersensitivity diagnosis and could be also important in food allergy diagnosis, as the electronic detection now could be made in real time. Detecting a hypersensitivity reaction before the onset of clinical symptoms could provide the clinical staff a tool to prevent more severe reactions. Another aspect of interest is the fact that in those patients with a negative result according to the algorithm but presenting with clinical symptoms the reaction was mild, with only cutaneous involvement. Although the algorithm can work in real time, this study was carried out offline. Future development of this proposal is an alert system (screen or sound alarm) that could allow the clinical staff to be aware in real time of the identification of patients that can develop a hypersensitivity reaction to have a close miniaturization of them and to decide whether giving increasing doses to the patient or not.
In the final Proto type, the host (which receives the ECG signal from the Shimmer via Bluetooth and processes the detection algorithm) can be either a computer or an Android-based portable device, as we have programmed the algorithm for both platforms. The clinical staff interacts with the software through a user interface, obtaining information about the progress of the provocation test. The algorithm would generate an early alarm if it detects the conditions for the onset of a hypersensitivity reaction. More studies including a higher number of patients are needed to confirm these promising results and to evaluate the diagnostic accuracy of the proposed algorithm.
Conclusion
The use of an electronic computerized system for processing heart rate variability can be a useful tool in drug hypersensitivity diagnosis. This algorithm has shown a high negative predictive value and detection noticeable even before the appearance of physical symptoms during a drug provocation test, which allow to improve the safety of the patients that undergo a drug allergy study. This algorithm has not been useful in NSAID hypersensitivity studies.
Acknowledgment
Authors thank Mrs. Ana Mª Sanz and Mrs. Isabel de Mingo for their important nursing work in this study. This work has been supported in part by Spanish Ministry of Economy and Competitiveness through the TARSIUS project, TIN2015-71564- C4-1-R; and thanks to the National Youth Guarantee System Administrative, Unit of the European Social Fund (Order ECC / 1402/2013) and the University of Alcalá FPI program. Some authors belong to the Spanish Thematic Networks and Cooperative Research Centers ARADyAL (A Vega-Castro, JM Beitia, R Cárdenas and MB Mateo-Borrega Center RD16/0006/0023), which is supported by Instituto de Salud Carlos III (ISCIII), co-founded by Fondo Europeo de Desarrollo Regional-FEDER.
Conflicts of Interest
The authors declare that they have no conflicts of interest.
References
- Simons FE, Ebisawa M, Sanchez Borges M, Thong BY, Worm M, et al. (2015) 2015 update of the evidence base: World Allergy Organization anaphylaxis guidelines. World Allergy Organ J 8(1): 32.
- Worm M, Moneret Vautrin A, Scherer K, Lang R, Fernandez Rivas M, et al. (2014) First European data from the network of severe allergic reactions (NORA). Allergy 69(10): 1397-1404.
- Sousa Pinto B, Fonseca JA, Gomes ER (2017) Frequency of self-reported drug allergy: A systematic review and meta-analysis with meta-regression. Ann Allergy Asthma Immunol 119(4): 362-373.
- Li M, Krishna MT, Razaq S, Pillay D (2014) A real-time prospective evaluation of clinical pharmaco- economic impact of diagnostic label of 'penicillin allergy' in a UK teaching hospital. J Clin Pathol 67(12): 1088-1092.
- Mattingly TJ, Fulton A, Lumish RA, Williams AMC, Yoon S, et al. (2018) The Cost of Self- Reported Penicillin Allergy: A Systematic Review. J Allergy Clin Immunol Pract 6(5): 1649-1654.
- Macy E, Contreras R (2014) Health care use and serious infection prevalence associated with penicillin "allergy" in hospitalized patients: A cohort study. J Allergy Clin Immunol 133(3): 790-796.
- Sousa Pinto B, Cardoso Fernandes A, Araujo L, Fonseca JA, Freitas A, et al. (2018) Clinical and economic burden of hospitalizations with registration of penicillin allergy. Ann Allergy Asthma Immunol 120(2): 190-194.
- Aberer W, Bircher A, Romano A, Blanca M, Campi P, et al. (2003) Drug provocation testing in the diagnosis of drug hypersensitivity reactions: General considerations. Allergy 58: 854-863.
- Demoly P, Adkinson NF, Brockow K, Castells M, Chiriac AM, et al. (2014) International Consensus on drug allergy. Allergy 69(4): 420-437.
- Berntson GG, Bigger JT, Eckberg DL, Grossman P, Kaufmann PG, et al. (1997) Heart rate variability: Origins, methods, and interpretive caveats. Psychophysiology 34(6): 623-648.
- M Malik (1996) Heart rate variability. Standards of measurement, physiological interpretation, and clinical use. Task Force of the European Society of Cardiology and the North American Society for Pacing and Electrophysiology. Eur Heart J 17(3): 354-381.
- M Benseñor, M Eira, EL Dorea, EM Dantas, JG Mill, et al. (2011) Heart Rate Variability in HIV Patients, Diabetics, and Controls: The AGATAA Study. ISRN Vascular Medicine 2011: 1-8.
- U Rajendra Acharya, K Paul Joseph, N Kannathal, CM Lim, JS Suri (2006) Heart rate variability: A review. Medical & biological engineering & computing 44(12): 1031-1051.
- HM Seong, JS Lee, TM Shin, WS Kim, YR Yoon (2004) The analysis of mental stress using time-frequency distribution of heart rate variability signal. Conference proceedings: Annual International Conference of the IEEE Engineering in Medicine and Biology Society. IEEE Engineering in Medicine and Biology Society. Conference 2006: 283-285.
- A Mobyen Uddin, P Funk, R Filla (2012) Mental State Monitoring System for the Professional Drivers Based on Heart Rate Variability Analysis and Case-based Reasoning. In Federal Conference on Computer Science and Information Systems (FedSIS) 2012: 35-42.
- M Peltokangas, J Verho, A Vehkaoja (2012) Night-time EKG and HRV monitoring with bed sheet integrated textile electrodes. IEEE Trans Inf Technol Biomed 16(5): 935-942.
- Scully CG, Lee J, Meyer J, Gorbach AM, Granquist Fraser D, et al. (2012) Physiological parameter monitoring from optical recordings with a mobile phone. IEEE Trans Biomed Eng 59(2): 303-306.
- Shimmer, “SHIMMER (Sensing Health with Intelligence, Modularity, Mobility, and Experimental Reusability).”
- Pecchia L, Melillo P, Sansone M, Bracale M (2011) Discrimination power of short-term heart rate variability measures for CHF assessment. IEEE Trans Inf Technol Biomed 15(1): 40-46.
- W Massagram, N Hafner, M Chen, L Macchiarulo, VM Lubecke, et al. (2010) Digital Heart-Rate Variability Parameter Monitoring and Assessment ASIC. IEEE Transactions on Biomedical Circuits and Systems 4(1): 19-26.
- C Wei Lin, JS Wang, P Choo Chung (2010) Mining Physiological Conditions from Heart Rate Variability Analysis. IEEE Computational Intelligence Magazine 5(1): 50-58.
- Fairchild KD, O’Shea TM (2010) Heart rate characteristics: Physiomarkers for detection of late- onset neonatal sepsis. Clin Perinatol 37(3): 581-598.
- Pan J, Tompkins WJ (1985) A real-time QRS detection algorithm. Biomedical Engineering, IEEE Transactions 32(3): 230-236.
- Gutiérrez Rivas R, Garcia JJ, Marnane WP, Hernandez A (2015) Novel Real-Time Low-Complexity QRS Complex Detector Based on Adaptive Thresholding. Sensors Journal, IEEE 15(10): 6036- 6043.
- Khamis H, Weiss R, Xie Y, Chang CW, Lovell NH (2016) QRS detection algorithm for telehealth electrocardiogram recordings. IEEE Trans Biomed Eng 63(7): 1377-1388.
- Seppänen TM, Alho OP, Seppänen T (2015) Concomitant dynamic changes in autonomic nervous system function and nasal airflow resistance during allergen provocation. Conf Proc IEEE Eng Med Biol Soc 2015: 3339-3342.
- Lan MY, Lee GS, Shiao AS, Ko JH, Shu CH (2013) Heart rate variability analysis in patients with allergic rhinitis. Scientific World Journal. 2013: 947385.
- Kim MH, Choi EJ, Jang BH, Kim KS, Ko SG, et al. (2017) Autonomic function in adults with allergic rhinitis and its association with disease severity and duration. Ann Allergy Asthma Immunol 118(2): 174-178.
- Lutfi MF (2015) Patterns of heart rate variability and cardiac autonomic modulations in controlled and uncontrolled asthmatic patients. BMC Pulm Med 15: 119.
- Garcia Araújo AS, Pires Di Lorenzo VA, Labadessa IG, Jürgensen SP, Di Thommazo Luporini L, et al. (2015) Increased sympathetic modulation and decreased response of the heart rate variability in controlled asthma. J Asthma 52(3): 246-253.
- Twomey N, Temko A, Hourihane JO, Marnane WP (2014) Automated detection of perturbed cardiac physiology during oral food allergen challenge in children. IEEE J Biomed Health Inform 18(3): 1051-1057.
- Johansson SG, Bieber T, Dahl R, Fried mann PS, Lanier BQ, et al. (2004) Revised nomenclature for allergy for global use: Report of the Nomenclature Review Committee of the World Allergy Organization, 2003. J Allergy Clin Immunol 113: 832-836.
- Raquel Gutiérrez Rivas (2016) Real-Time Early Detection of Allergic Reactions based on Heart Rate Variability. PhD Thesis, University of Alcalá, National University of Ireland, Cork.
- Cox LS, Sanchez Borges M, Lockey RF (2017) World Allergy Organization Systemic Allergic Reaction Grading System: Is a Modification Needed? J Allergy Clin Immunol Pract 5: 58-62.
- Wu MA, Casella F, Perego F, Suffritti C, Afifi N, et al. (2017) Hereditary angioedema: Assessing the hypothesis for underlying autonomic dysfunction. PLoS One 12(11): e0187110.
