 Short Communication
Introduction
Each patient has his/her own individual characteristics. It is given by his/her main diagnosis and its detailed description (e.g., in oncology by TNM classification, grading, histological type etc.), comorbidities, results of genetic markers, biomarkers and many other factors. Standard patient care is usually based on the results of large clinical trials. This approach ignores the patient’s individuality. Using patient profiling based on tumor characteristics, genetic markers and biomarkers, it is possible to identify the drug with the highest clinical benefit for small patient groups where, according to the guidelines, treatment choice is no longer defined only by diagnosis and TNM classification. This procedure belongs to the area of personalized medicine. An important methodology is how to find similar patients to a newcomer and how to evaluate clinical benefits and risks of different types of therapies in this group of similar patients. The main focus is on overall survival, but time to progression and adverse reactions to treatment are also important. Based on extensive patient data available in electronic medical records (hospital information systems), similar cases to a newcomer can be identified and some statistics for these similar patients can be provided.
Comparing benefits and risks of different therapies with previously treated patients from real-life database from the Hospital information systems of different hospitals leads in helping to oncologist in selection of the optimal therapy.For some cancer diagnoses treatment selection is already given by stage of the disease. But for many diagnoses, e.g. for breast cancer, modern medicine offers more options. Although there are some studies with goal to compare treatments, but not for all possible scenarios. Also patients included into clinical trial have to meet inclusion/ exclusion criteria which are sometimes very strict and which does not fully agree with real-life data. Thereforereal-time data were used for fitting of the statistical models presented below. Several mathematical models have been developed for predicting of individual breast cancer risk. Such models can help clinicians to choose appropriate preventive and therapeutic interventions for each patient. A case-control study in the Czech Republic with a similar design to that of the US Breast Cancer Detection and Demonstration Project (BCDDP) [1].
The main objective of this study was to evaluate the validity of the Gail model in the Czech female population, and to develop a local model using the same statistical approach as the Gail model. Number of 14566 questionnaires containing case history data from both healthy women (control group) and women with breast cancer were collected. Case-control age-matched pairs (n = 4598) have subsequently been matched and analyzed. The original Gail model was also not able to properly describe age-specific baseline risk of breast cancer development in the Czech population. In response the authors developed two variants of modified/locally adjusted models [2]. Now model for 5-years or lifetime risk of developing of breast cancer is developed for a healthy female. This breast cancer risk development model created by author is available at web page http://calc.koc.cz/pro_lekare/vypocet_rizika_nadoru_prsu.html Most biomarkers have increased serum concentrations in multiple tumor diagnoses, or markers may be increased also for many nonmalignant causes.
Tumor markers are often measured repeatedly, especially in the context of cancer patient follow up or in monitoring the effect of therapy. Moreover, usually not only one tumor marker is measured, but multiple markers are assessed. All these factors make the interpretation of tumor marker results very difficult and requires extensive experiences. Based on extensive clinically validated data of approximately 100 thousand patients and suitable statistical models, BIANTA and CRACTES softwares were created. The models also take into account epidemiological data, in particular incidences and prevalences of illnesses. Correlations between laboratory parameters and their mutual influencing are also taken into consideration. The model output – quantified assessment of current and previous laboratory findings for the given patient – then becomes one of the components serving in the physician’s decision making, along with other assessments. Models and their software implementations are being constructed since 1990 and in the stage of prototypes have been used for several years in various clinical settings. New versions of these programs incorporating modern cloud solution are now available. The software is modular based to provide easy access to particular modules (BIANTA, CRACTES) and future possibilities to update or extend any of them without disabling the others. Usage of Java technology enables the software to run on every platform and therefore targets wider audience.
Software BIANTA
Software BIANTA is used to help in the interpretation of tumor markers in cases where there is a strong suspicion of cancer, event. metastases are found but the location of the primary tumor is not clear. This software can also be used for screening of prostate or ovarian tumors. Bianta (Biás) was a classical philosopher, who said: „Everything what I have I carry with me“ („Omnia mea mecum porto“). BIANTA means Bayesian Intelligent Associative Network for Tumor Analysis. The system is based on the theory of Bayesian networks. The input data are the results of measurement of tumor markers in the patient´s blood serum samples, the patient´s age, sex and location of metastases if found. Epidemiological data were gained by analyzing the data gathered by the National Oncological Register as available at software SVOD (software for visualization of oncological data at web www.svod.cz) where incidence were taken as a mean of last 3 available years. In the BIANTA software over 50 possible cancer diagnoses in taken into account together with 260 non-malignant reasons (mainly benign diagnoses) related with some tumor marker and over 40 tumor markers therefore the complexity of the classification task is very high.
Clinical validation of BIANTA software showed that of the cases initially diagnosed as C80 “malignant neoplasm without known location”, BIANTA was able to determine the correct diagnosis at one of the first 3 places in 95% in validation data of 93 real C80 causes from the Masaryk´s Memorial Cancer Institute Brno. When compared with 6 physicians from Faculty hospital Pilsen who did not know these patients and had the same input information as the program BIANTA, only one physician was better than BIANTA software. One casuistic of BIANTA is presented at the Table 1.
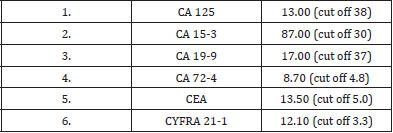
Table 1: Casuistic from the Masaryk’s Memmorial Cancer Institute Brno – female, 48 years old Measuredtumor markers.
Output of the software BIANTA
1) C33-C34 (162) cabronchogenes, bronchus and lung tumor → probability : 67.8 %
R: CY 21-1, SCCA - epiderm.; NSE, (TK, TPS) - small cell; CA724, CEA, (CY211, TK, TPS) - adenocarc.; CY211, TK - square cell, M: liver,bone,CNS,adrenal gland (small cell ca - meta with prim.dg)
2) C53 (180) cacervicis uteri, cervix tumors → probability: 10.7 %
R: SCCA, CY 21-1, TPS - epiderm.; CA 125, CEA - adenocarc., M: lung
3) C54 (182) cacorporis uteri, uterus tumors (including endometrium) → probability : 7.3 %
R: CA 19-9, CA 125, CA 72-4, SCCA, CEA, TPS, (CA-50, TATI, CY 21-1, b-HCG), M: lung, liver
4) C50 (174, 175) camammae, mammary gland tumors → probability : 5.3 %
R: CA 15-3, TPS, CEA, TK, MCA, CA 125(for meta to ovary, pleura, lung), M: bone, lung, liver, pleura, ovary, soft tissue, CNS, R: = recommended measurements; M: = possible locations of distant metastases
Real Diagnosis was lung ca mixed type. Another interesting casuistic was a patient with multiple metastases (in 5 organs) and without obvious primary tumor locus at the University Hospital Pilsen. The BIANTA program predicted that 12 tumor lesions in 5 different organs originated from a testicular tumor. And really a small testicular tumor about 3 mm in diameter was finally found. This was overlooked in previously done imaging methods. The patient was cured and surviving until now.
Software CRACTES
Software CRACTES is the decision support software for tumor markers interpretation during the cancer patient´s follow-up and for the therapy evaluation. The main task which the programme helps to sort out, is early diagnostics of the recurrence of tumor illness and its most probable location. The examination of markers may be a warning signal, but thanks to not specific reactions it also may be a false alarm; this reminds of an association with a jay bird which signals an enemy but has to be taken with a pinch of salt to a certain extent. After reaching the clinical status of full remission the patient is usually invited to be checked up in 1-4 months´ intervals (according to time elapsed since the treatment of primary tumor). It is desirable to identify the metastatic process earlier than it is manifested clinically. The system helps to answer the following question: “Will clinically evident metastases develop in case of a patient in remission until the next check-up?” The risk of genesis of distant metastases is modelled by the methods of statistical survival analysis. A specific analysis was made for every tumor diagnosis.
The risk of genesis of metastases was estimated as a function of all previous measurements of tumor markers, specific for the given diagnosis. Traditional diagnostics compares the latest values of markers with cut-off level known from the literature or supplied by the manufacturer. This classical approach does not take into account the individuality of a patient (in remission the marker value fluctuates around the individual level for a given patient), and also does not take into account slow but steady increase in the marker value below the cut-off level which is characteristic for some types of illness recurrence. The abovementionedmethod describes the patient´s history more in detail which also results in much more precise quantification of risk [3]. The main clinical validation of the software CRACTES was done on routine real-life data of 5980 patients with breast cancer with at least 6 months follow up. The data were measured in the Saint Elizabeth´s Oncological Clinic in Bratislava, Slovakia. Serum levels of the tumor markers CA15- 3, TPA, CEA were measured in 31703 serum samples from 5980 patients with breast cancer. Progression was developed in 1447 patients. Results are shown in the Table 2.
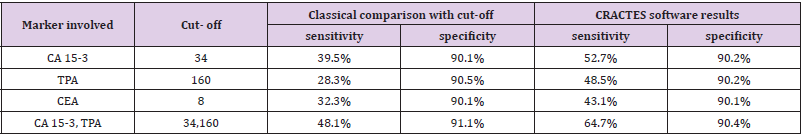
Table 2: Results of validation of CRACTES software: Saint Elizabeth´s Oncological Clinic Bratislava data.
An interesting casuistic was a patient with colorectal cancer in follow up care at the Pardubice Hospital. The patient was without problems. Based on small but repeated tumor markers increasing the CRACTES program predicted the recurrence of the disease, specifically lung metastases. Routine examinations (X-ray, CT) did not confirm this finding. But the oncologist trusted the program and requested a spiral lung CT scan. This examination really confirmed lung metastases and the patient was successfully treated - treatment started much earlier with help of the software CRACTES. Another interesting casuistic from the Masaryk’s Memmorial Cancer Institute Brno is presented in the Table 3. Risk of disease progression given by tumor markers behaviour:disease progression until 3 months is possible with probability 79%. Possible locations of metastases: bones, lungs, liver, pleura, ovaries, soft tissues, CNS. If only the last tumor markers concentrations (TPA = 111 IU/L, CA 15-3 = 31 kIU/L) were used as the inputs of CRACTES (it means time-dynamics was ignored) then probability of disease progression is only 38%.Validation of CRACTES showed that by taking into account thegrowing of tumor markers (also below cut off), this software was able to increase sensitivity by 10-20% without increasing false positives compared to traditional comparison of recent marker concentrations with cut off. Both software BIANTA and CRACTES are modular based to provide easy access to particular modules (BIANTA, CRACTES) and future possibilities to update or extend any of them without disabling the others. Usage of Java technology enables the software to run on every platform and therefore targets a wider audience [4]. It is created as a cloud-based application (see http://almadiagnostics. com).
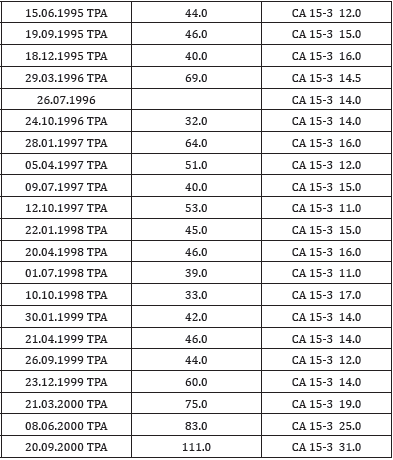
Table 3: Breast ca patient - casuistic from the Masaryk’s Memmorial Cancer InstituteBreast ca patient - female born 1942.
Conclusion
These decision support software BIANTA and CRACTES which are based on non-linear multivariate approach taking into account time dynamic of the repeatedly measured tumor markers could help to clinician as it is provided by clinical validations presented above. These validations showed that the software BIANTA and CRACTES are better compare to “normal clinician” (with no or medium experiences with tumor markers) and about the same as real clinical experts working long time in interpreting of tumor markers. Both these software is being successfully used at a number of hospitals and laboratories in the Czech Republic. BIANTA Software will guide clinician to 3-4 most probable locations of a tumor. This will affect other examinations, especially to which locations to focus by imaging methods. This is a clear example of personalized medicine. CRACTES software personalizes intervals during follow up of cancer patients and also recommends (if risk of recurrence is increased) additive examinations (laboratory and/or imaging methods). Module of CRACTES software for predicting response of anticancer therapy was also developed for ovarian cancer [5]. Authors are planning to integrate population epidemiological data from other countries to make the program applicable and usable outside of the Czech Republic.
References
- Gail MH, Brinton LA, Byar DP, Corle DK, Green SB, et al. (1989) Projecting individualized probabilities of developing breast cancer for white females who are being examined annually. J Natl Cancer Inst 81(24): 1879-1886.
- Novotný J, Pecen, L, Petruželka L, Svobodník A, Dušek L, et al. (2006) Breast cancer risk assessment in the Czech female population - an adjustment of the original Gail model. Breast Cancer Research And Treatment 95(1): 29-35.
- Nekulová M, Šimíčková M, Pecen L, Eben K, Vermousek I, et al. (1994) Diagnosis of Breast Cancer Dissemination by Tumor Markers Follow-Up and Method of Prediction. Neoplasma 41(2): 113-118.
- Pecen L, Jiřina M, Novák J (2015) Diagnostic Software for Decision Support of Detection and Interpretation of Tumor Markers. International Journal on Biomedicine and Healthcare 3(1): 33-36.
- Nekulova M, Pecen L, Kalabova R (2002) Predicting response of ovarian cancer to paclitaxel treatment based on trend analysis of serum CA125. CLIN CHEM 48(8): 1364-1367.
