 Research Article
Abstract
Type 2 Diabetes Mellitus is affecting 90% of diabetes population, if left untreated, diabetes can lead to other health complications and among the serious ones are blindness and renal failure. Currently most of the diabetes cases are diagnosed when the patients complaints about its symptoms, while the diagnosis method is invasive where the blood glucose level is measured. In this study, we have identified urinary proteins that are uniquely or excrete at differently quantities from those of healthy and prediabetics. The effect of food and metformin treatment, a drug commonly used to control blood sugar was also investigated, it was found that the excretion of these urinary biomarkers are not affected by these two components. Therefore, we are suggesting that these urinary biomarkers may be used as screening tool for diabetes, a non-invasive method can be improvised which can help to detect diabetes at its early stage.
Keywords: Poly-Pathological Patient; Hospital Re-Organization; Hospital Discharge Form; Internal Medicine; Patient-Centered Model;Specialty-Based Model
Abbreviations: CKD: Chronic Kidney Disease; DN: Diabetic Nephropathy; DTT: Di Thio Threitol; EDTA: Ethylene Diaminetetra-Acetic Acid; FBG: Fasting Blood Glucose; HFD: High Fat Diet; IP: Intraperitoneal Injection; kDa: kilo Dalton; MW: Molecular Weight; NA: Nicotin Amide; ND: Normal Diet; PAGE: Polyacryl Amide Gel Electrophoresis; RC/DC: Reducing Agent And Detergent Compatible; SDS: Sodium Dodecyl Sulfate; STZ: Streptozotocin; T2DM: Type 2 Diabetes Mellitus; TEMED: N,N,N’,N’- Tetramethyethylenediamine
Introduction
Micro vascular complications affecting kidney, retina and nervous system are common problems which affecting half of the patients with Type 2 Diabetes Mellitus (T2DM), while renal failure causes 10% of deaths in T2DM patients [1]. Diabetic nephropathy (DN), a form of renal complications happens when diabetic condition leads to the release of reactive oxygen species and inflammatory mediators. This results in glomerular hyper filtration, glomerular hypertension, renal hypertrophy and the alteration of glomerular composition, namely albuminuria and hypertension [2]. DN leads to end-stage renal disease eventually if the patient is undiagnosed or left untreated. Hence, diabetes patient needs proper care to pre vent the on-set of DN. Patients with excess albuminuria often associates with DN. However, studies have suggested that albuminuria is not suitable marker for diagnosis of DN risk as it is lack of specificity and sensitivity [3]. Therefore, other urinary protein marker for predicting diabetes and pre-diabetes were identified. For example, elevated urinary monocyte chemo attractant protein-1 (uMCP- 1), Neutrophil Gelatinase-Associated Lipocalin (NGAL), Cystatin C, kidney injury molecule 1 (u-KIM-1) and vitamin D-binding protein [4-6].
During the early course of DN, the structural and functional proximal tubular changes effect the increased excretion of proteins with molecular weight less than 40 kDa. Hyperglycemia affects the glomerular filtration and the tubular reabsorption of low molecular weight proteins could lead to excretion of these proteins [7]. Recent research reported that CKD273 classifier, a panel of 273 differentially expressed urinary peptides was elevated in chronic kidney disease (CKD) patients compared to healthy controls. These peptides are associated with prediction of progressive DN and CKD [8-10]. Moreover, other peptides were identified during different stage of T2DM such as, Ig kappa light chains (KLC) and Transthyretin were excreted as early as 0 to 5 years of T2DM while Cystatin C excretion was found increased with the duration of 5 to 10 years. In addition, observed, Alpha1 acid glycoprotein1 (A1AG1), Apo lipoprotein A1 (ApA1), Zinc alpha 2 glycoprotein (ZA2G) and Alpha 1 Microglobulin/ Bikunin Precursor (A1M) were observed in patients during late years of T2DM [7]. Diet is one of the major risk factor for diabetes [11]. Food high in fat, salt and sugar will leads to hyperglycemia, dyslipidemia and hypertension; these conditions promote the progression of DN [12]. While the acceptable macronutrient distribution range for total fat is 20-35% of energy for adults [13], fat intake which exceeded 40% of total energy will lead to reduction in insulin receptors, glucose transport and metabolism as well as the function of energy storage in liver and muscle cells [14].
Besides, study also shown that dietary fat induce oxidative stress and damage the kidney. Hence, it is important that diabetes patient to adherence to healthy eating habit [15]. In this study, tricine SDSPAGE was applied in order to detect the lower molecular weight proteins in rat urine, and subsequently the protein profile of diabetic rats and pre-diabetes rats were compared to that of normal healthy rats. We aimed to analyze the changes of low molecular weight protein profile in urine of diabetic rats and prediabetic rats by the effect of diet, namely normal diet and high fat diet (HFD). The effect of metformin on urinary protein profile, a commonly used drug in treatment of diabetic was also being investigated.
Materials and Methods
Materials
Metformin tablets used in this study was purchased from Dynapharm, Malaysia. Ketamine was purchased from Troy Laboratories, Australia and Xylazine was obtained from Indian Immunological Limited, India. The rest of the chemicals were purchased from Sigma Aldrich, USA and Bio-rad, USA.
Animals
A total of 60 male adult rats (Sprague-Dawley) were obtained from Animal Research Centre and Service, Universiti Sains Malaysia. The rats were housed individually in cages under controlled environment at 22-24 °C with 12 hours light/dark cycle. All the rats were given a week for adaptation to the environment. The experimental procedures were approved by Animal Ethics Committee of Universiti Sains Malaysia (USM/Animal Ethics Approval /2016/ (717)). (Table 1) shows the diets and treatments of each group of rats.
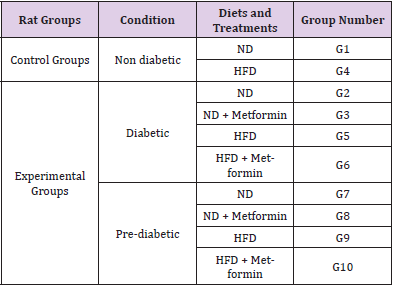
Table 1: Diet and treatments of rats from each group.
Induction of Diabetes: Forty eight out of the 60 male rats were assigned to the experimental groups. Diabetes was induced in these rats by intraperitoneal injection (IP) of streptozotocin (STZ). The rats were put on fasting for 12 hours before the induction. After the fasting period, nicotinamide (NA) dissolved in normal saline was injected into the peritoneal cavity of rats at a dose of 110mg/kg. After 15 minutes, STZ (dissolved in 0.1 M sodium citrate dihydrate, pH 4.5) was administered by IP injection to the animals at a dose of 65mg/kg. At the same time, the other 12 rats were assigned to the control (non-diabetic) group and were injected with vehicle (saline and citric buffer). Animals from both control and experimental groups were monitored for 4 consecutive weeks.
Experimental Design: After 4 weeks of monitoring period, the rats were sorted into 10 groups and were fed according to their diet plan for 6 weeks. Each group consists of 6 rats (n=6).Non-induced rats from the control groups were divided into Group 1 (G1) which was fed with normal diet (ND) [prepared by mixing the feed powder (Altromin, Germany) with water at ratio of 1:1] and Group 4 (G4) which was fed with high fat diet (HFD) [prepared by mixing 1:1 food powder to water ratio and 22.4% (v/w) of cooking oil]. Meanwhile, the induced-rats from the experimental groups were divided into two groups based on their fasting blood glucose (FBG) level, namely diabetic group (FBG >7.0 mmol/L) and pre-diabetic group (FBG 5.6-6.9mmol/L) [1]. Diabetic rats were further assigned into Group 2 (G2), Group 3 (G3), Group 5 (G5) and Group 5 (G6) while pre-diabetic rats were subdivided into Group 7 (G7), Group 8 (G8), Group 9 (G9) and Group 10 (G10). Rats from G2 and G7 were fed with ND while rats from G3 and G8 were fed with ND and treated with metformin. Besides, rats from G5 and G9 were fed with HFD while rats from G6 and G10 were fed with HFD with metformin treatment. Metformin drug was prepared by suspending metformin tablets in 1% carboxymethylcellulose and was fed orally to the rats twice a day at a dosage of 250 mg/kg. Rats were given free access to food pellets (approximately 26g per day) and water throughout the experiment.
Collection of Urine Sample: The rats were kept in metabolic cage overnight for urine collection. Five hundred μL of 10% (w/v) sodium azide was transferred into the urine collector prior to the collection for antifungal purpose. The urine of the rats was collected the next morning. Urine collected was aliquot into 1.5 mL eppendorf tube.
Urinary Protein Extraction
Urinary proteins were precipitated by ammonium sulfate salt precipitation based on the procedure described by Wai Hoe L et al [2] with slight modifications. The protein precipitation was done at 45 % of salt saturation by mixing ammonium sulphate salt with urine thoroughly for 1 minute and centrifuged (13000 rpm, 20 minutes, 4 °C). The collected pellets were further reconstituted in TSE buffer [10 mM Tris, 1 mM EDTA and 1% (w/v) SDS].
Sodium Dodecyl Sulphate Polyacrylamide Gel (SDSPAGE)
Protein concentration of each sample was determined by RC/ DC protein assay (Bio rad, USA). The steps follow the protocol provided by the manufacturer. Protein standard used was Biorad protein assay standard I, Bovine Gamma Globulin (BGG) with these concentrations: 1, 0.5, 0.25, 0.125, 0.0625 mg/mL and blank. Tricine SDS PAGE was performed following the method stated by Schagger. H et. Al [3] with slight modification. The gel composed of three layers. The lower layer was made up of 16% T,6% C [1.0 M Tris-HCL, pH 8.45] separating gel, the middle layer was 10% T, 3% C [1.0 M Tris-HCL, pH 8.45] spacer gel and the upper layer was 4% T, 3% C of stacking gel [0.75 M Tris-HCL, pH 8.45]. The samples were mixed with reducing sample buffer [0.15 M Tris-HCl at pH 7.0, 30% (v/v) glycerol, 12% (w/v) SDS, 0.05% (w/v) Coomassie blue G250 and 6% (v/v) mercaptoethanol] at the ratio of 4:1 and heated at 90 °C for 5 minutes before loading into the gel. Samples were load under cathode buffer [1.0 M Tris, 1.0 M tricine and 1% (w/v) SDS]. The running voltage was initially set at 60 V and adjusted to 100 V when the samples reached the lower layer. The gel was stained with Coomassie blue solution [0.1% (w/v) Coomassie brilliant blue R250, 40% (v/v) methanol and 10% (v/v) glacial acetic acid] for 30 minutes then was destained with destaining solution [40% (v/v) methanol and 2% (v/v) glacial acetic acid].
The gel image was captured using ChemiDocTM Imaging System (Bio-rad, USA) and was analyzed using Quantity One 1-D software (Bio-rad, USA). Band detection sensitivity was set at 20.00 and the bands were matched at 5.0% tolerance.
In-gel Digestion
In-gel digestion following the method described by Gam [4] was performed. Interested protein bands were excised from the gel and cut into cubes. Gel pieces were washed 3 times, each time with 100mM ammonium bicarbonate for 10 min followed with acetonitrile (ACN) for 5 min and then dried in speed-vacuum centrifuge. After that, 10mM dithiothreitol (DTT) in 100mM ammonium bicarbonate was added to the dried gel pieces and incubated for 1hr at 56°C. Excess solution was discarded, and gel pieces were incubated with 55mM iodoacetamide in 100mM ammonium bicarbonate in the dark at room temperature for 45 min then the solution was discarded. Gel pieces were washed twice and dried as described above. Dried gel pieces were then treated with 13ng/μL of trypsin in digestion buffer [50mM ammonium bicarbonate, 5mM CaCl2] then incubated with digestion buffer at 37°C for overnight. The tryptic digest were collected and the remaining peptides were extracted for 3 times with 5% (v/v) formic acid in 70:30 of ACN: deionized water. The pooled supernatant was blow-dried using nitrogen gas.
Liquid Chromatography-Tandem Mass Spectrometry (LC-MS/MS)
Dried peptides were reconstituted in 30μL of 0.1% (v/v) formic acid in deionized water and the filtered through 0.2μm regenerate cellulose (RC) membrane filter syringe filter (Sartorius, Germany). The LC-MS/MS analysis was performed by using Easy-nLC II nano liquid chromatography system (Thermo Scientific, USA) coupled with Finnigan LTQ linear ion trap mass spectrometer (Thermo Scientific, USA). Two running buffers were used, Buffer A: 0.1% (v/v) formic acid in deionized water and Buffer B: 0.1% (v/v) formic acid in ACN. Fifteen μL of sample was injected and eluted at a flow rate of 0.3μL/min with a gradient mode from 5% to 100% of Buffer B in 80 mins. Pre-column used was Easy-Column C18 (20 × 0.10mm i.d., 5μm; Thermo Scientific, USA) equilibrated at flow rate of 3μL/min for 15μL while the analytical column used was Easy-Column C18 (100 × 0.75mm i.d., 3μm; Thermo Scientific, USA) equilibrated at a flow rate of 0.3μL/minfor 4μL. Two scan analysis was used: full scan mass analysis from m/z 300-2,000 at resolving power (FWHM) of 60,000 at m/z 400, acquisition time of 1 s and data-dependent MS/ MS analyses triggered by 8 most abundant ions from the parent mass list. Peptides with singly or unassigned charge state was rejected. Temperature was set at 220°C and source voltage of 2.1kV. For fragmentation, collision induced dissociation (CID) with collision energy of 35V was applied.
Data Processing For Protein Identification
PEAKS® Studio Version 7.0 (Bioinformatics Solution, Canada) was used to analyse data obtained from LC-MS/MS. De Novo sequencing was performed and Swiss-prot 2019 was used for database matching. The mass tolerance of precursor mass and fragment ion were set at ±0.5 Da. Variable post-translational modifications (PTM) were carbamidomethylation and oxidation (M). A maximum 3 variable PTMs and missed cleavage per peptide was allowed. Significant score (-10lgP) was set at ≥ 20. The characteristics and function of the proteins were studied at Uniprot website (https:// uniprot.org).
Results
Tricine gel electrophoresis is commonly used to separate peptides and proteins with lower molecular weights. (Figure 1) shows an example of the tricine gel urinary profile for group 7 rats, each of the lane was loaded with urine from each rat in the group (n=6), and the common protein bands from the group is marked, from which one of the rat’s urine which has all the marked protein bands were subjected to comparison study as shown in (Figure 2 and 3). (Figure 2 and 3) show the separation of urinary proteins obtained from one of the representative rat of various groups as mentioned in the study. There were the presence of high abundant proteins at various intensity at MW 23.5 kDa and 11.9 kDa. The intensity of the bands in each group is shown in the bar chart in (Figure 4), for the bands 23.5 kDa, diabetic rats shown a higher intensity than those of the control and prediabetic rats. In contrary for band 11.9 kDa, higher intensity was seen in the normal rats as compared to diabetic and prediabetic rats. (Table 2) shows the protein bands with lower intensity. Bands 15.9 kDa, 14.9 kDa and 9.8 kDa were consistently detected in healthy and prediabetic rats, in contrary for bands 27.0kDa, 19.9 kDa, 16.2 kDa and 9.4 kDa, these protein bands were not detected in any of healthy and prediabetic rats, but shown inconsistent excretion in diabetic groups. (Table 3) shows the identity of protein detected in the protein bands, these proteins were recorded as Histone, major urinary proteins and fragments of antibody chains.
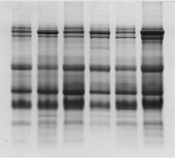
Figure 1: Tricine SDS-PAGE of urinary protein profile from predibatic rats fed with ND (G7).
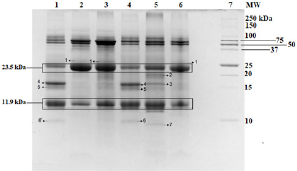
Figure 2: Tricine SDS-PAGE of rat urinary proteins. Lane 1: Non-diabetic rat fed with ND (G1); Lane 2: Diabetic rat fed with ND (G2); Lane 3: Diabetic rat fed with ND with metformin treatment (G3); Lane 4: Non-diabetic rat fed with HFD (G4); Lane 5: Diabetic rat fed with HFD (G5); Lane 6: Diabetic rat fed with HFD with metformin treatment (G6); Lane 7: Protein Ladder
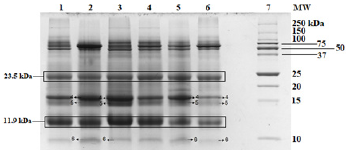
Figure 3: Tricine SDS PAGE of rat urinary proteins. Lane 1: Non-diabetic rat fed with ND (G1); Lane 2: Pre-diabetic rat fed with ND (G7); Lane 3: Pre-diabetic rat fed with ND with metformin treatment (G8); Lane 4: Non-diabetic rat fed with HFD (G4); Lane 5: Pre-diabetic rat fed with HFD (G9); Lane 6: Pre-diabetic rat fed with HFD with metformin treatment (G10); Lane 7: Protein Ladder.
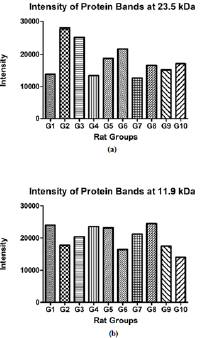
Figure 4: Intensity of protein bands.
(a) Intensity of protein bands at MW of 23.5 kDa;
(b) Intensity of protein bands at MW of 11.9 kDa.
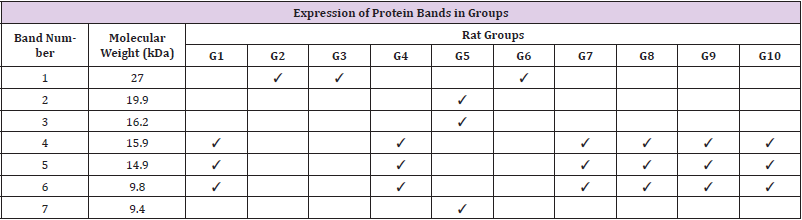
Table 2: Low intensity protein bands.
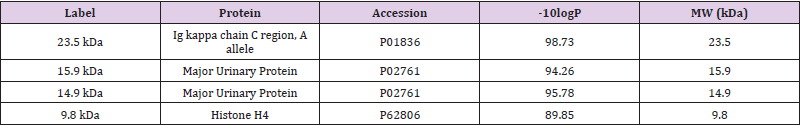
Table 3: Identified Protein List.
Discussion
Separation is a critical step in protein analysis, the commonly used SDS-PAGE electrophoresis method is a useful protein analysing method for samples with higher molecular weights, nevertheless lower molecular weight proteins and peptides cannot be separated well by this method. In order to analyse the lower molecular weight proteins and peptides in diabetic-induced rats, we have applied Tricine- PAGE electrophoresis method, in this method, instead of using glycine in SDS-PAGE, tricine is used to assist in the migration of lower molecular weights proteins at low acrylamide concentration and therefore allows separation of proteins at the range of 30 to 5 kDa proteins and peptides [3]. As shown in (Figure 1), this method allowed the clear visualization of proteins lower than 25 kDa. It was reported that lower molecular weight proteins play an important part in the diabetic induced chronic diseases such as kidney failure and etc. Therefore in this study, we would like to investigate the changes of small molecular weight protein profiling of diabetic rats, prediabetic rats and those fed with HFD. This is because diet is one of the critical caused factors of chronic diseases in diabetic patients.
The Tricine-PAGE profile of urinary protein of control rats and prediabetic rats shared many similarity compared to the diabetic rats, the protein band at 23.5 kDa is particularly interesting. This protein band was consistently found in all the rats urine regardless of the group, however it was found at much higher intensity in diabetic rats (Figures 4a &4b). In this scenario, it may be able to use protein band 23.5 kDa as diagnostic marker for diabetic. Protein band 23.5 kDa excretions was consistently high in diabetic rats regardless of the diet given or treatment by metformin, therefore we believed it can be a good indication for diabetic condition which is not changed by external factor such as diet and treatment. While in healthy and prediabetic rats, the excretion of protein band 23.5 kDa was consistently lower than those of diabetic group regardless of diet or treatment. Therefore we suggest 23.5 kDa proteins to be used as a urinary protein biomarker for detection of diabetes. Nevertheless, since all the rats excrete such protein but at different intensity, a proper range of urinary titre of 23.5 kDa protein indicating diabetes needs to be quantified. Besides 23.5 kDa, a group of small molecular weight proteins namely 15.9 kDa, 14.9 kDa and 9.8 kDa proteins can also be useful biomarkers for the detection of diabetes, these three proteins were detected consistently in all the groups of healthy and prediabetic groups, but they were found missing in the diabetic groups.
The identity of these proteins were identified by using LC/MS/ MS technologies, where the protein bands were excised and subjected to trypsin digestion, the MS/MS data were then matched to the existed protein databases. The 23.5 kDa protein band was identified as Ig kappa chain C region. The excretion of 23.5 kDa in diabetic rats, normal rats and prediabetic rats is similar to the studies by Bellei E. et al. [5] and Lewandowicz A. et al. [6] where they have reported that Ig kappa chain C region was unregulated in the urine of T2DM patients [5, 6]. Moreover, Patel and Kalia also reported that Ig kappa chains excretes from early years of T2DM up to the course of diabetic nephropathy [7]. Ig kappa chain C involves in immune responses. The mechanism of the augmentation of excretion of Ig kappa chain C in the urine might be related to the interference of glycated kappa light chain on the normal tubular reabsorption process [8]. Moreover, the screening of visceral adipose tissue of pre-obese diabetic subjects showed an increased abundance of Ig kappa chain C region as compared to pre-obese subjects [9]. Protein bands 15.9 kDa and 14.9 kDa were identified as Major urinary proteins (MUPs), it is produced in the liver, transported to kidney through bloodstream and excreted in urine.
Circulating MUPs involve in glucose metabolism by suppressing hepatic gluconeogenesis as well as improving energy expenditure and insulin sensitivity in skeletal muscles [10]. In this study, MUPs are found in normal rats and pre-diabetes rat, but not found in diabetes rat. Study has reported that insulin plays a regulatory role in hepatic synthesis of MUPs and insulin deficiency might be the reason of the suppression of this protein [11]. Moreover, several proteomics studies on diabetic rats also identified a down regulated expression of MUPs in urine, kidney and renal mitochondria [12-14]. Protein band 9.8 kDa was identified as Histone H4; it is one of the core structural units of nucleosomes which take parts in regulating gene expressions. Histones are small positively charged protein. These characteristics encourage their excretion into the urine as histones can pass through the kidney bowman space from the blood stream [15]. In this study, the suppression of this protein in urine was found in diabetes rat as compared to the normal and prediabetes rat. There were no previous studies reported on the same findings. However, studies on epigenetic mechanisms of diabetes have suggested that the pathogenesis of diabetes is related to his tone post-translational modifications and it can affect genetic expression in organs linked to diabetic complications [16-18]. Hence, the direct mechanisms causing the suppression of histone in diabetic rat urine needs further investigations.
Nowadays, diagnosis of diabetic is by an invasive technique, where blood glucose level is measured. Using a reliable urinary protein marker may be able to allow screening of diabetic to be done in a friendly and non-invasive environment, where only urine is used. It may not be able to replace the current diagnosis test by using blood glucose, nevertheless it can be used as a screening method for early detection of diabetic, especially amongst the elderly and in the diabetic epidemic areas.
Conclusions
Diabetes amongst patients are usually detected when there were with arising symptoms. In this study, we have investigated the small molecular weight proteins profiling of diabetic, prediabetic and healthy rats that were fed with different diets and with and without metformin treatment. Through the comparison of the protein profiles of different groups of animals, a few proteins were found useful to indicate the condition of diabetes and the excretion of these protein markers were not affected by the diet intake and treatment. These proteins were migrated at 23.5 kDa, 15.9 kDa, 14.9 kDa and 9.8 kDa in tricine SDS-PAGE. The usefulness of these protein markers as diagnostic markers for diabetes is worth further investigating.
Supporting Information
Authors’ Contributions
Conceptualization: Lay-Harn Gam, Vikneswaran Murugaiyah, Baharudin Ibrahim and Peter Greimel; Methodology: Xuan-Yi Sim, Yan-Fen Lee, Waqas Ahmad and Ying-Hui Teh; Analysis: Ying-Hui Teh, Lay-Harn Gam and Mohd Nazri Ismail; Writing-draft and preparation: Ying Hui-Teh and Lay-Harn Gam; Writing-review and editing: Lay-Harn Gam
Funding Statement
This project is funded by USM-RIKEN International Centre of Ageing Science (URICAS), [1001/PFARMASI/870034].
Ethics Approval and Consent to Participate
The experimental procedures for animal studies were approved by Animal Ethics Committee of Universiti Sains Malaysia (USM/Animal Ethics Approval /2016/(717)).
References
- Vaishya S, RD Sarwade, V Seshadri (2018) Micro RNA, Proteins, and Metabolites as Novel Biomarkers for Prediabetes, Diabetes, and Related Complications. Front Endocrinol (Lausanne) 9: 180.
- Wai Hoe L (2009) SDS-PAGE-Based Quantitative Assay for Screening of Kidney Stone Disease. Biol Proced Online 11: 145-60.
- Schagger H (2006) Tricine-SDS-PAGE. Nat Protoc 1(1): 16-22.
- Gam L (2002) Identification and confirmation of urinary human chorionic gonadotropin using in-gel digestion and HPLC/MS/MS analysis.
- Bellei E, Elena Rossi, Leonardo Lucchi, Simona Uggeri, Alberto Albertazzi, et al. (2008) Proteomic analysis of early urinary biomarkers of renal changes in type 2 diabetic patients. PROTEOMICS–Clinical Applications 2(4): 478-491.
- Lewandowicz A, Magdalena Bakun, Rafał Kohutnicki, Agnieszka Fabijańska, Michał Kistowski, et al. (2015) Changes in urine proteome accompanying diabetic nephropathy progression. Polskie Archiwum Medycyny Wewnętrznej 125(1-2): 27-38.
- Patel DN, K Kalia (2019) Characterization of low molecular weight urinary proteins at varying time intervals in type 2 diabetes mellitus and diabetic nephropathy patients. Diabetology & metabolic syndrome 11(1): 39.
- Groop L, A Mäkipernaa, S Stenman, R A DeFronzo, A M Teppo, et al. (1990) Urinary excretion of kappa light chains in patients with diabetes mellitus. Kidney international 37(4): 1120-1125.
- Murri M, Maria Insenser, Maria Rosa Bernal-Lopez, Pablo Perez-Martinez, Hector F Escobar-Morreale, et al. (2013) Proteomic analysis of visceral adipose tissue in pre-obese patients with type 2 diabetes. Molecular and cellular endocrinology 376(1-2): 99-106.
- Zhou Y, L Rui (2010) Major urinary protein regulation of chemical communication and nutrient metabolism. In Vitamins & Hormones. 83: 151-163.
- Roy AK (1980) Role of insulin in the regulation of the hepatic messenger RNA for α (2U)-globulin in diabetic rats. Journal of Biological Chemistry 255(23): 11614-11618.
- Schlatzer DM, Jean-Eudes Dazard, Moyez Dharsee, Rob M Ewing, Serguei Ilchenko, et al. (2009) Urinary protein profiles in a rat model for diabetic complications. Molecular & Cellular Proteomics 8(9): 2145-2158.
- Sharma V, K Tikoo (2014) Stage-specific quantitative changes in renal and urinary proteome during the progression and development of streptozotocin-induced diabetic nephropathy in rats. Molecular and cellular biochemistry 388(1-2): 95-111.
- Sun SH, Shang Qing Liu, Chang Ping Cai, Rong Cai, Li Chen, et al. (2012) Down-regulation of alpha-2u globulin in renal mitochondria of STZ-induced diabetic rats observed by a proteomic method. In Annales d'endocrinologie 73(6): 530-541.
- Kawai C, Hirokazu Kotani, Masashi Miyao, Tokiko Ishida, Leila Jemail, et al. (2016) Circulating extracellular histones is clinically relevant mediators of multiple organ injury. The American journal of pathology 186(4): 829-843.
- Kato M, R Natarajan (2014) Diabetic nephropathy-emerging epigenetic mechanisms. Nature Reviews Nephrology 10(9): 517-530.
- Reddy MA, JT Park, R Natarajan (2013) Epigenetic modifications in the pathogenesis of diabetic nephropathy. In Seminars in nephrology 33(4): 341-353.
- Sayyed SG, Anil Bhanudas Gaikwad, Julia Lichtnekert, Onkar Kulkarni, Dirk Eulberg, et al. (2010) Progressive glomerulosclerosis in type 2 diabetes is associated with renal histone H3K9 and H3K23 acetylation, H3K4 dimethylation and phosphorylation at serine 10. Nephrology Dialysis Transplantation 25(6): 1811-1817.
