 Research Article
Abstract
This paper shows some views on the mathematical structure of the diffusion of the Coronavirus (COVID-19), often claimed to have a positive exponential structure. However, we find that the exponential growth rate is past the inflection point and that growth is much slower than this implication. It presents conclusions on the future expected outcome of the current situation-not only in terms of diffusion of the disease but also for the hysteria that have been created around it.
Keywords: Covid-19; Virus; Exponential Growth; Coronavirus, SARS-CoV-2
Introduction
In the last three months, fear has emerged about the spreading of the virus SARS-CoV-2 and the related illness COVID-19, often leading to irrational consumers behaviour [1]. The virus has alleged generated tens of thousands of death worldwide, starting from China and moving to South Korea, Iran, and Italy. Then, it has started a spread toward their European countries, and onto the US and Canada [2]. At the time of writing this paper – 23rd of March 2020, the virus has reportedly killed 5,476 people only in Italy [3]. These numbers are certainly destined to grow. The panic is spreading and the diffusion of the virus has been claimed to follow an exponential growth model [4]. Sometime this claim has been mitigated by the necessity to intervene to “flattend the curve,” sometime it has been reported in an alarming manner [5]. The goal of this paper is to provide a contribution toward a rational understanding of the phenomenon using the data coming from Italy, Iran, and South Korea, and, consequently to help limiting the panic and supporting rational decision making.
Our evidence supports the claim that the spreading is not in the
exponential growth phase but has slowed to an infections growth
rate below 1. Further, it has been in such a position even before the
different countries has taken measures to segregate people in the
hope of limiting the spread.
Putting the numbers into context, seasonal flues have killed in
Italy more than 7.027 in 2013/2014, 20.259 in 2014/2015, 15.801
in 2015/2016, and 24.981 in 2016/2017 [6]. With the diffusion
of the panic, the ability of following rational approaches by the
general populace tended to diminish, as it can be seen by irrational
consumer’s behaviour [1]. Information as provided by different
sources and authorities also has not always been consistent. As an
example, while the information diffused worldwide claimed that on
the 4th of March in Italy there were 104 deaths for such virus [7],
Istituto Superiore di Sanità (ISS) later claimed that only 12 of such
deaths could be attributed to it [8]. ISS is an Italian public institution
that, as the leading technical-scientific body of the Italian National
Health Service (Servizio Sanitario Nazionale), performs research, trials, control, counselling, documentation and training for public
health. The Institute is under the supervision of the Ministero della
Salute (Ministry of Health). The discrepancy between such reports
lies in the counting methodology. ISS declares that only 12 people
were not affected by co morbidities. At the moment, authorities
are not able to distinguish patients who are dying because of the
virus from those who were already affected by serious pathologies
and did not die because of COVID-19. Also, different countries may
follow different approaches to this regard.
Another source of uncertainty concerns the computation of fatality rate, i.e., the proportion of deaths from a particular disease compared to the total number of people diagnosed with the disease for a specified period. At the beginning, the media hyper confuses fatality rate and mortality rate. Mortality rate is instead a measure of the number of deaths scaled to the size of the population per unit of time, and it is typically expressed in units of deaths per 1,000 individuals per year [9]. The fatality rate is a ratio between a numerator and a denominator that are both difficult to measure accurately in current circumstances [10]. The numerator depends on how deaths are attributed to COVID-19 in case of co morbidities. The denominator is the total number of people diagnosed with the disease and it depends on the effort deployed to test the population (that varies among countries and it is the result of different prevention strategies), and on the accuracy of the test, which has been shown to be inaccurate (from the results of a recent study [11], false positives could be at least 50%). With these premises, fatality rate cannot be reliably computed at the moment. In addition to the case of co morbidities, we need to consider the case of confections, that is, when the COVID-19 acts together with another virus, for instance of a “more regular” flue, which may cause a death attributed to the COVID-19, while it is due to a multitude of causes; just to give an example associating an infection of Staffifloccus Aureus to a fluse increases the risk of death of a factor up to 4 [12].
With such statement we do not intend to claim that
recommendations from health authorities should be ignored.
Indeed, the virus is hazardous and demands attention and
containment measures. The regulation announced by public health
authorities must be rigorously followed to limit the spread. Also, the
“regular” flu is dangerous and need to be handled with care, which
is supported by the aforementioned data. Still, it is essential to
reduce the uncertainty and to put the phenomena into perspective,
to make reliable forecasts of the future, and to moderate the panic
that is spreading, which, for instance, is leading people in the US to
buy more weapons [13]. We need to acknowledge that the spread of
the news of the viral spread is positive for many market sectors. The
virus enlarges their potential customer base and, indeed, without
any desire to spread the fear, their growth and diffusion spread
the panic. The first of such market is social media, as the primary
vehicle of news, and also of meaning for people to communicate
while they are separated one another [14]. Then there are health care companies, tools to work from home, entertainment services
to be used from home, and online stores [15].
To reinforce the importance of a reliable prediction, we should
review the case of the emergence of the swine flu in England, which
generated a tremendous fear, resulting then in public spending of
473 million pounds for a supposedly healing drug that ended up
being as useful as paracetamol [16]. This short study has the goal of
limiting the uncertainty and contributes to a rational understanding
of the current virus outbreak. To this end, we present a rigorous
model of the virus’ spread and a hypothesis for the model. Our
evidence supports the claim that the spreading is not in the
exponential growth phase but it has slowed to an infections growth
rate below 1. This paper is organized as follows. Section 2 proposes
some mathematical models describing the diffusion of the virus
in South Korea, Italy, and Iran, and Section 3 discusses the results
we have achieved and their implications on our society. Section 4
discusses the limitations of the findings while Section 5 attempts
to draw some conclusions. We welcome comments and alternative
analyses. The datasets that we have used are the public ones
distributed by WHO. Still, we make them directly available online
for other people to validate our results and to produce alternative
models.
Methods
Modeling the Spread of the Virus
There has been a growing number of statements that the COVID-19 has an “exponential growth” [5], meaning that it has a daily growth that is an almost constant proportion of the number of people who are infected – such situation would be so that in a matter of months the whole population of the world or a significant portion of it would be infected. However, our analysis does not confirm such findings, and instead shows we are past the inflection point of the bimodal or logistical curve, as the rate of new infections is less than 1. We have analysed the data of the diffusion of the virus in three countries, Iran, Italy, and South Korea. These countries have taken different strategies to cope with such situation as it is widely discussed in the media [17]. We have considered the data from the day of the first apparent propagation of the virus in such countries, and we have used the data coming from the World Health Organization, all occurring after the 24th February 2020, the day zero in our plots. Let us emphasize again that the term “exponential diffusion” as used in the media means that the diffusion in one day is proportional to the number of cases present in the day before. In other words, if xi represents the number of cases at time i, then we have that xi+1 = (a + 1) xi where a is a constant real number which ought to be strictly positive if we want a positive exponential diffusion. We have started to analyse such factor in the three countries and how it has evolved (Figure1), and we have observed that it is far from being a constant but rather it is a value decreasing overtime, which implies that the curve is past the inflection point.
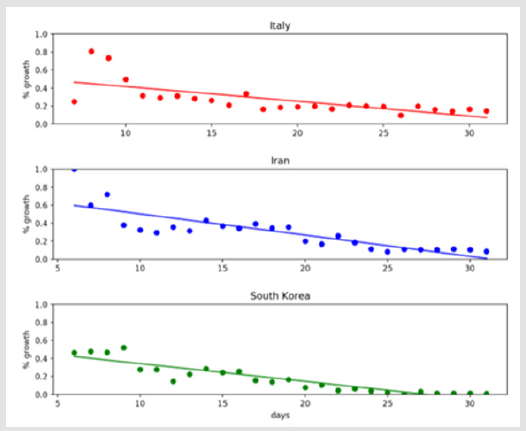
Figure 1: Linear model of the growth rate of the coronavirus.
We have then considered the possibility of modelling such variation with a linear regression of the kind ai = ci + d, where c and d are the two coefficients of the linear relation. The resulting lines are also in (Figure 1). In all the cases, if we compute the robust Spearman rank correlation coefficient, we find an evident downward moving trend overall. The results rounded to the second significant decimal are for Italy a correlation of -0.84, with p < 10- 6, for Iran -0.88, with p < 10-8, and for South Korea -0.95, with p < 10-13. This is a contradictory statement that in the days under consideration, there has been a positive exponential diffusion of the virus. Moreover, we can try to consider a linear model; the Pearson correlation coefficient rounded to the second decimal for Italy is- 0.70, with p < 10-3, for Iranis-0.84, with p < 10-6, and for South Korea is -0.92, with p<10-10 . Indeed, the plot shows also that at the beginning, the regression over estimates air, and toward the end, it tends to underestimate it. However, this is explainable by the fact that the growth rate can never become negative, and the model is worth only at the time of expansion of the disease, that is, as long as there is a significant growth in the number of patients.
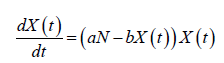
We have translated this into a differential equation to understand the implication of the model better, proposing a structure of the evolution of the kind:
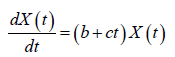
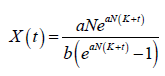
In other terms, we represent the coefficient a mentioned before as a linear function a(t) = b + ct. The solution for such equation is:
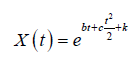
Where k is a constant. The first derivative describes the increment of the number of infected people:
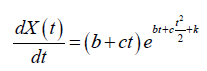
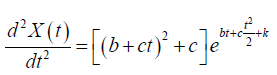
The second derivative represents the variation of the increment in the number of infected people:
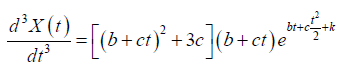
The third derivative is the trend of the variation, so it can tell us whether we are in front of an upward moving variation or a downward moving variation:
It is now interesting to look at the shape of this function. Please, remember that we will consider it only when the derivative has a positive sign. As an example, we can consider the case for Italy. In this case, we have the following equation based on the regression coefficients that we have previously obtained (rounded to the second decimal)
a (t ) = 0.58 − 0.016t
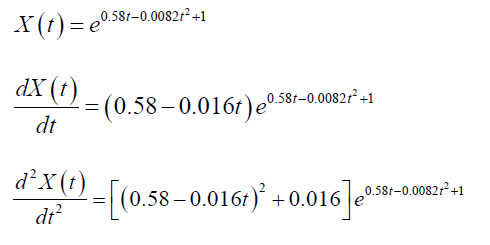
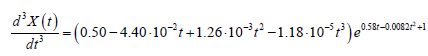
To provide a possible interpretation of the spread of the virus, we use such numbers. However, these numbers are the results of linear regression, which are random variables rather than crisp numbers. Taking derivatives on functions based on them makes the confidence intervals of the resulting coefficient seven larger than what was already for them, and taking the second. Then, the third derivative amplifies further such uncertainty. Therefore, we take such derivatives over specific numbers since we are interested in exploring the overall results and the general behaviour of the proposed model. Assuming the initial condition of 1 person infected, in the case of Italy the functions are:
Now we can look at the plot of these functions, considering that we need to look at the growing side of it. (Figure 2) contains such portions of the function: in (Figure 2a) there is the overall evolution of the number of people affected (the model that we have interpolated), in (Figure 2b) we see the new cases (these cond derivative), in (Figure 2c) the evolution of the new cases (these cond derivative), and in (Figure 2d) the trend of such evolution (the third derivative). We notice that initially, there is a swift growth, which people typically call “exponential.” However, the variation of the trend starts slowing down quite soon, as it is evidenced by the third derivative becoming decreasing, then the direction becomes descending (and its variation negative). This is a clear indication that the growth is not any more “exponential.” The rest is consequential. After that, the trend also becomes negative and so the number of new cases decreases, to reach zero in the model, at which point the model ceases its validity since it is intended tore present mathematically only the situation of spreading of the virus.
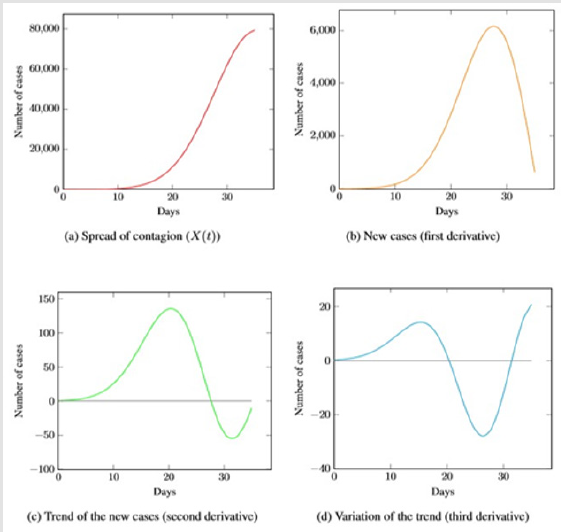
Figure 2: Possible model of Italy. The main aspect to be noted is the trend disregard specific numbers, which could contain significant errors due to the mathematical operations performed on them. The data is publicly available at [23, 8].
Results
Short Analysis of the Results
The prediction of the course of an epidemic/pandemic is crucial for properly organizing the necessary response of the healthcare system of the affected territory. The new experience with coronavirus–COVID-19–has demonstrated that the globalized world would have to manage the problem in a more coordinated way, despite the actual scenario. A possible explanation of the result of our study could be that the virus is very contagious but not a death sentence and the tests for the presence of illness do not work correctly. So, we could think at a situation that initially very many people get infected but only few are reported infected or sick. The people who get initially sick a real so the weakest or the one in the worst environmental or genetic condition, contributing to an increase in the number of deaths [18]. Then, indeed, a global immunity takes over, and the reported number of sick people decreases till the point of disappearing. Such a model would follow quite well the publicly available data from South Korea, Italy, and Iran. We can also compare the presented model with the situation of Vo Eugenio, a small city (approximately 3500 people inhabitants) in Italy, which has been closely monitored, even if the data is not completely clear.
On the 7th of March, it was reported that there were 90 people sick [19]. Out of them, three people died (about 3.3% of the infected). As a result, panic has spread; causing the city has been locked, which makes it an ideal case to analyze. A further and more in-depth analysis has shown that the spread was about two to four times as much [20] and that the people who died had generally pre-existing conditions. No new deaths have been reported. This situation is somehow coherent with the model that the virus spread fast till everyone who could get it or remained immune. Most people were not recorded positive, meaning they got the infection without any noticeable or harmful (for them) symptoms. Unfortunately, a few people died initially, but there were the situation of co morbidities and, possibly, of coinfections [21, 22]. The experience of the northern Italian regions affected by the coronavirus, Lombardia and Veneto, the richest and the most industrialized Italian regions, is coherent with our findings (Figure 2).
1. Many patients are asymptomatic. Tracing them, as initially
suggested, is difficult and costly, so this policy was not applied
after some initial attempts.
2. Symptoms requiring medical attention are present in a
minority of patients. Also, they can closely resemble those of
the flu, with which COVID-19 can coexist.
3. Several symptomatic patients do require hospitalization
and in a not negligible proportion, ICU management, especially
if they are already sick or older. This procedure is crucial
for saving lives. The rapidly increasing number of patients
requiring highly complex medical attention has put the health
care system of these regions under almost unbearable stress,
although their basic level both as far as quality and organization
was at the highest world standard.
4. The mortality rate is quite difficult to calculate in a nonbiased
manner because the actual number of infected people is
practically unknown. However, some kind of comparison with
other countries with comparable socio-economical standard
and mean population age could be attempted.
It is noteworthy that countries, namely Japan and South Korea, with similar socioeconomic and mean age to Italy, showed significantly less number of deaths per inhabitants. More interesting is the fact that the former adopted preventive measures not as strong as the lastly imposed in Italy. This contrast exposes that it is likely that other factors (e.g., genetic or environmental) have played an unexpectedly significant negative impact in the clinical course of the Italian patients living in the regions mentioned above [19]. If the prediction presented in this study is correct, the clinical course of the COVID-19 infection will be less dramatic in the rest of Italy, which is a welcoming scenario. The disease will take longer to subside. In the meantime, there will be unavoidably a large number of infected patients with almost no symptoms and, hopefully, an available effective drug and vaccine. The analysis of the number of deaths occurring in residents of the southern regions in comparison to the northern ones would corroborate this hypothesis. It is interesting to note that some of the deaths recorded in recent days in the Lazio region occurred in patients coming from Lombardi. As mentioned previously, the hypotheses shown in this study should not, by any means, imply that we need not follow the directions of public health authorities. Even conventional flu still poses as a source of considerable risk. Instead, this study expects to contribute to a better understanding of the phenomena and better reasoning of the situation in which we live and take actions accordingly, preventing panic. The main implications we can see from the outcome and the public awareness of the virus are:
• The risk of saturating the health system. As a result, people
suffering other hard conditions, like having had a traumatic
episode, could not be allocated for treatment in a hospital;
• The risk of spreading paranoia and fear for the
neighbourhood as already evidenced by the increase in buying
guns in the US;
• The risk of a reduced response from the immunosystem
by those people considering the diagnosis of COVID-19, which
could be interpreted as a death penalty, given the current mass
psychosis surrounding the virus. It is well known that the
immunosystem has a strong association with the mood and
the mind [23,24];
• The risk of harming the economy, not only for the
slowdown of some of the activities. Moreover, it can cause
the waste in useless medical items (as already mentioned for
Tamiflu) or for speculations present in the financial market
due to possible predatory behaviours.
Still, if the hypotheses shown in this study prove to be reliable, the public health authorities could take additional (and perhaps cheaper and more effective) measures to handle such diffusion. If the spread is so fast and hard to handle, steps should also be taken to minimize its impact. First, it is surprising that there is substantial evidence that ascorbic acid (vitamin C) helps reducing viral infections, up to even 85% [25]. This has not been taken into account into the overall recommendation, even though if vitamin C is quite inexpensive. In essence, a regular cost in a pharmacy is about 100 roubles (1.3 Euros) for packages of 250 grams, meaning that assuming a hefty dose of it of 10 grams would cost 5 roubles or 6.5 cents of Euros per day per person. Moreover, if the indeed affected population is a small percentage of people with special care conditions, such people could be placed in secure places and quarantined. Handling their emotional responses properly, rather than isolating the whole population, which is expensive, unpractical, and then can be broken? For instance, the effect of coronaviruses on older people was already studied [26], so it is quite a surprise that this was not taken into consideration at the outset of the virus. An effective way to handle such diffusion would also help to anticipate the handling via suitable simulations and forecasting, as it is done now effectively, for instance, in agriculture [27]. Such an approach would not have as harming economic effects in case of a false alarm.
It is interesting to observe how now the situation will evolve, especially in Italy, from which we hope to receive new data soon. Italy has been – and is being - considered a leading example of how the western world should manage this pandemic, and also developed countries that initially seemed to choose a different strategy against the viral infection later revised their policies. Italian management policy is conceived according to the axiom that the COVID19 virus is exponentially expanding, now from Northern regions to the centre-south, and a significant peak of epidemic is still to be expected. Accordingly, southern areas have been preparing unique plans to be capable of managing properly a quickly increasing number of infected patients requiring hospitalization and possibly ICU management. This has posed under considerable stress both the organization of the National Italian healthcare system (whose policies are devolved to the local regions and outside the competence of the Ministry of Health) as well as the economy of the Centre-southern regions, which are well known to be poor and less efficiently organized as far as the healthcare concerning the North.
Limitations of the Findings
The publicly available datasets can be affected by erroneous count in case of co morbidities and inaccuracy of tests, as previously discussed. Different countries may also have used different methodologies making the comparison inaccurate. Furthermore, social awareness, population attitude and containment measures may have also affected the data differently in different geographical areas. Even considering these possible cofactors, the diffusion of the virus does not follow the so-called “exponential” trend that was hyped as scary and dramatic by mass media. The mathematical approach use dis also subject to flows, as we mentioned. We have found compelling evidence of a reduction in the growth rate of diffusion of the virus, and we have tested it quite reliably. We have then moved to a linear descent model using the resulting coifficient to build a differential equation. Tn this latter approach, little errors get amplified. Therefore, it is important to stress that the numbers that we have presented should be considered as indications of overall trends and not as fix and deterministic entities. Furthermore, we could explore more refined growth models, considering the saturation factor, taking into account that the number of infected people cannot exceed the population and the probability of being infected is related to the number of people not yet infected, in a model like:
Where N is the total population and a and b are factors that consider that not all the population will be affected by the virus and that some people can be infected multiple times. The model would have a solution:
Where k is a constant, leading to the typical logistic structure, which is a model used to predict the spreading of diseases for at least almost a century [28]. Indeed, we could then move further and also consider the time dimension. All of these new and important matters deserve a further reflection, being outside the limited scope of this first communication.
Conclusions
The beginning of 2020 has seen an outbreak of the virus SARS-CoV-2 and the related illness COVID-19. Initially originated from China has then seen the spread over other countries such as Italy, Iran and South Korea for then having cases appearing in virtually all European countries. On 11th of March, Tedros Adhanom Ghebreyes us, the director general of WHO, declared:”We have therefore made the assessment that COVID-19 can be characterized as a pandemic” [29]. Since then, all countries started actively taking stricter countermeasures, even those that were previously acting mildly. Mass media started to publicize the situation extensively, and panic took over worldwide. Reliable sources have made several statements about the potential exponential growth of the disease [5], increasing further a sense of phobia and worldwide run to the supermarket to stock items related to basic needs. This hype and panic made it more difficult for the authorities to act and for citizens to behave rationally and collaboratively. Rational decisions necessitate looking at facts.
The diffusion of the virus does not follow an purely exponential trend as promoted by the mass media, but a traditional epidemiological curve, typical of seasonal flu, for example. Stricter measures could help in flattening the peak to avoid overloading the healthcare system. However, even before the more stringent containment measures adopted in Italy on 10th of March this year, the phenomenon did not appear to be in the exponential phase. The data requires a sober reflection after the crisis, with the emergency managed. Curve-flattening policies and containment measures have immediate economic consequences on the country that may impose further cuts on the healthcare system, leading to a potential financial break down in the future. Policymakers should start from these considerations to design the future, especially when creating monetary policies.
Acknowledgments
We thank in no Polis University for generously supporting our research endeavours. The work was partially supported by the 5/100 funding of RUDN University.
Financial Disclosure
“None of the authors has a financial interest in any of the products, devices, or drugs mentioned in this manuscript.
References
- Gabriella Borter (2020) No milk, no bleach: Americans awake to coronavirus panic buying.
- (2019) Centres for Disease Control and Prevention. Search COVID-19 risk assessment by country.
- (2020) Coronavirus Cases.
- Harry Stevens (2020) Why Outbreaks like coronavirus spread exponentially, and how to”flatten the curve”.
- Ethan Siegel (2020) Why ’Exponential Growth’ Is So Scary For The COVID-19 Coronavirus.
- Aldo Rosano, Antonino Bella, Francesco Gesualdo, Anna Acampora, Patrizio Pezzotti, et al. (2019) Investigating the impact of influenza on excess mortality in all ages in Italy during recent seasons (2013/14–2016/17 seasons). International Journal of Infectious Diseases 88: 127-134.
- (2020) Covid-19 coronavirus outbreak.
- (2019) ISS. Coronavirus, Iss: solo 12 i decessi per coronavirus senza altre patologie.
- Jonathan M Samet, Heather Wipfli, Elizabeth A Platz, Nrupen Bhavsar (2009) A Dictionary of Epidemiology, Fifth Edition: Edited by Miquel Porta. American Journal of Epidemiology 170(11): 1449-1451.
- Rebecca Harrington (2020) Case fatality rate.
- Zeng LX, Mi BB, Chen FY, Liu WJ, Pei LL, et al. (2020) Potential false-positive rate among the’ asymptomatic infected individuals’ in close contacts of COVID-19 patients 41(4): 485-488.
- Jennifer S McDanel, Eli N Perencevich, Jeremy Storm, Daniel J Diekema, Loreen Herwaldt, et al. (2016) Increased Mortality Rates Associated with Staphylococcus aure us and Influenza Coinfection, Maryland and Iowa, USA1. Emerging Infectious Diseases 22(7): 1253-1256.
- Ed Pilkington (2020) US sales of guns and ammunition soar amid coronavirus panic buying.
- Adam Levy (2020) 3 Reasons to Buy Facebook Stock in the Wake of Coronavirus.
- Sergei Klebnikov (2020) Here are 20 stocks to buy in the ‘coronavirus economy,’ according to market experts.
- James Gallagher (2020) Tamiflu: Millions wasted on flu drug, claims major report.
- Jason Beaubien (2020) Singapore Wins Praise For Its COVID-19 Strategy. The U.S. Does Not-wins-praise-for-itscovid-19-strategy-the-u-s-does-not.
- Adam D Kenney, James A Dowdle, Leonia Bozzacco, Temet M McMichael, Corine St Gelais, et al. (2017) Human Genetic Determinants of Viral Diseases. Annual Review of Genetics 51(1): 241-263.
- Michela Nicolussi Moro (2020) Coronavirus, mille tamponi al giorno: A Vo’ i contagi si sono fermati.
- (2020) Coronavirus: “Il 50-75% dei casi a Vo’ sono asintomatici. Una formidabile fonte di contagio”.
- Sarah H Alfaraj, Jaffar A Al Tawfiq, Nojoom A Alzahrani, Talal A Altwaijri, Ziad A Memish (2017) The impact of co-infection of influenza a virus on the severity of Middle East respiratory syndrome coronavirus. Journal of Infection 74(5): 521-523.
- Xiaojing Wu, Ying Cai, Xu Huang, Xin Yu, Li Zhao, et al. (2020) Co-infection with SARS-CoV-2 and Influenza A Virus in Patient with Pneumonia, China. Emerging Infectious Diseases 26(6).
- Giancarlo Succi (2020).
- Fulvio D’Acquisto (2016) Editorial overview: Immuno modulation: Exploiting the circle between emotions and immunity: Impact on pharmacological treatments. Current Opinion in Pharmacology 29.
- H Clay Gorton, Kelly Jarvis (1999) The effectiveness of vitamin C in preventing and relieving the symptoms of virus-induced respiratory infections. Journal of Manipulative & Physiological Therapeutics 22(8): 530-533.
- Henri EZ Tonnang, Bisseleua DB Herv´e, Lisa Biber Freudenberger, Daisy Salifu, Sevgan Subramanian, et al. (2017) Advances in crop insect modelling methods-Towards a whole system approach. Ecological Modelling 354: 88-103.
- Jamie Ducharme (2020) World Health Organization Declares COVID-19 a ’Pandemic.’ Here’s What That Means.
- William Ogilvy Kermack, Anderson G McKendrick (1927) A contribution to the mathematical theory of epidemics. Proceedings of the Royal Society of London. Series A, Containing papers of a mathematical and physical character 115(772): 700-721.
- Edward E Walsh, Jae Hyun Shin, Ann R Falsey (2013) Clinical Impact of Human Coronaviruses 229E and OC43 Infection in Diverse Adult Populations. The Journal of Infectious Diseases 208(10): 1634-1642.
