 Short Communication
Abstract
We describe a photometric method for the fast, qualitative and quantitative detection of aqueous formaldehyde. These methods are based on Bial’s test which is frequently used for the detection of sugars. Concentrations of formaldehyde over 1.8 mM form a brown precipitate which is a good qualitative indicator. Below 1 mM, no sedimentation is observed, and ultraviolet/visible light spectroscopy can be used to quantify the formaldehyde concentration. The limit of detection is 0.03 mM (0.9 ppm).
Keywords: Formaldehyde; UV/Visible Spectroscopy; Bial’s Test
Introduction
Current high-fidelity formaldehyde detection in waterbased samples requires chemical derivatization followed by ion chromatography or liquid chromatography [1-3]. These methods are labor intensive and require expensive instrumentation. Here, we propose an additional method for detecting and quantifying aqueous formaldehyde that is based on Bial’s test and simple photometric equipment. Our approach also allows for a convenient qualitative color test that is applicable to samples with high formaldehyde concentrations. The foundation of our method was developed by Bial in the form of a colorimetric test for identifying pentose sugars in the urine of patients with pentosuria [4]. Bial’s solution consist of orcinol, hydrochloric acid, and iron (III) chloride [4]. The concentrations of the components vary from study to study and some authors have substituted hydrochloric acid with ethanol [5] When heated with pentose sugars, Bial’s solution reacts to form furfurals and changes color from a light pale yellow to blue or green [6].
When heated with hexose sugars, Bial’s solution reacts to form hydroxymethylfurfurals and turns from a light-yellow color to a gray or brown color [6]. A quantitative version of Bial’s test using spectrophotometry has been developed for simultaneous determination of both hexoses and pentoses [7]. Moreover, Sumner noted that the addition of a few drops of formaldehyde into Bial’s solution turned color from a pale yellow to dark yellow [5], however, no quantitative method for detecting formaldehyde in this fashion has been reported. Simple methods exist for detecting formaldehyde in solution using different phenols or chromotropic acid, photometrically or colorimetrically [8-11]. These methods do not yield an observable precipitate at higher concentrations; moreover, many of them are less sensitive; additionally, the older colorimetric methods are primarily qualitative [8-11]. Our method is the first to utilize orcinol to detect formaldehyde in a quantitative fashion. For higher concentrations, our test serves as a colorimetric method, the color change and noticeable precipitant formed during heating allow for quick simple detection by non-specialists. For milli molar and sub milli molar concentration uv/visible spectroscopy can be used to generate a simple calibration curve quickly and with precision.
Methods and Materials
We prepared Bial’s solution using 0.4 g of orcinol (Spectrum), 0.5 mL of 0.37 M FeCl3 (Fisher Scientific), and 200 mL of 0.5 M HCl (Fisher Scientific). Due to orcinol sometimes degrading in storage we validated the purity of the orcinol using proton NMR and found it to be uncontaminated. We aliquoted ACS certified, reagent grade formaldehyde (Macron, 12 M) and serially dilute to produce a set of samples with concentrations ranging from 3.6 mM to 0.6 μM. We mixed 1 mL of these samples with 1 mL of Bial’s solution in 15 mL flacon tubes and caped them. Mixtures were then heated at 90 °C for 10 min and allowed to cool to room temperature for 30 minutes. These samples were used as our formaldehyde standard concentrations. All standards were pipetted into polystyrene cuvettes, caped, and then characterized using a PerkinElmer Lambda 950 UV/VIS/NIR spectrophotometer. Spectra of the standards were measured in the wavelength range from 380 nm to 700 nm. For the calibration curves, we measured absorption values of each standard in triplicate at a wavelength of 430 nm.
Results and Discussion
When heated the solution turns various shades of yellow based on the concentration of formaldehyde (Figure 1a). Representative absorption spectra are shown in Figure 2a and reveal a maximum at 430 nm. Notice that the lowest curve (black trace) is the spectrum of a control sample containing Bial’s solution and water only. This sample was heated and processed in the same way as the formaldehyde standards but does not feature an absorption maximum at 430 nm, which is hence characteristic for the presence of formaldehyde. All concentrations equal to or greater than 1.8 mM develop a brown precipitate that sediments within a few minutes (Figure 1b). The amount of precipitate increases with increasing analyte concentrations and causes light scattering effects during spectroscopy. The spectrum with the highest absorption values in Figure 2a (obtained at an analyte concentration of 1.2 mM) is clearly strongly affected by this scattering. Both the precipitation process and the light scattering hinder efforts to record calibration curves at high concentrations.
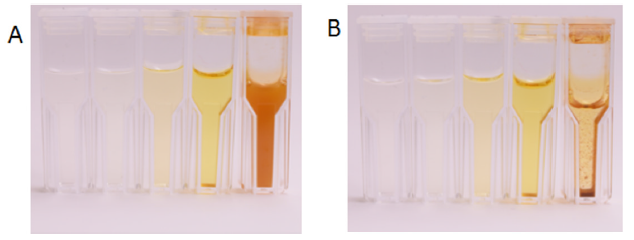
Figure 1: (A) Five cuvettes with product solutions with increasing initial concentrations of formaldehyde (from left to right) 0.006 mM, 0.06 mM, 0.12 mM, 0.6 mM, and 6 mM. The photo was taken 5 min after heating. (B) The same cuvettes 30 min after heating.
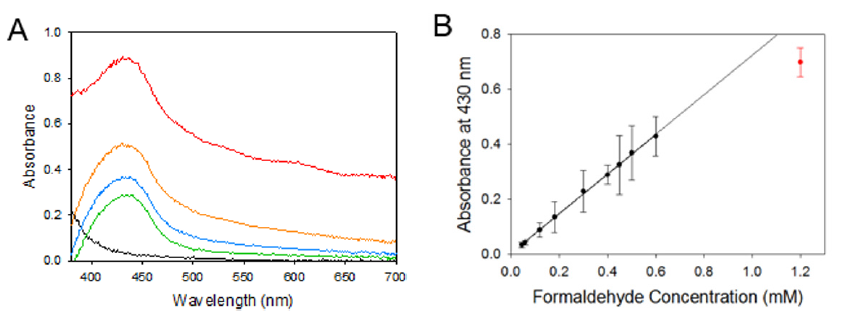
Figure 2: (A) Absorption spectra for 1.2 mM (red), 0.6 mM (orange), 0.45 mM (blue), 0.3 mM (green), and 0 mM (black) formaldehyde reacted with Bial’s solution. (B) Calibration curve obtained for initial formaldehyde concentrations between 0.03 mM to 1.2 mM. The solid line is the best linear fit. The red data marker is not considered for the linear regression and deviates from the calibration curve due to precipitate formation.
For formaldehyde concentration below about 1 mM, however, we obtain a linear dependence between the analyte concentration and the measured light absorption (Figure 2b). Linear regression of this calibration curve yields a molar extinction coefficient of ε = 0.7199 L/(mmol cm) and a very small intercept of 0.0028. The corresponding coefficient of determination is R2 = 0.9988. The limit of detection (LOD) is 0.03 mM. as determined by a Student’s T-test between seven samples of 1:1 Bial’s solution diluted with water.To validate our methods, we use a 30 mM formaldehyde standard that is certified by Sigma Aldrich using ion chromatography. The standard is diluted to a concentration of 0.4 mM for which our calibration curve indicates an absorption of 0.29067 at 430 nm. The observed absorbance is 0.2884 and the corresponding experimental error equals 0.81 % (100 % recovery), thus validating our method of detection.In addition, we test for interferences and false positives from methanol which is a known concomitant of formaldehyde and stabilizer in commercial formaldehyde solutions.
Methanol is also the main raw material in the industrial production of formaldehyde through the Formox process. For this test, we react Bial’s solution with 1 mL of 1 M methanol and saw no change in absorption. We also repeated the same experiment in the presence of 0.4 mM formaldehyde and recovered the expected absorption value. Important sources of interference, however, are sugars as they clearly interact with Bial’s solution. Nonetheless, their resulting spectra are different from those obtained for formaldehyde and the product solutions have typically green to blue colors for pentoses or gray to brown colors for hexoses. Accordingly, it should be possible to deconvolute the different contributions using chemometric methods. We also note that the addition of NaOH to our processed formaldehyde solutions causes an extremely bright photoluminescence that could allow the development of analytical methods with even lower LODs using emission fluorescence spectroscopy.
Conclusion
We have described and validated a simple analytical method for the detection of formaldehyde. Firstly, a qualitative test based on a visible precipitate that allows for the quick determination of formaldehyde levels exceeding about 1 mM. Secondly, a quantitative method for concentrations in the range of 0.03 mM (0.9 ppm) to 1 mM requiring only absorption measurements of visible, violet light. This method maybe used quickly and simply compared to most to detect formaldehyde contamination in medical, industrial, or food sources. It can also be used to verify formaldehyde concentrations quickly and affordably for formaldehyde-based chemistries that use high concentrations of formaldehyde such as the formose reaction.
Conflict of Interest
The authors declare no competing financial interest.
Acknowledgement
We would like to thank Oliver Steinbock for his assistance with this work, including, funding and writing. This work was supported by the National Science Foundation under grants no. 1609495 and 1565734. This work was published with funds from the Center for Chemical Evolution, CHE-1504217.
References
- BA Tomkins, JM McMahon, WM Caldwell, DL Wilson (1989) Liquid chromatographic determination of total formaldehyde in drinking water. J Assoc Off Anal Chem 72(5): 835-839.
- T ChiaFen, S Huei Wen, L Shu Chi, C Shin Shou (2003) Determination of low-molecule-weight aldehydes in packed drinking water by high performance liquid chromatography. J Food Drug Anal 11(1): 46-52.
- E Estes, P Grohse, WF Gutknecht, RKM Jayanty (1983) US EPA, EPA-600/s4-83-031.
- M Bial (1902) Ueber den Werth des neuen (Bial'schen) Reagensfür die Differential diagnose zwischen Diabetes und Pentosurie. Deut Med Wochenschr28(37): 671-672.
- JSumner (1923) THE DETECTION OF PENTOSE, FORMALDEHYDE AND METHYL ALCOHOL. J Am Chem Soc 45(10): 2378-2380.
- EBaldwin, D Bell (1955) Cole's Practical Physiological Chemistry, Heffer.
- WR Fernell, HK King (1953) The simultaneous determination of pentose and hexose in mixtures of sugars. Analyst 78: 80-83.
- N Gayathri, N Balasubramanian (2000) Spectrophotometric determination of formaldehyde Anal. Lett 33(14): 3037-3050.
- J Jendral, Y Monakhova, D Lachenmeier (2011) Formaldehyde in Alcoholic Beverages: Large Chemical Survey Using Purpald Screening Followed by Chromotropic Acid Spectrophotometry with Multivariate Curve Resolution.Int J Anal Chem 2011: 797604.
- R Collins, P Hanzlik (1916) A colorimetric method for the estimation of free formaldehyde and hexamethylenamine. J Bio Chem 25: 231-237.
- C Fulton (1931) The Hehner test for formaldehyde. Ind Eng Chem Anal 3(2): 199-200.
