Abstract
The Pedal assist electric bike consists of two electric and human propulsions. One of the interesting ideas that can be developed on electric bicycles is equipping the bike with a switch controller in order to change the power source between human and electric power sources. In the process of doing this research, it is necessary to recognize the driving force of humans, so it is possible to make a balance between two energy sources. In the first part of this paper, a model for calorie burning is designed during cycling, according to the relationship between heart rate and physical characteristics such as weight, age, and gender, then the effect of weight and age on the amount of burned calories is investigated. For the validity of the relation between heart rate and calorie burning, it is compared with online software. After designing the model, by performing metabolic tests, the maximum amount of calorie that a driver will not get tired for the age range from 25 to 35 years and weight 90Kg has been obtained, which is 180Kcal. For ages from 15 to 25 and from 35 to 45 years and weight 90kg, these values are equal to 186Kcal and 175Kcal, respectively. Also, with using online software and curve fitting for other age and weight ranges, the relationships have been created to estimate maximum burned calorie for wider physical body situation range in the condition that driver will not get tired.
Keywords: Electric Bicycle; Human Power; Body Fatigue; Calorie Burning; Metabolic Activity
Introduction
The pedal-assist electric bike is interesting equipment because
of using these two power sources [1,2]. Predicting the performance
of an electric bike requires recognizing both of these driving forces.
Activities have been carried out on the electric propulsion force.
And due to the structure of electric propulsion, its performance is
more predictable than human propulsion. Therefore, in order to
make this energy management more applicable, human driving
propulsion must be well known [3]. Jessica E Bourne, et al. [4] studied
on health improvements by using e-bikes [4]. The driver’s tiredness
influences power generation from the human power source.
Therefore, the driver might not be able to reach the destination earlier
than a specified time. So, the major part of this study is covered
by the driver’s tiredness issue. The researchers such as Alex OW
Natera, et al, [5-7] studied environmental factors that affect human
fatigue while driving a bicycle [5-8]. Moreover, there are some fac
tors related to human physiques that have an impact on human fatigue
also [9,10]. Determining the fatigue threshold for the human
is so important to discuss that has been done by Didace Ndahimana,
et al. [11]. Considering cooling down and warming up time for
the driver and following some basic sport instructions can protect
the driver from damage and extreme fatigue [12]. Calculating the
burned calories is a way to determine the driver’s fatigue while exercising.
The calculation process is performed with different means
[13].
There are different methods to calculate burned calories and
determining the driver’s tiredness status. Doubly labeled water
(DLW) method is an accurate method but it is costly. Because it
needs high advanced devices, and, specialties’ attendance is required.
A calorimeter is a direct way to calculate consumed energy
but it is an expensive method. There is an indirect method that is accurate enough. This method obtains the consumed energy and
metabolic information of the driver in different environmental conditions.
This method is alike DLW because specialties’ attendance
is required also. Due to this reason, it becomes expensive. The acceleration
measurement is a rough method but it is inexpensive.
Monitoring the heart rate is a simple measurement method for calculating
human energy consumption [11]. According to the studies,
it is necessary to have mathematical relationships that can predict
the performance of human driving forces. Monitoring the heart rate
is not an accurate method for a low level of mobility and exercise.
In this paper, due to the energy consumption that is calculated in
high active performance, this method is practical. Mi Band 3 is used
as a heart rate sensor. By performing experimental tests and using
online software, the relationships will be created to relate the heart
rate and burned calorie.
Metabolic Activity
The corresponding e-bike is equipped with two types of power sources such as electric and human power. The electric power source system consists of battery, electric motor, and, controller. In this Section, the purpose is to investigate factors on human power generation. The human power generation has tight relation with metabolic parameters such as the driver’s heart rate, maximum oxygen consumed volume, weight, gender, and, age. One important issue should be discussed is to determine the fatigue threshold. People have different fatigue threshold, so, there are some proposed means to measure the estimation of this value for any person. In this paper, the driver’s fatigue level is determined by burned calories in a certain sport activity. Equation (1) expresses a relation between driver’s physics such as heart rate hr in beat per minute (bpm), gender, age a considering year, weight w in kilogram unit, and burned calories Cal in kilocalorie unit [14].

There is a linear relation between passed time t and burned calorie rate. As was discussed in Introduction Section, an online software named “Keisan online calculator” is used to calculate the burned calories. This software works based on Equation (2) to obtain burned calories.
Ex = 0.0175×MET ×w (2)
Equation (2) expresses the burned calories Ex in kilocalories per minute. MET is muscle energy technique that is evaluated according to Table 1 is given further [13,14].
Driver’s Physical Characteristics Impacts on Burning Calorie
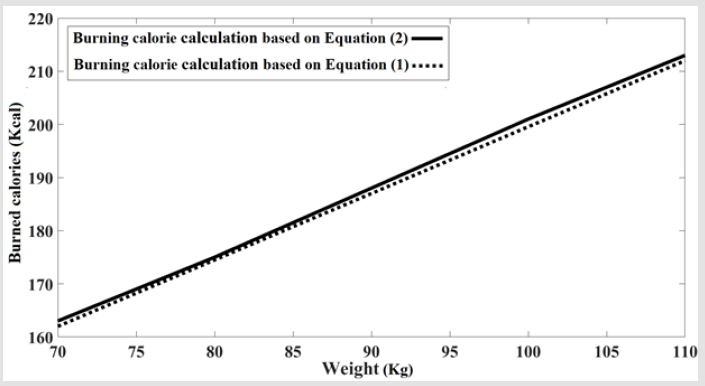
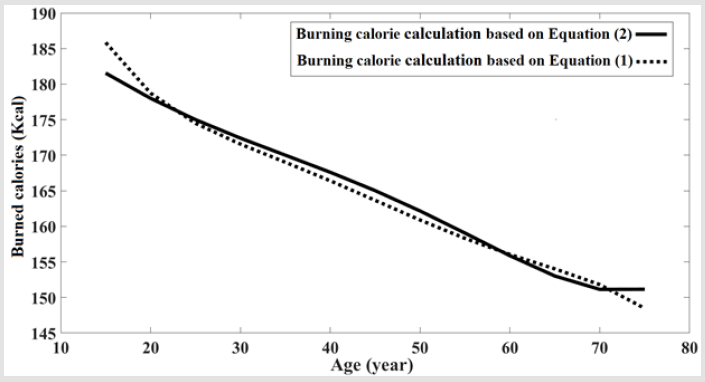
In continue, there are some charts and graphs to illustrate the influences of the driver’s physical traits on the calorie burning. Table 2 describes the burned calorie amount in different weights. The tests are done with Keisan online calculator software. The target driver in this software is a 20-year-old male driver rides a bicycle with 11mph speed in 20 minutes with having different weights as they are shown in Table 2. The results are obtained and shown also. Table 2 shows the validity of Equations (1) and (2). Because they are approximately equal. Figure 1 shows this equality. It is comprehended in Figure 1 that there is a linear relationship between weight and burning calories. To investigate more factors, it is important to consider age variations. Table 3 shows the burned calories are obtained with Keisan online calculator software. Table 3 shows the wide range of ages to cover all someone’s lifetime. Like Figure 1, the age influence diagram is given in Figure 2. This diagram proves the validity of these two equations (1), (2). It is inferred that old people have slow calorie burning in comparison with youths.
Experimental Tests
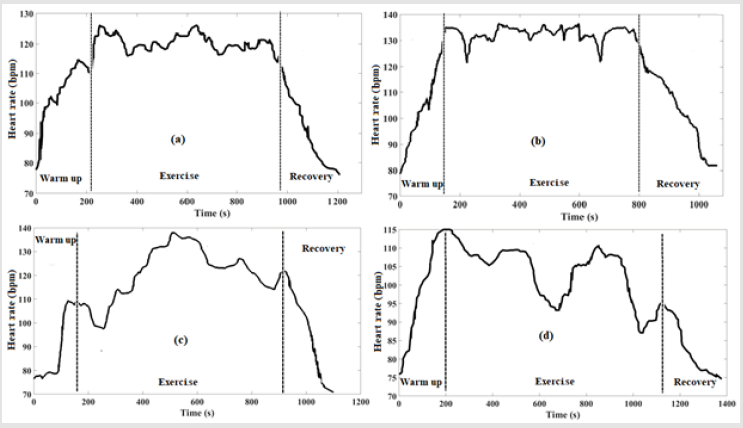
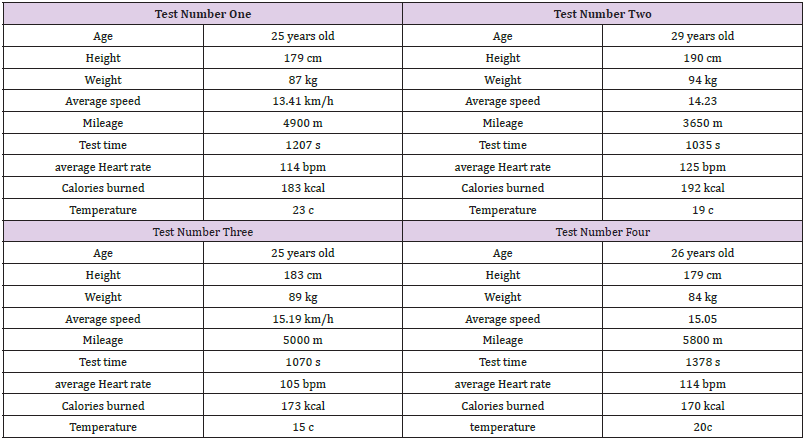
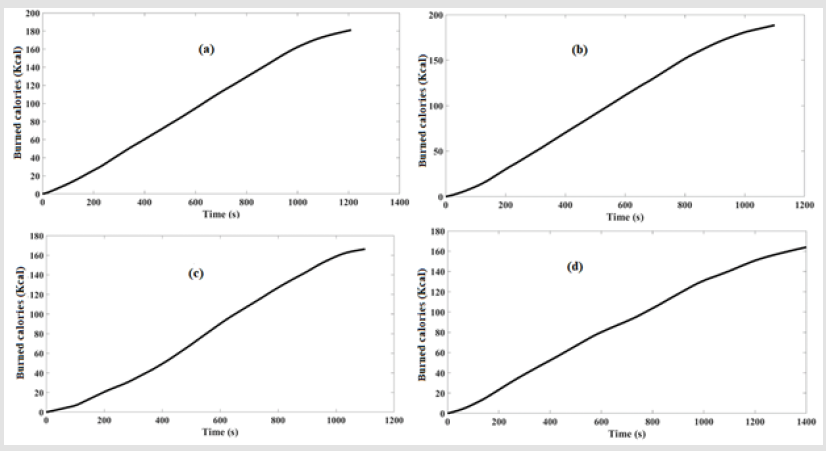
An examination has been done on four people to ride a bicycle around the soccer field in Iran university of science and technology. The drivers were supposed to continue riding until they feel tired. These people aged from 25 to 35 years old and weighed from 85 to 95Kg. Table 4 shows these four people’s characteristics and results. The purpose of these tests is to determine the tiredness threshold in young students. The students rode the bicycle to reach this threshold then they stop. According to Figure 3, At the beginning of the test, the heart rate gradually increases at the warm-up level. After a while, the heart rate reaches its peak value. In this situation, the driver is close to the fatigue level. By feeling tired, the driver reduces the speed to stop the riding afterward. In recovery duration, the heart rate reduces due to driver low activity. As it is evident in Figure 3, the students have different recovery start time. Figure 4 shows the corresponding calorie burning to the driver’s heart rate. The burning calorie in these tests is obtained by Mi Band 3 heart rate sensor installed on the driver’s wrist. The diagrams in Figure 4 are monotonically increasing functions. Because the calorie burning is accumulative. Table 5 shows the other eight peoples test and their results.
Driver’s Fatigue
To consider the limitation in optimization section, it is required to determine the tiredness level of each driver in burning calories according to his or her physical traits. The experimental tests show that in a certain range of age and weight, the burned calories are about 180 Kcal in the condition that the driver reaches the fatigue threshold. Equation (3) obtains the tiredness fatigue level for a wide range of age between 15 to 75 years old. The factors a1, a2, a3 and, a4 are evaluated by Table 3 according to the driver’s mass range. The tiredness level is determined in burned calories (Kcal) to limit the maximum allowable calorie burning before the driver becomes tired. These factors are obtained by poly fitting among the data are extracted from online software. Equation (3) and Table 6 cover age and weight variables to find the tiredness level.
T = a1 ×w3 + a2 ×w2 + a3 ×w+ a4 (3)
Figure 3: Driver’s heart rate.
(a) Test number one.
(b) Test number two.
(c) Test number three.
(d) Test number four.
Figure 4: Calorie burning experimental tests.
(a) Test number one.
(b) Test number two.
(c) Test number three.
(d) Test number four.
Conclusion
It is required to understand the performance of both human and electric power source for energy management in a pedal-assist electric bike. For recognizing the human power source, a test on students have been performed to determine the fatigue threshold for different physical body situation. Equation (3) is the fatigue threshold determiner. By poly fitting among the data that are obtained by experimental tests and online software, this equation is extended for other range of age and weight. This equation evaluates the maximum burned calorie in the condition that the cyclist will not get tired and this evaluation depends on the driver’s age and weight. This is very useful to design a controller to switch between these two power sources. In other words, this is a basic step for making smart this knid of bicycles. After importing the route, the processor can make a plan for switching in a case that the driver could pass the route without getting tired and the battery level stays in a high position as much as possible.
References
- S Berntsen, L Malnes, A Langåker, E Bere (2017) Physical activity when riding an electric assisted bicycle. Int J BehavNutr Phys Act14(1): 55.
- P Spagnol, G Alli, C Spelta, P Lisanti, F Todeschini, et al. (2012) A full hybrid electric bike: How to increase human efficiency. 2012 Am Control Conf 6314871: 2761-2766.
- B Sperlich, C Zinner, K Hebert Losier, DP Born, H C Holmberg (2012) Biomechanical, cardiorespiratory, metabolic and perceived responses to electrically assisted cycling. Eur J Appl Physiol 112(12):4015-4025.
- JE Bourne, Sarah Sauchelli, Rachel Perry, Angie Page, Sam Leary,et al. (2018) Health benefits of electrically-assisted cycling: A systematic review 11 Medical and Health Sciences 1117 Public Health and Health Services. Int J BehavNutr Phys Act 15(1):116.
- AOW Natera, J Jennings, AJ Oakley, TW Jones (2019) Influence of environmental conditions on performance and heart rate responses to the 30-15 incremental fitness test in rugby union athletes. J Strength Cond Res 33(2):486-491.
- RAA E Oliveira, HVR Spineli Silva, F R De Oliveira (2017) Acclimated young and adult athletes present a psychophysiological response and exercise tolerance that is similar under cool environmental conditions and under impeded dehydration during long distance running. J Phys Educ Sport 17(1):371-377.
- Annika Hackemann, KrusemarkHelge (2019) Sports Under Extreme Conditions. Sport Med Physician.pp. 481-487.
- P Schantz (2017) Distance, duration, and velocity in cycle commuting: Analyses of relations and determinants of velocity. Int J Environ Res Public Health 14(10): 1166.
- SL Halson (2014) Monitoring Training Load to Understand Fatigue in Athletes Shona L Halson Ó. Sport Med 44(2): 139-147.
- JBF Vercruyssen, R Suriano, D Bishop, C Hausswirth (2005) Cadence selection affects metabolic responses during cycling and subsequent running time to fatigue. Br J Sports Med 39(5):267-272.
- EKK, DidaceNdahimana (2017) Measurement Methods for Physical Activity and Energy Expenditure: a Review. Clin Nutr Res 6(2): 68-80.
- NAR, MS Koehle (2019) Optimizing recovery to support multi-evening cycling competition performance. Eur J Sport Sci 19(6): 811-823.
- M De Almeida Mendes,InácioDa Silva, VirgílioRamires, Felipe Reichert,Rafaela Martins, et al. (2018) Metabolic equivalent of task (METs) thresholds as an indicator of physical activity intensity. PLoS One 13(7):1-10.
- KeytelLR, GoedeckeJH, Noakes TD, HiiloskorpiH, Laukkanen R, et al. (2008) Prediction of energy expenditure from heart rate monitoring during submaximal exercise Prediction of energy expenditure from heart rate monitoring during submaximal exercise. J Sports Sci 23(3):289-297.

 Review Article

