 Mini Review
Abstract
The increasing incidence of fractures or bone accidents for aged or injured patients is seen as a challenge for experts. Following our study of an accidental case wearing a prosthetic leg, the risk of poor adaptation to the ankle following the change in biomechanics was described. This study aims to analyze the evolution of the proximal biomechanics of this leg assembly using dynamic calculation fluid analysis (CFD) and to extract parameters such as deformation and stress measurements which could predict the probability of well adaptation inside the ankle and simulate the measurement of strain and stress. A 3D leg assembly model is constructed by configuring the material and the boundary conditions and respecting the specific characteristics of the patient, providing a realistic and efficient structural analysis. This study describes a 3D construction process for the ankle in leg assembly as well as the generation of the mesh on the basis of a parallel processing of 16 processors turned in the cloud.
Keywords: 3D Leg Assembly; Ankle; Boundary Conditions; CFD; Stress; Strain
Mini Review
Imaging techniques are considered useful approaches for nondestructively describing synthetic or natural biomaterials [1]. The mechanisms of orthopedic prostheses and the local CFD flow phenomena are still ambiguous for the experts. In particular, the distribution of flow in the prosthesis system of patients with bone diseases is a challenge to understand. For decades, the intrinsic movement of the foot and ankle complex during walking activity has been hindered by simplified foot modeling as a single functional segment [2]. The issue has partially remedied for the development of three-dimensional (3D) multi-assembly foot models [3]. Therefore, these 3D models of established lower limbs have proven their clinical impact by detecting impairments in foot mobility. In a more specific way, the biomechanics of the foot and ankle was analyzed via the kinematics of the walking cycle treated in different fields such as invasive bone pins, biplanar video radiography [4], studies of non-invasive surface markers [5,6]. As well as study of foot kinematics using a dynamic walking cadaver model, and plantar strain measurements [7-11]. Improvements in imaging techniques combined with advanced simulation methods, such as CFD, can provide better understanding as well as meaningful analysis measures for our leg assembly case and in a more specific method to perform the strain and stress at the ankle joint.
Material and Methods
A 3D model was produced for the leg assembly with 0,5 m of length and steel material composed of 738 faces 13 volumes, 1259 nodes, 1955 edges. A Tet-Dominant algorithm was run for fast generation and automated tetrahedral meshes as described in [12]. The linear elastic behavior has been described with the initial conditions for the Young’s modulus, the Poisson’s ratio and the density parameters. the ankle joint with 0,1 m of length is made of aluminum material with a modeling of 4 volumes composed of 130 faces, 4 volumes, 219 nodes, 335 edges as shown in Table 1.
Result
The ankle prosthesis was tested under three axes of translation in the nodal directions x, y and z and rotations around the nodal directions x, y and z (Figure 1a). A Tet-Dominant Algorithm was executed for the quick generation and automated tetrahedral meshes is detailed systematically. the force exerted in part 1 is defined 1.30e + 3 N for the x axis and -750 N for the Y axis and the fixed support is defined for part 4. The generation of the mesh presented in (Figure 1b) Finished with 54k cells and 14.4k nodes. For a given load, the external surface is subjected to bearing force constraints. The stress analysis for the three attempt occupies a mean total of CPU Time = 3.36 s, a mean CPU time for a total use = 2.98 S and an average CPU time for the remaining = 35994588.64 s second. The displacement (Figure 2a) of the stress simulation is shown in Figure 2b and the strain measurement in Figure 2c in the ankle. Therefore, what is perceived as a result that the force exerted could give interesting indications on stress measurements in as well as a velocity displacement vector that increases viewing the stress pressure compared to the force of support on the ankle prosthesis.
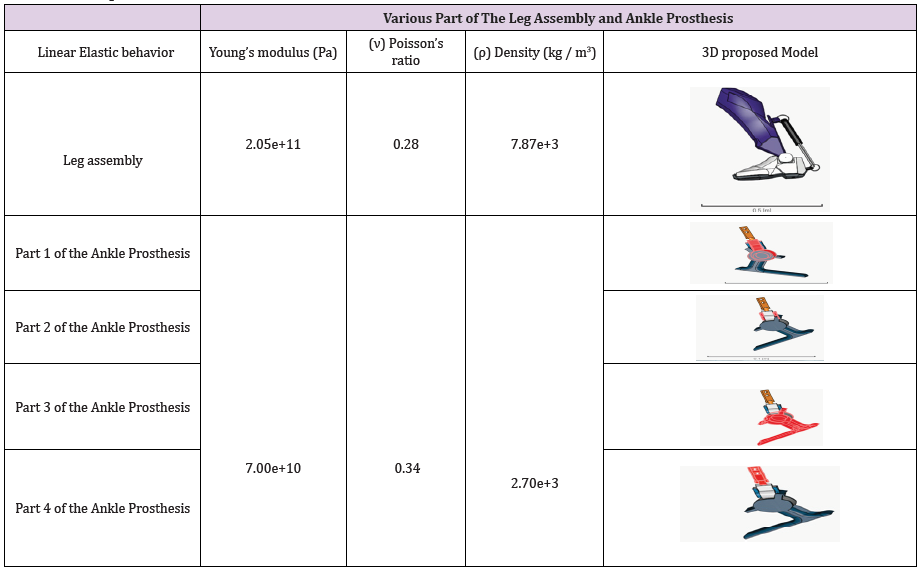
Table 1: Description of the Materials.
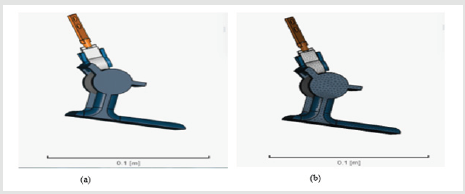
Figure 1: (a) Original Model of the ankle prosthesis (b) Mesh of the ankle prosthesis.
The CFD analysis revealed that the main stresses provided results to describe the main delaine strains of the different significant forces. The critical values of the main tensile strains were located part 4, a typical region of joint concentration, and the main strains. This analysis shows that the displacement increases from part 4 to part 3 and the strain decrease the joint of ankle in part 4.
Discussion
Recently, the biomechanics of the foot and ankle have been mainly described by the kinematics of the walking cycle. Increasing attention in methodological studies for multi-segment and clinical kinetic foot models ensuring the perspectives in which the intrinsic foot joints can have individual power distributions [13]. Another point of interest raised is the functioning of the joint during propulsion, which tends to absorb relatively more power than the distal joints of the ankle joint. Among all the joints of the foot, the ankle undergoes the greatest range of motion while moving in opposite directions during the majority of the support phase of the process. There are several limitations to this study, the first drawback concerns the estimation of the center of pressure and the resultant reaction forces for each foot segment, derived to combine the data of force and pressure. Use of a proportionality system was initially validated for the calculation of the articular kinetics of a three-segment foot model and not for a four-segment foot model [14,15].
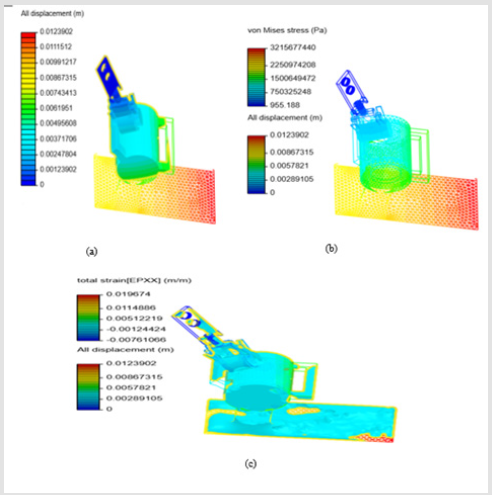
Figure 2.
Conclusion
This study reports an attempt to perceive the kinetic behavior of several joints of the foot through the estimation of stress and strain during the act of walking. The ankle joints of the foot adopt a stabilized resistive configuration during most of the support phase. The concept of stabilization, resistance and propulsion should be studied in subjects with foot and ankle disorders
Acknowledgment
International Medical Carthage Center supported this work. Special thanks to the medical staff for providing us with as access to the archive of patients and the administrative framework for the warm welcome in their team.
Conflicts of Interest
No conflict to declare.
References
- Mootanah R (2006) Creation of accurate 3D models of reconstructed bones and joints for evaluations of surgical fixation techniques by finite element analysis. Journal of Biomechanics 39: S424..
- Deschamps K, Filip Staes, Philip Roosen, Frank Nobels, KaatDesloovere, et al. (2011) Body of evidence supporting the clinical use of 3D multisegment foot models: a systematic review. Gait Posture 33(3): 338‑
- Bruening DA, Takahashi KZ (2018) Partitioning ground reaction forces for multi-segment foot joint kinetics. Gait Posture 62: 111‑
- Kessler SE, Michael J Rainbow, Glen A Lichtwark, Andrew G Cresswell, Susan E D'Andrea, et al. (2019) A Direct Comparison of Biplanar Videoradiography and Optical Motion Capture for Foot and Ankle Kinematics Front. Bioeng. Biotechnol 7.
- Westblad P, Hashimoto T, Winson I, Lundberg A, A Arndt (2002) Differences in ankle-joint complex motion during the stance phase of walking as measured by superficial and bone-anchored markers. Foot Ankle Int 23(9): 856‑863
- ZorinaOA, Boriskina OA, Magomedov RN, Prohodnaya VA, Mironycheva KV, et al. (2019) [Dynamics of bone metabolism markers in oral fluid after surgical treatment of chronic periodontal disease with various osteoplastic materials]. Stomatologiia (Mosk)98(2): 27‑30
- Nester C, Jones RK, Liu A, Howard D, Lundberg A, et al. (2007) Foot kinematics during walking measured using bone and surface mounted markers. J Biomech 40(15): 3412‑
- Nester CJ (2009) Lessons from dynamic cadaver and invasive bone pin studies: do we know how the foot really moves during gait?. J Foot Ankle Res 2: 18
- Leardini A, BenedettiMG, Berti L, Bettinelli D, Nativo R, et al. (2007) Rear-foot, mid-foot and fore-foot motion during the stance phase of gait . Gait Posture 25(3): 453‑
- Nester CJ, Liu M, Ward E, Howard D, CochebaJ, et al. (2007) In vitro study of foot kinematics using a dynamic walking cadaver model. Journal of Biomechanics40( 9): 1927‑
- Lundgren P, Nester C, Liu A, Arndt A, Jones R, et al. (2008) Invasive in vivo measurement of rear-, mid- and forefoot motion during walking.Gait Posture28(1): 93‑
- Sakly H, SaidM, Tagina M (2019) Femur Bone Stress Analysis in CFD Modules with Parallel Processing. IJEAT 9(2): 903‑
- Bruening DA, CooneyKM, Buczek (2012) Analysis of a kinetic multi-segment foot model. Part I: Model repeatability and kinematic validity. Gait Posture 35(4): 529‑
- Jacob (2001) Forces acting in the forefoot during normal gait - an estimate. Clinical Biomechanics16 (9): 783‑
- Kelly LA, Cresswell AG, Racinais S, Whiteley R, Lichtwark G (2014) Intrinsic foot muscles have the capacity to control deformation of the longitudinal arch. Journal of The Royal Society Interface11(93): 20131188.
