 Research Article
Abstract
Aims: In order to identify the potential therapeutic target genes of Bronchopulmonary dysplasia (BPD).
Methods: GSE25293 identified the hub gene of the core module by weighted coexpression network analysis (WGCNA); the GSE25286 microarray data screened genes with the same trend through the Series Test of Cluster (STC), and used the limma algorithm to screen differentially expressed genes (DEGs), and the difference gene was analyzed with the target gene.
Results: Autophagy, EMT, cell cycle, proliferation, VEGF and Notch pathway, and found the potential 8 target gene of BPDs.
Conclusion: BPD-related mechanisms and hub genes, speculated that Prokr2 / VEGF pathway, IFIT1 or IFIT3 / EMT pathway and Agt / VEGF pathway may be important pathways for BPD.
Keywords: Weighted Co-Expression Network Analysis; The Series Test of Cluster; Bronchopulmonary Dysplasia; Bioinformatics Analysis
Abbreviations: BPD: Bronchopulmonary Dysplasia; CLD: Chronic Lung Disease; EPI: Early Preterm Infants; PS: Pulmonary Surfactant; GEO: Gene Expression Omnibus; DEG: Differential Published Gene; WGCNA: Weighted Gene Co-Expression Network Analysis; STC: Series Test of Cluster; TOM: Topological Overlap Matrix; GS: Gene Significance; VEGF: Vascular Endothelial Growth Factor
Introduction
Bronchopulmonary dysplasia (BPD), also known as Chronic
lung disease (CLD), is a chronic lung disease caused by a
combination of various factors, impaired alveolar and pulmonary
vascular development [1]. In preterm infants with gestational age
<32 weeks, the incidence of BPD was 12% to 32% [2], and ultralow
birth weight infants (ELBWI) (birth weight <1000g) and very
early preterm infants (EPI) (fetal age <28 weeks) BPD incidence
rate of up to 50% [3]. In recent years, due to various environmental
and social factors and prolonged oxygen exposure, prenatal
glucocorticoid application, continuous improvement of mechanical
ventilation technology etc., especially the widespread application
of Pulmonary surfactant (PS), neonatal classic “BPD” “The new type
of “BPD” has been transformed, and the survival rate of premature
infants has increased. At the same time, the incidence of BPD has
increased, which seriously affects the quality of life and long-term
prognosis of preterm infants. Currently, there is no effective method
for preventing or treating BPD in clinical practice [4]. The new BPD
has become a problem that can’t be ignored in neonatal intensive
care unit, which seriously affects the prognosis and quality of life
of children.
It is currently considered that BPD is a multifactorial disease.
Severe BPD mortality rate of up to 25%(2019), survival children
had a higher risk of diseases such as retinopathy of premature
infants and high airway response, and the incidence of cognitive,
educational, and behavioral disorders in children with BPD were
also significantly higher [5]. Therefore, BPD has become one of the leading causes of disease and death in premature infants, and
research on the pathogenesis, prevention and treatment of BPD has
become a hot topic in the field of neonatal care. It is urgent to study
its pathogenesis, prevention and treatment. With the development
of genomics and epigenomics, modern medicine has entered the era
of precision medicine. Through the bioinformatics analysis of BPD,
many molecular markers related to the occurrence, metastasis,
drug resistance and prognosis of BPD were found. Further research
based on genomic big data is of great significance for finding the
target of diagnosis, treatment and prognosis of BPD.
Currently, microarray technology has become an indispensable tool for detecting genomic expression levels in specific organisms. Gene Expression Omnibus (GEO) was created in 2000 as a global resource for international public repository and gene expression research. It can upload and download genomic data sets acquired by microarrays, next-generation sequencing and other forms of high-throughput functions [6]. The advantage of integrated bioinformatics analysis is that it can overcome sample heterogeneity and platform variability and integrate data from different independent microarray studies to obtain more clinical samples for more reliable analysis. This study screened the differential published gene (DEG) using the limma differential screening algorithm and standardized methods in the GSE25286 microarray data downloaded from GEO. Weighted Gene Co- Expression Network Analysis (WGCNA) can be used to explore the relationship between genes and phenotypes, which can be analyzed by transforming gene expression data into co-expression modules. The WGCNA method can be used to mine specific disease-related modules and genes associated with specific traits, and to further discover related genes and predict gene function by analyzing hub genes.
WGCNA is widely used in a variety of biological process analysis to deal with differentially expressed genes and gene interactions to identify therapeutic targets or candidate biomarkers. This study is based on the BPD gene expression microarray data GSE25293, which uses WGCNA to construct a co-expression module to screen hub genes for specific modules. The Series Test of Cluster (STC) is the discovery of the trend characteristics of gene expression, and the genes of the same change characteristics are concentrated in a trend, so as to find the most representative gene group in the process of experimental changes, revealing that the biological sample is in the process of change. In this study, a trend analysis was performed on the BPD gene expression microarray data GSE25293, and genes that met the trend of change were screened for further analysis. Finally, we screened the differential genes generated by WGCNA and time series trend analysis, and analyzed the correlation between the genes whose expression trends increased or decreased, and the related genes of the traits we were concerned with and analyzed the gene interaction network to find the hub gene.
Materials and Methods
Microarray Data
The GSE25293 microarray data contributed by Jie et al. was selected in the GEO database (http://www.ncbi.nlm.nih.gov/ geo/) (https://www.ncbi.nlm.nih.gov/geo/query/acc.cgi) and GSE25286 microarray data ( https://www.ncbi.nlm.nih.gov/geo/ query/acc.cgi?acc=GSE25286), both data BPD were created using neonatal mouse hyperoxic mode. The model, which was exposed to hyperoxia for 14 days and 29 days, was subjected to mRNA and miRNA microarray analysis of gene expression profiles, and was based on the GPL1261 platform (Affymetrix Mouse Genome 430 2.0 Array), containing 20 sample data, The study extracted 8 sample data, including 2 control mice, 3 hyperoxic treatments for 14 days, and 3 hyperoxic treatments for 28 days (submission date: November 11, 2010). GSE25293 was used as a further weighted gene. Expression Network Analysis (WGCNA); GSE25286 data set for trend analysis (STC) and limma algorithm for differential expression gene analysis.
Weighted Gene Co-Expression Network Analysis (WGCNA)
A gene co-expression network was constructed for GSE25293 microarray data using the WGCNA package in R. To create a network with a near-scaled topology, we installed a soft threshold power of β = 4 (scale free R2 = 0.88). The adjacency matrix was calculated and converted into a topological overlap matrix (TOM). Gene module was detected using a dynamic tree cutting algorithm. The genes in the same module had similar expression patterns, and the first principal component (MEs, Module eigengene) of each module was calculated to represent the gene expression profile of the entire model. And based on the MEs data, the expression trend graph of each module was drawn. We screened the block diagrams (including downtrends and uptrends) that met the expression trends based on the inter-group processing and time gradients within the microarray data. Gene significance (GS) was defined as the correlation coefficient between gene expression and modular traits. The characteristic genes of each module were calculated as a summary of each module. Module significance was defined as the correlation coefficient between the module’s characteristic genes and traits.
Series Test of Cluster(STC)
Trend analysis (STC) of the GSE25286 data set, when the organism is in a certain order or stimulated by the external environment, the changes in gene expression had different trend characteristics. These genes with the same changing characteristics were clustered in a trend graph. The purpose of STC analysis was to find the trend characteristics of gene expression and to find the most representative gene group during the sample sequence change, with P < 0.05 as the threshold. The STC algorithm of gene expression kinetics was used to profile the gene expression time series to determine the most likely cluster set. The method explicitly considers the dynamic characteristics of gene expression profiles during clustering and identifies multiple different clusters. Differentially expressed genes were selected according to RVM corrected analysis of variance (ANOVA). Based on the trend of gene signal density under different conditions, we identified a unique set of expression trends. The original expression value was converted to a log2 ratio. Using a clustering strategy for timeseries gene expression data, we defined a unique spectrum. The expression profile was related to the actual or expected number of genes assigned to each profile. Significant profiles had a higher probability than Fisher’s exact test and multiple comparison tests.
Differential Expression Gene Analysis
The gene expression matrix of the GSE25286 microarray data was downloaded from GEO and screened for DEGs using the limma package in R 3.4.1. The DEG was down-regulated and the DEG was down-regulated according to the expression of DEG. Where |log2FC (fold change) |>0 and P<0.05 were used as interception criteria for screening of DEGs.
Target Gene Association Analysis
We have collected a wide range of target genes that have been extensively studied and studied by their mechanisms of action, and classified them as apoptosis, Epithelial interstitial transformation (EMT), progression, G0_G1 (Cell cycle-chromatin, protein replication) and G2_M (Cell Cycle-division) and Immune microenvironment. For each type, we calculated the correlation between the studied gene and the target gene based on the expression profile data and performed statistical tests. A scatter plot was drawn for each group of statistically significant genes, and all correlations under a certain classification were shown in heat maps.
Gene Interaction Map
Firstly, in the STRING online database (http://string-db. org), the difference genes between WGCNA and time series trend analysis and the differential analysis of the expression trend of the rise or fall of the DEGs were analyzed by gene interaction network, and then according to KEGG The inter-genetic relationship between the genes recorded in the database was used to generate a table of inter-genetic signal transduction network relationships using GeneAct software. Based on the signal transduction relationship of genes, a gene interaction network was constructed. Each node represents a protein or gene or other molecule, the edge between nodes represents their interaction, and degree represents their number of connections.
Result
WGCNA Analysis
A total of 45,101 genes expression profiles were obtained by data analysis, and the low expression genes were filtered to obtain 21,815 highly expressed genes. The sample clustering and trait association of gene expression levels were calculated. The results of Figure 1A indicated that the gene clustering tree of each tissue can correspond well with the tissue. By filtering the weight values, finally selecting β=4 to construct the network, using the dynamic cut tree method to merged similar modules, and obtaining 9 coexpression modules, different colors represent different modules, and Grey modules were a group of unallocated. Gene collection to other modules. The number of genes in the module was clustered according to the expression level, and the genes with higher clustering degree were assigned to a module, and clustering analysis was performed according to the inter-gene expression level, and the correlation between the modules is obtained.
The graph, whose dendritic diagram showed a module that was significantly associated with the clinical phenotype of BPD (Figure 1B), randomly selected 1000 genes in the heatmap (Figure 1C). Eigengene dendrogram and heatmap were used to identify related eigengenes. By observing the absolute value between the module and the sample time characteristic of Figure 1D, the absolute values of the module and turquoise modules and sample time characteristics were as high as 0.86 and 0.97, of which the brown module had a negative correlation trends; the turquoise module had a positive correlation trend, and selected these two modules were tissue specific modules. Tissue-specific modules may be involved in tissue-specific biological processes. To validate the reliability of co-expression network construction and tissue-specific modules, these two specific modules were analyzed.
Series Test of Cluster
The gene expression dynamics STC algorithm was used to analyze the genes of the GSE25286 microarray data (p < 0.05) and to determine the most likely profile in the time series. 21,815 differentially expressed genes were placed into eight expression pattern spectra using STC analysis (Figure 2). The horizontal axis represented the time point, 14 days at 1.0, and 29 days at 2.0; the vertical axis represented the expression change (log2 ratio). Profile1 (P = 0), profile6 (P = 6 e183), profile7 (P = 4 e-88) and profile0 (P = 1.9 e-71) were confirmed to be significant STC clusters (p < 0.05). The STC method explicitly considered the temporal characteristics of gene expression profiles during clustering and determines the number of different clusters.
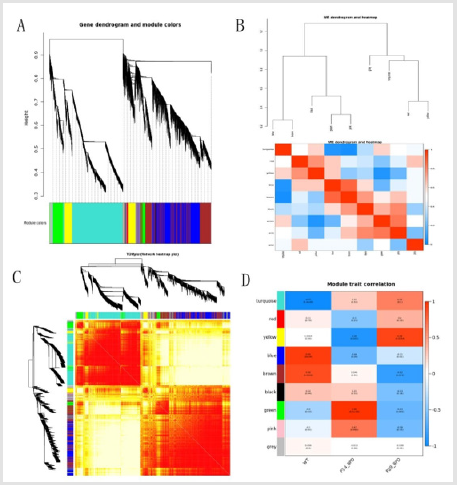
Figure 1: WGCNA of the BPD samples.
(A) Clustering dendrograms for the 21,815 genes with dissimilarity based on the topological overlap together with the assigned module colors. Twelve co-expression modules were constructed with various colors. The relationship between gene dendrogram and gene modules were up and down of the image. (B) The eigengene dendrogram and heatmap identify groups of correlated eigengenes termed meta-modules. The dendrogram indicated that the Turquoise module and Brown module were highly related to the BPD, among them, brown module was negatively correlated. Turquoise module has a positive correlation trend. The heatmap in the panel showed the eigengene adjacency. (C) Visualizing 1,000 random genes from the network using a heatmap plot to depict the TOM among the genes in the analysis. The depth of the red color was positively correlated with the strength of the correlation between the pairs of modules on a linear scale. The gene dendrogram and module assignment were shown along the left side and the top. (D) Module-trait relationships. Each row corresponds to a module eigengene, each column corresponded to a trait(WT,P14_ BPD and P29_BPD), and each cell consists of the corresponding correlation and P-value, which were color-coded by correlated according to the color legend. Among them, the Brown and Turquoise modules were the most relevant modules to the BPD mice models.

Figure 2: Gene expression trend model, each box had a top box to the left of the figure is the serial number of the trend, box line depicted the experiment during different node model to express the change of the quantity, from left to right in turn to WT, BPD_P14, BPD_P29, the bottom of the box on the left side of the number of P the smaller the value of numerical model credibility is higher, the trend of a significant change in red and green, screening standard defaults to P - value < 0.05, including red significantly upward trend, green suggested significant downward trend.
Therefore, the genes in profile 1, profile 6, profile 7, and profile 0 were confirmed to be more meaningful and valuable.
Differentially Expressed Gene
The microarray GSE25286 data set sample BPD was modeled in neonatal mouse hyperoxia mode, including 2 controls, 3 hyperbaric treatments for 14 days, and 3 hyperoxic treatments for 28 days. The differentially expressed genes between the groups were calculated by the R software limma package. The upper and lower DEGs were screened by |log2FC |> 1 and FDR < 0.05. The results are shown in Table 1.
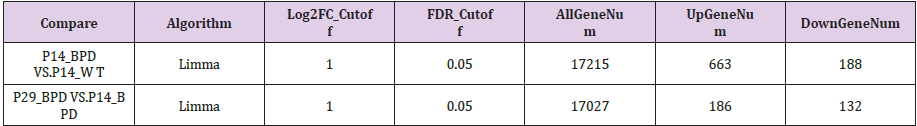
Table 1: DEGs in Microarray data GSE25286.
Intersection Gene
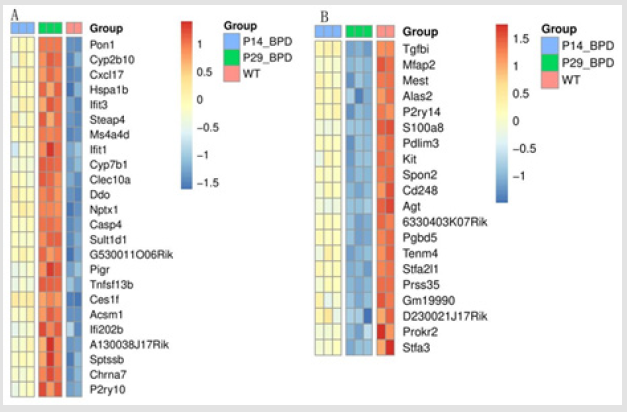
Figure 3: Screening of WGCNA and time series trend analysis (STC) results in the intersection of differential genes and differential analysis expression trends.
(A) The intersection of genes with increased expression in all three.(B) The intersection of genes with decreased expression in all three.
Based on the above results of screened WGCNA and result of time series trend analysis of the difference gene and the result of the difference analysis of the expression trend of the increase or decrease of the results of the cross-section for subsequent analysis, the gene intersection results were shown in Figure 3.
Target Gene Association Analysis
To further guide the relevant studies, we collected apoptosis, epithelial interstitial transformation (EMT), proliferation, G0_G1 (Cell cycle-chromatin, protein replication), G2_M (Cell cycledivision), vascular endothelial growth factor (VEGF), Notch pathway and Immune microenvironment related genes, and classified according to different functions and periods of action. Correlation analysis was performed on the genes of interest and the target genes of different classifications to further speculate on the potential function of the differential genes. From Figure 4, we can visually see the correlation between the gene of interest and the target gene of this type of function (or period) and speculate on its possible mechanism of action.
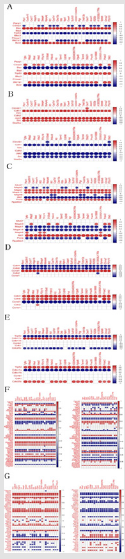
Figure 4: Figure 4A-G were the correlation analysis between the intersection gene and the target genes of apoptosis, EMT, GO-G1, G2-M, proliferation, VEGF pathway and Notch pathway, in which the upper Figure 4A-E were the up-regulated gene and the lower was the down-regulated gene; Figure 4F-G left The side was the up-regulated gene and the right side was the down-regulated gene. In the correlation graph, the left side was the pathway gene of the group, the top was the research gene, the vertical axis was the expression value of the target gene, and the horizontal axis was the expression value of the gene of interest, and each point indicated the correlation between the two genes. The color of the point represented the correlation coefficient size, the legend on the right.
In the correlation analysis with the target gene, it was found that the correlation between the up-regulated cross-over gene and the down-regulated cross-over gene and its target gene was generally opposite, and Casp3, Bax, Trp53, Aktls1 and Bcl2 were involved in the process of apoptosis; the EMT process involved Cdh1. Jak2 and Src; proliferation process involves Mapk3, Mapk1, Mapk14, Mapk8, Aktl and Pcna; Cell cycle (G0-G1) involves Cdk4, Cdk6 and Ccnd1; Cell cycle (G2-M) involves Trp53, Cdkn1a and Cdc25c; The genes involved include: Rac1, Kdr, Hspb1, Ppp3ca, Aktl1, Mapk14, Mapk1, Raf1, Pik3ca, Pik3r3, Prkca, Pik3cd, Mapk13, Mapkapk3, Src, Pla2g4a, Ptgs2, Casp9, Pik3cb, Sphk1, Prkcb, Nfatc2, Ppp3cc, Pla2g4c, Shc2 and Pla2g4e; involved in the Notch pathway Dvl1, Kat2b, Numb, Notch1, Ep300, Jag1, Crebbp, Snw1, Rbpj, Notch2, Dtx3, Aph1b, Rfng, Dtx2, Lfng, Jag2, Ncstn, Aph1c, Numbl, Dtx1 , Dvl2, Dvl3 and Maml.
Gene Interaction Network Map and Hub Gene
The difference analysis overlapped the up-regulated genes and the intersection down-regulated genes interaction analysis, and we screened the results with a correlation score greater than 0.9. In order to more intuitively observe the interaction between the genes of interest and understand the mechanism of action in different situations, we used GeneAct software to map the intergenetic signal transduction network relationship according to the inter-genetic regulation relationship recorded in the KEGG database. Based on the signal transduction relationship of genes, a gene interaction network was constructed. A total of 8 of the 44 DEGs were filtered into the Gene interaction network complex, containing 8 nodes and 6 edges, as shown in Figure 5. In the Gene interaction network, some central node genes were called “hub genes” because they have interactions with various genes and were at a critical position in the network of gene interactions and were potential drivers of disease development. As shown in Figure 4, 8 of the 44 crossover genes were hub genes (screening criteria are >0.9), of which 3 were up-regulated (Ifit3, Ifit1 and P2ry10), and 5 were down-regulated (P2ry14, Agt, Stfa2l1, Prokr2, and Stfa3).

Figure 5: Gene interaction network diagram. The nodes represented genes, and the straight lines represented the regulatory relationships of gene presence. The legends showed the meanings of different color lines. The size of the nodes represented the degree value, and the color depth represented the fold difference in gene expression.
Discussion
In this study, the GSE25293 microarray data from GEO was
analyzed by weighted gene co-expression network. The gene
expression profile of the microarray data was divided into 9
modules, and the correlation analysis between modules and BPD
clinical target traits was carried out. Screen out the key modules
of the brown module and the turquoise module and the hub genes
in the module. At the same time, the GSE25286 data set was
analyzed for STC and gene expression differences. The above three
methods were used to screen the differentially expressed genes
for up-regulation and down-regulation, and 24 were obtained.
The crossover genes were up-regulated, and 20 cross-over genes
were down-regulated. In order to further speculate the potential
function of differentially intersecting genes, the correlation
between differentially intersecting genes and target genes was
analyzed, and it was speculated that apoptosis, EMT, proliferation,
Cell cycle, VEGF and Notch pathways were important mechanisms
of BPD. Finally, through the analysis of gene interaction network,
we screened 8 genes of Ifit3, Ifit1, P2ry10, P2ry14, Agt, Stfa2l1,
Prokr2 and Stfa3, which may be potential target genes for BPD.
Studies have shown that high concentrations of oxygen and
other factors induced Caspase3, Caspase12, Caspase8, Bax activity
and other apoptotic genes, and inhibit the expression of Bcl-
2 and Bcl-xl and induced excessive apoptosis and inhibition of
type I alveolar epithelial cells (AECI). Its proliferation, which was
crucial for the development of BPD [7]. Oxygen damage leaded to disruption of lung repair capacity and stagnation of lung growth
by inhibiting proliferation of human fetal lung mesenchymal stem
cells, a signal pathway that exogenous mesenchymal stem cells
may lose by triggering damage to endogenous lung mesenchymal
cells Promote endogenous lung mesenchymal cell proliferation
and alleviate BPD [8]. EMT played an important role in embryonic
development, chronic inflammation, tissue remodeling, cancer
metastasis and various fibrotic diseases, and was an important
step in causing pulmonary fibrosis [9]. Pulmonary fibrosis was an
important pathological feature of BPD. Studies have shown that in
vitro hyperbaric treatment of lung fibroblasts for 48 h can inhibit
cell proliferation and reduce collagen expression [10].
Studies on cell cycle have found that hypoxia promotes the expression of PCNA, Cyclin E, and Cyclin A, increasing more cells from G0/G1 to S phase, and inducing activation of AKT protein, glycogen synthese kinase-3β (GSK) -3β), which in turn promotes EMT [11]. The study found that hyperoxia treatment increased the expression of Bax and Bim, decreased the levels of Bcl-2 and CycilnD1, while antioxidant treatment played a strong protective effect on Bcl-2 family and CycilnD1, indicating Bcl-2 family and CycilnD1. Participated in anti-pulmonary oxidative damage [12]. Studies have found that fetal and neonatal expression of VEGF and VEGF receptor (Flt-1), suggesting that VEGF may play a physiological role in human lung development. VEGF was mostly expressed in bronchial epithelial cells and alveolar macrophages, and Flt-1 was mainly expressed in vascular endothelial cells and bronchial epithelial cells [13]. In the fetal lungs of human mid-pregnancy, VEGF protein and mRNA were restricted to distal epithelial cells, and their expression levels were gradually increased, while VEGF levels were decreased in children with BPD.
The pathological features of some children with BPD were decreased alveolar number and pulmonary microvascular development disorder, and the simple alveolar and pulmonary microvascular abnormalities eventually leaded to a decrease in blood gas exchange function. Studies have used VEGF receptor inhibitors or special anti-angiogenic drugs to effectively reduce pulmonary microangiogenesis, obstruct the alveolarization process, significantly reduce the number of alveolar and gas exchange areas, and present pathological features similar to BPD [14]. Studies have shown that Notch signaling pathway plays an important role in lung damage [15]. Notch signaling pathway can regulate the proliferation, differentiation, migration and maturation of alveolar epithelial cells and vascular endothelial cells by mediating the expression of transcription factors. In the immune system, the Notch signaling pathway not only regulated the production of T and B cell lineages, but also regulated the differentiation and function of peripheral mature T cells and their subpopulations [16]. Hsu et al. found that overexpression of the lfit3 gene increases cell viability, suggesting that the molecule played a role in maintaining cells in IFN-mediated survival effects [17].
However, studies have found that in U937 cells, ectopic expression of lfit3 leaded to increased accumulation of cells in G(1)/S transition and growth arrest [18]. Interferon induced protein with tetratricopeptide repeats 1 (Ifit1) encoded a protein containing a tetrapeptide repeat, a member of the interferoninducible protein family, with a tetrapeptide repeat (lfits) possibly involved in inhibition of viral replication and translation initiation [19]. Its product p56 protein was involved in inhibiting translation initiation, antiviral action and inhibiting cell migration and antiproliferative effects [20]. Importantly, lfit1 contained multiple repeats of the four-reverse transcript repeating helix-turn-helix motif, which readily bound to various proteins and mediated protein-protein interactions, involving translation initiation, double-stranded RNA signaling, and cell Migration and proliferation [21]. Studies have shown that lfit1 or lfit3 overexpression may mediate EMT through EGFR activation, and EMT played an important role in BPD progression [22]. The protein encoded by P2Y receptor family member 10 (P2ry10) belongs to the G protein coupled receptor family, and the G protein coupled receptor was preferentially activated by adenosine and uridine nucleotides.
Masanori et al. found that the P2Y(10) receptor was a double lysophosphatidylation receptor expressed in the reproductive organs, brain, lung and skeletal muscle of mice [23]. The product encoded by Purinergic receptor P2Y14 (P2ry14) belonged to the G-protein coupled receptor family and contained multiple receptor subtypes with different pharmacological selectivity for various adenosine and uridine nucleotides. The regulation of the stem cell compartment was involved in the expansion of the known immune system function of the P2Y receptor and may also play a role in neuroimmune function. In a study of human cardiac progenitor cells (HCPC), P2y14r was used as an important regulator of HCPC proliferation, migration and survival responses, and its overexpression significantly increased HCPC proliferation by 1.44 fold and maintained cell morphology and molecular Characteristics of anti-aging effects mediated by HCPC [24], suggesting that the down-regulation of P2ry14 may inhibit lung development and lead to BPD. Angiotensinogen (Agt) encoded angiotensinogen or angiotensinogen precursors, Shen et al. found that hyperoxia treatment induced up-regulation of AGT expression in A549 cells. AGT overexpression leaded to inflammatory response through JAK/ STAT signaling pathway, which ultimately inhibited proliferation of A549 cells and induced BPD [25].
Abdelwahab et al. found that AGT and ANGII were involved in bleomycin-induced Bleo-induced lung injury in neonatal lungs and suggested that angiotensin system may be a potential target for the treatment of neonatal lung injury [26]. Prokineticins was a secreted protein that promotes angiogenesis and induces contraction of the gastrointestinal smooth muscle. Prokr2 encoded a membrane protein and a G protein-coupled prokineticins receptor. The study found that Prokr2 mutations were associated with hypopituitarism during embryonic pituitary development, which in turn affected neonatal development [27]. Chauvet et al. found that prokineticin receptor 2 (Prokr2) was an important G protein-coupled receptor that bound to angiogenic factors such as endocrine gland vascular endothelial growth factor (EG-VEGF) and mammalian Bv8 [28]. Decreased expression of Prokr2 may induce BPD by down-regulating VEGF. Hosoi et al. found in the study of primary cultured glial cells that Stfa3 was involved in infection and inflammation (Hosoi et al. 2005). And inflammation was the main cause of BPD. In the above discussion, this study found that BPDrelated mechanisms and hub genes, speculated that Prokr2 / VEGF pathway, IFIT1 or IFIT3 / EMT pathway and Agt / VEGF pathway may be important pathways for BPD, but the specific mechanism needs further study.
Conclusion
In summary, biological processes such as apoptosis, EMT, cell cycle, proliferation, VEGF pathway and Notch pathway may be involved in the occurrence of BPD, and lfit3, lfit1, P2ry10, P2ry14, Agt, Stfa2l1, Prokr2 And 8 genes of Stfa3 may be potential targets for the treatment of BPD. However, due to experimental conditions, the relationship between gene expression profiles and more individual agents remains to be further studied.
Acknowledgement
We would like to express our gratitude for the helpful comments received from our reviews.
Statement of Ethics
The authors have no ethical conflicts to disclose
Disclosure
Not applicable.
Statement
All authors declare that they have no conflict of interest.
Funding Sources
This study was supported by the Clinical Innovation Research Program of Guangzhou Regenerative Medicine and Health Guangdong Laboratory(2018GZR0201002). The National Natural Science Foundation of China (grant no:31872800 to SXFL), Guangzhou City Science and Technology Key Topics Project (201904020025); Natural Science Foundation of GuangDong Province (2017A030310380).
Author Contributions
Xie Yingjun and Sun Xiaofang carried out study design; Wang Ding performed the experiments and did data analysis. Xie Yingjun wrote the paper. All authors read and approved the final manuscript.
References
- NorthwayWH, RosanRC, Porter DY(1967) Pulmonary disease following respirator therapy of hyaline-membrane disease. Bronchopulmonary dysplasia. N Engl J Med 276(7): 357-368.
- TrembathA,LaughonMM (2012) Predictors of bronchopulmonary dysplasia. ClinPerinatol39(3): 585-601.
- Kobaly K, Schluchter M, Minich N, Friedman H, Taylor HG, et al. (2008) Outcomes of extremely low birth weight (<1 kg) and extremely lowgestational age (<28 weeks) infants with bronchopulmonary dysplasia: effects of practicechanges in 2000 to 2003. Pediatrics121(1): 73-81.
- Svedenkrans J, Stoecklin B, Jones JG, Doherty DA, Pillow JJ (2019) Physiology and Predictors of Impaired Gas Exchange in Infants withBronchopulmonary Dysplasia. Am J Respir Crit Care Med200(4): 471-480.
- Mosca F, Colnaghi M, Fumagalli M (2011) BPD: old and new problems. J Matern FetalNeonatal Med24 Suppl 1: 80-82.
- Clough E, Barrett T (2016) The Gene Expression Omnibus Database. Methods Mol Biol1418: 93-110.
- Tanaka T, Saito Y, Matsuda K, KamioK, Abe S, et al. (2017) Cyclic mechanical stretch-induced oxidative stress occurs via aNOX-dependent mechanism in type II alveolar epithelial cells. Respir PhysiolNeurobiol242: p. 108-116.
- Mobius MA, Freund D, Vadivel A, Koss S, McConaghy S, et al. (2019) Oxygen Disrupts Human Fetal Lung Mesenchymal Cells. Implications forBronchopulmonary Dysplasia. Am J Respir Cell Mol Biol60(5): 592-600.
- Ohbayashi M, Kubota S, Kawase A, Kohyama N, Kobayashi Y, et al. (2014) Involvement of epithelial-mesenchymal transition inmethotrexate-induced pulmonary fibrosis. J Toxicol Sci39(2): 319-330.
- Coalson JJ (2006) Pathology of bronchopulmonary dysplasia. Semin Perinatol30(4): 179-184.
- Xu Y, Sun Z, Wang Q, Wang T, Liu T, et al. (2019) Stox1 induced the proliferation and cell cycle arrest in pulmonary artery smoothmuscle cells via AKT signaling pathway. VasculPharmacol 120:106568.
- WuD, LiangM, Dang H, Fang F, Xu F, et al. (2018) Hydrogen protects against hyperoxia-induced apoptosis in type II alveolarepithelial cells via activation of PI3K/Akt/Foxo3a signaling pathway. BiochemBiophys ResCommun495(2): 1620-1627.
- ThebaudB (2007) Angiogenesis in lung development, injury and repair: implications for chroniclung disease of prematurity. Neonatology91(4): 291-297.
- Hayes D, et al. (2010) Pathogenesis of bronchopulmonary dysplasia. Respiration79(5): 425-436.
- Taichman DB, Loomes KM, Schachtner SK, Guttentag S, Vu C, et al. (2002) Notch1 and Jagged1 expression by the developing pulmonaryvasculature. Dev Dyn225(2): 166-175.
- La MotteMohs RN, Herer E, ZunigaPflucker JC (2005) Induction of T-cell development fromhuman cord blood hematopoietic stem cells by Delta-like 1 in vitro. Blood105(4): 1431-1439.
- Hsu YL, Shi SF, WuWL, Ho LJ, Lai JH (2013) Protective roles of interferon-induced protein with tetratricopeptide repeats 3(IFIT3) in dengue virus infection of human lung epithelial cells. PLoS One8(11): e79518.
- Xiao S, Li D, Zhu HQ, Song MG, Pan XR, et al. (2006) RIG-G as a key mediator of theantiproliferative activity of interferon-relatedpathways through enhancing p21 and p27 proteins.Proceedings of the National Academy ofSciences of the United States of America103(44): 16448-16453.
- Feng B, Zhang Q, Wang J, Dong H, Mu X, et al. (2018) IFIT1 Expression Patterns Induced by H9N2 Virus and Inactivated Viral Particlein Human Umbilical Vein Endothelial Cells and Bronchus EpithelialCells. Mol Cells41(4):271-281.
- Fensterl V, Sen GC (2011) The ISG56/IFIT1 gene family. J Interferon Cytokine Res31(1):71-78.
- D'Andrea LD, Regan L (2003) TPR proteins: the versatile helix. Trends Biochem Sci28(12): 655-662.
- Krisanaprakornkit S,Iamaroon A (2012) Epithelial-mesenchymal transition in oral squamouscell carcinoma. ISRN Oncol2012: 681469.
- Murakami M, Shiraishi A, Tabata K, Fujita N (2008) Identification of the orphan GPCR, P2Y(10) receptor as thesphingosine-1-phosphate and lysophosphatidic acid receptor. Biochemical and BiophysicalResearch Communications371(4): 707-712.
- Khalafalla FG, Kayani W, Kassab A, Ilves K, Monsanto MM, et al. (2017) Empowering human cardiac progenitor cells by P2Y14 nucleotidereceptor overexpression. J Physiol595(23): 7135-7148.
- Shen LL,Zhang TC, Lu HY (2017) Overexpression of AGT promotes bronchopulmonarydysplasis via the JAK/STAT signal pathway. Oncotarget8(56): 96079-96088.
- Abdelwahab A, Gopallawa I, Piasecki CC, Gewolb IH, Uhal BD (2016) Bleomycin-Induced Neonatal Lung Injury Requires the AutocrinePulmonary Angiotensin System. Jacobs J Pulmonol 2(3): 27.
- Parsons SJH, Wright NB, Burkitt-Wright E, Skae MS, Murray PG, et al. (2017) A heterozygous microdeletion of 20p12.2-3 encompassing PROKR2 andBMP2 in a patient with congenital hypopituitarism and growth hormone deficiency. Am J MedGenet A173(8): 2261-2267.
- Chauvet S, Traboulsi W, Thevenon L, Kouadri A, Feige JJ, et al. (2015) EG-VEGF, BV8, and their receptor expression in human bronchi and theirmodification in cystic fibrosis: Impact of CFTR mutation (delF508). American Journal ofPhysiology-Lung Cellular and Molecular Physiology309(3): L314-322.
