 Research Article
Abstract
Grifola frondosa is a kind of precious edible and medicinal fungus. In this study, we used a solid-state fermentation method to grow Grifola frondosa mycelium. Grifola frondosamycelium polysaccharide (GFP) was obtained by solid state fermentation; it was taken orally by alloxan induced diabetes mice in order to evaluate its hypoglycaemic activity. After 28 days of GFP gavage in mice, the results showed GFP significantly reduced blood glucose and increased glucose tolerance in diabetic mice. And the low dose treatment has the best hypoglycemic effect. Further purification of GFP by DEAE Sephadex A-50 and Sephadex G-200 chromatography revealed that the main component was GFP-1. FT-IR spectroscopy and 1H NMR spectroscopy was used to investigate the structure of the GFP-1, and results revealed that it contained α-configuration and β-configuration. Our work suggested GFP might be used as a functional hypolipidaemic ingredient.
Keywords: Grifola frondosa; Solid State Fermentation; Polysaccharide; Hypoglycemic Activity; Chemical Properties
Abbreviations:GFP: Grifola Frondosamycelium Polysaccharide; DM: Diabetes Mellitus; PDA: Potato Dextrose Agar; NCG: Normal Control Group; AUC: Area Under the Curve
Introduction
Diabetes Mellitus (DM) is a chronic endocrine and metabolic
disease caused by genetic factors, immune disorders, microbial
infections and their toxins, free radical toxins, mental factors, and
other pathogenic factors that act on the body. A series of metabolic
disorders such as sugar, protein, fat, water, and electrolytes, are
caused by loss of insulin function and insulin resistance. Once the
diabetes is out of control, it can cause many complications which
would result in failure of the kidneys, eyes, feet and other parts,
these diseases can hardly be cured. In addition, diabetes is an
independent cause of coronary heart diseases, and complications of
macro vascular disease are the main cause of death in patients with
diabetes [1]. Currently, the main treatment of diabetes is taking oral
hypoglycemic drugs. However, most of them have inescapable side
effects on the human body, such as liver damage, gastrointestinal
reactions and lactic acidosis.
In the past few decades, fungal polysaccharides have been
found to play a role in regulating blood glucose [2]. Therefore, it
can be used as an adjunct in the treatment of patients with diabetes,
which has stimulated scientists to pay special attention for it [3].
Polysaccharides are usually the main bioactive components of edible
fungi and are natural macromolecular polymers. In the last decade,
studies have shown that fungal polysaccharides generally have
immune regulatory, antioxidant, anti-tumor, anti-inflammatory
and anti-fatigue effects. At present, many natural polysaccharides
have been studied and proved to be safe and effective therapeutic
drugs [4]. Grifola frondosa is a popular edible fungus in Asia due to
its flavour, taste, and it has been proved to have positive biological
effects in vivo for a long time [5]. Moreover, several studies have
indicated that G. frondosa polysaccharides own many significantly
biological activities, such as hypoglycemic effects [6,7], anti-tumor
[8,9], hypolipidemic effects [10], anti-oxidation [11,12], anti-virus [13], anti-inflammatory [14], immunomodulatory [4], etc. The
production time of G. frondosa fruit body directly affect its market
price.
Furthermore, the long solid cultivation period, large area, and unstable production are not conducive to the development of G. frondosa. Therefore, the first report of liquid fermentation of G. frondosa emerged in 1986 [15]. Later, Suzuki I successfully cultivated G. frondosa mycelia in a similar method [16]. A large number of studies have focused on the production of bioactive compounds with submerged culture [17,18]. However, few previous studies have reported on bioactive polysaccharides produced by G. frondosa mycelia grown in solid state fermentation. In this study, liquid strains were used as solid-state fermentation strains, and herbaceous plants (Miscanthus floridulus) were used as the medium for solid-state fermentation of G. frondosa, and its hypoglycemic activity was investigated. A water-soluble crude polysaccharide was extracted from G. Frondosa mycelia and further purified, and the structure of the main component GFP1 of G. frondosa polysaccharide was characterized.
Materials and Methods
Preparation of G. Frondosa Mycelium Polysaccharide
G. frondosa strain was obtained from the Centre of Fungal Research (Fujian Agriculture and Forestry University, Fuzhou, China). G. frondosa strain was inoculated on potato dextrose agar (PDA) culture medium, and placed in 25 ℃ constant temperature incubator for 7 d. The seed cultures medium contained following components (in g/L): dextrose 30%, MgSO4 0.05%, KH2PO4 0.3%, peptone 0.5%, Vitamin B1 1mg, and the loading volume was 100 mL in 250 mL conical flask. Then, the seed culture medium was subjected to sterilization for 30 min at 121℃. After cooled, the mycelium in the PDA was inoculated to seed cultures medium for 3 d to obtain liquid strain. The liquid strain was inoculated to solidstate fermentation medium, which composed of 70% Miscanthus floridulus, corn flour 13%, wheat bran 15% and gypsum powder 2%, water content 60%. Solid-state fermentation was carried out in dark environment at 25 ℃ for 30 d. The G. frondosa solid fermentation mycelium was dried in an oven at 70°C, and crushed in a mini-grinding machine. G. frondosa polysaccharide was extracted by a microwave oven at 450 W for 4 min, and maintained extraction for 4.5 h, solid-liquid ratio 1:45. Polysaccharide solution is filtrated by vacuum filtration. Three volumes of ethanol were slowly added to the polysaccharide solution and kept at 4 ℃ for 10 h. Precipitate was collected by centrifugation (2650×g, 10 min), then it was lyophilized (Tokyo Rikakaico. Ltd., Tokyo, Japan). Finally, crude G. frondosa mycelium polysaccharide (GFP) was obtained (polysaccharide content >70%).
Hypoglycemic Activity of GFP in Vivo
Sixty male ICR mice were adaptively fed in the experimental environment for 3 days. All mice were given a normal diet and water. After 24 hours of fasting in all mice, ten of them were randomly selected as normal control group (NCG) and injected with 0.9% saline, and another 50 were intraperitoneally injected with freshly prepared alloxan (2%) at a dose of 200 mg / kg. After 72 h, they were fasted for 5 h, and their blood was taken from the tail for determining blood glucose levels. The mice whose blood glucose levels higher than 11 mmol/L would be used as diabetes mice models. These model mice were randomly divided into 5 groups of 10 each. The information of group was listed in (Table 1). These mice were taken metformin or GFP by gavage daily for 28 consecutive days. The body weight of the mice was measured every 4 days, and all the mice were fasted for 5 h before weighing and blood collection. On the 9th, 18th and 27th day, blood was drawn from the tail vein of the mice. Blood glucose level was measured with a blood glucose meter (Yicheng Bioelectronics Technology Co., Ltd., Beijing, China). Blood glucose level and the decreasing ratio of blood glucose were compared among the groups. The decreasing ratio of blood glucose (DR) was calculated according to the following formula:
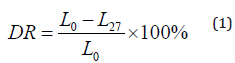
• DR—decreasing ratio of blood glucose;
• L0—blood glucose level of 0 day;
• L27—blood glucose level of 27 d.
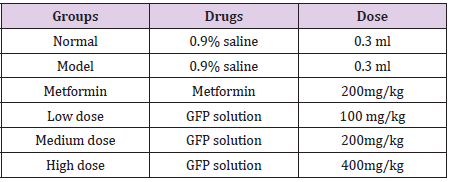
Table 1: The grouping of experimental animals.
On the 28th day, all groups were fasted for 4 h, then gavaged
with a 250 mg/mL glucose solution at a dose of 2 g/kg. The blood
glucose levels were determined after 0 min, 30 min and 120 min
respectively, and the area under the curve (AUC) was calculated
according to the following formula:
Area under the curve (AUC) = 0.25×(blood glucose level of 0h +
4×blood glucose level of 0.5h + 3×blood glucose level of 2h). All mice
were handled and euthanized according to ethical guidelines of
College of Food Science, Fujian Agriculture and Forestry University.
Separation and Purification of GFP
The GFP solution was deproteinized according to the Sevag method, and the ratio of GFP solution to the Sevag reagent (chloroform: butanol= 4:1, v/v) was 4:1. The mixture of the Sevag reagent and GFP solution was vigorously shaken for 30 min in a shaker. After that, it was placed in a separator funnel to remove the denatured protein (middle layer) and the chloroform (bottom). This operation should be repeated for several times until the denatured protein no longer appears in the middle layer. The deproteinized polysaccharide solution and the pre-treated macro porous adsorption resin AB-8 (Huafu Chemical Industry Co., Ltd., Lang fang, China) were mixed and shaken in a shaker at 120r/ min for 5 h so that the adsorption resin could fully adsorb the pigment. This operation was repeated for several times until the colour of solution was hardly seen. The solution is dialyzed with 14kD dialysis bags (Beijing Solar bio Science & Technology Co., Ltd., Beijing, China) to remove low molecular weight impurities and residual pigments. The solution was purified with a DEAE Sephadex A-50 chromatography (Beijing Solar bio Science & Technology Co., Ltd., Beijing, China) column. Thus, pure polysaccharide solution was collected and concentrated.
Purity Identification of Polysaccharide
The preliminary purification polysaccharide solution was scanned in full wavelength to observe whether there is protein absorption zone and pigment absorption zone. The solution was further purified and separated with a Sephadex G-200 (Beijing Solarbio Science & Technology Co., Ltd., Beijing, China) column to determine the purity of the polysaccharide after purification by DEAE Sephadex A-50 [19]. The main purified single-component polysaccharides GFP-1 was concentrated and freeze-dried.
Fourier Transform Infrared (FT-IR) Analysis of GFP-1
A certain amount of GFP-1 was mixed with dried KBr powder, and then they were pressed into tablets after ground. The tablet was scanned in the range of 4000 cm-1-400 cm-1 by Fourier transform infrared spectrometer (Thermo Nicolet Co., Ltd., America).
1H NMR Analysis of GFP
GFP-1 was dissolved in 0.5 ml of deuterated methanol (Cambridge Isotope Laboratories Co., Ltd., America) and lyophilized for 3 times. The 1H NMR spectra were recorded on a 400 MHz Bruker Biospin spectrometer (Avance III Bruker Biospin, Rheinstetten, Germany) at 30°C [20].
Statistical Analysis
Data was expressed as the mean ± S.E. and analyzed by one way ANOVA followed by Tukey’s test by using SPSS 13.0 software (International Business Machines Corporation, Chicago, USA). P<0.05 was considered statistically significant.
Results and Discussion
Hypoglycemic Activity of GFP in Vivo
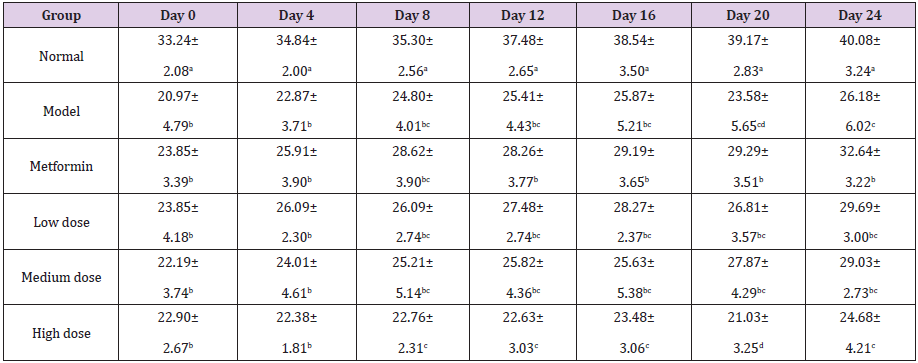
Table 2: Effect of GFP on the weights of diabetic rats (g).
Note: The data are expressed as the mean ± SD. The results of LSD analysis of a single-factor complete randomized trial, a, b, c, d, e different letters in the same column indicate significant differences (P<0.05, n=10).
After making model by alloxan, the mice showed typical symptoms of diabetes, such as polydipsia, polyphagia, polyuria, and weight loss in different extent [21]. After 27 days of feeding, the weight increased nearly 7g in normal control mice, which indicated the experimental environment and the other conditions are suitable for mice growth. The results shown in (Table 2) indicate that in the 0th day, the body weight of the normal control group was significantly higher than that of the other five hyperglycemia groups, which is consistent with the symptoms of diabetes. The weight of the high-dose group was significantly lower than that of the metformin group (P<0.05), indicating that the high-dose treatment was inferior to the low-dose and medium-dose. (Table 3) shows that there was no significant difference among the model group, metformin group and three GFP group on the 0th day. After 9 days of continuous treatment with different doses of GFP, the blood glucose levels of the three different doses of GFP treated group decreased by 1.77 mmol/L, 1.35 mmol/L and 1.43 mmol/L, respectively, as compared with 0th day. However, there was no significant difference among the three groups.
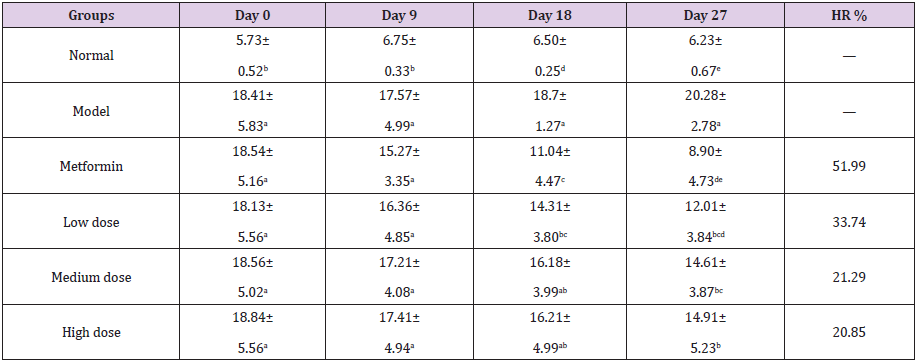
Table 3: Effect of GFP on blood glucose of diabetic rats (mmol/L).
Note: The data are expressed as the mean ± SD. The results of LSD analysis of a single-factor complete randomized trial, a, b, c, d, e different letters in the same column indicate significant differences (P<0.05, n=10).
The normal group showed a slight increase in blood glucose, but it was in the normal range. After 18 days of treatment, the blood glucose level of the low-dose group was significantly different from that of the model control group (P<0.05). As compared with the 0th day, the blood glucose level of the low-dose group decreased by 3.82 mmol/L, and the rate reached 21.07%. There was no significant difference between the medium dose group and the high dose group. After 27 days, the blood glucose levels of all treated groups were further decreased, and there was a significant difference between the treated groups and the model group (P<0.05). However, no significant difference was found among three GFP groups. The blood glucose level of low-dose group decreased by 6.12mmol/L, and its hypoglycemic rate reached 33.74%. The blood glucose level of the GFP low-dose group was close to the diagnostic criteria. These results show that the low dose of GFP has significant hypoglycemic effect. On the 28th day, the effect of GFP on glucose tolerance and AUC in diabetic mice was studied. The effect of GFP on the glucose tolerance and AUC of diabetic rats is showed in (Table 4). From 0h to 2h, the blood glucose levels were much lower in GFP group than that of model group, and the lowest blood glucose level was observed in low-dose GFP group.
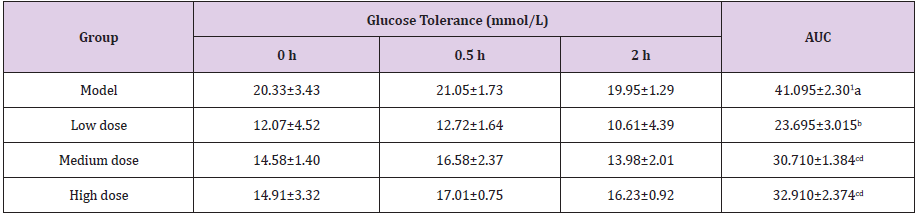
Table 4: Effect of GFP on the glucose tolerance of diabetic rats (mmol/L).
Note: The results of ANOVA analysis, a, b, c, d different letters in the same column indicate significant differences (P<0.05, n=10).
The AUC of the low dose group is the minimum in all treatment groups, which was significantly lower than that of the other groups (P<0.05).Interestingly, the AUC of GFP medium dose group and GFP high dose group was significantly lower than model group (P<0.05). This is consistent with the conclusions of the blood glucose test results that the hypoglycemic effect of the low dose treatment is the best.
Purification of Crude GFP
(Figure 1) shows the purification curve of GFP by DEAE Sephadex A-50. After orderly eluted by distilled water and NaCl solutions (0.1 mol/L, 0.3 mol/L), three kinds of polysaccharide component was obtained, named GFP1, GFP2, and GFP3, respectively. The GFP1 were located in the 4th to 20th tubes, GFP2 were located in 30th to 59th tubes, and GFP3 were located in the 63th to 91th tubes. A higher concentration of NaCl solution (0.5 mol/L) was sequentially employed to elute until 100th tube, but there was no more polysaccharide components. The Fig. 1 shows that the main component of GFP is GFP-1. Afterwards, the content of protein in GFP1was determined by Uv-vis scanning at wavelength of 200- 700 nm (Figure 2), and then the purity of GFP1was identified by Sephadex G-200. The Uv-vis scanning curve of GFP1is showed in Figure 2. There was no absorbance peak at 250-300 nm, indicating that GFP1contained no nucleic acid or protein components. The absorbance value of GFP1 was closed to zero in wavelengths of 300- 700 nm, which suggested that few pigment wasin GFP1. Therefore, it could be initially determined that GFP1 was pure. (Figure 3) shows the purification curve of GFP1by Sephadex G-200. As for GFP1, only one absorption peak in tubes 2-15 was observed, indicating that GFP1 was a single-component polysaccharide. Therefore, the structure of GFP1 was further analyzed using FT-IR spectroscopy and 1H NMR spectroscopy.

Figure 1: Purification curve of GFP by DEAE Sephadex A-50.
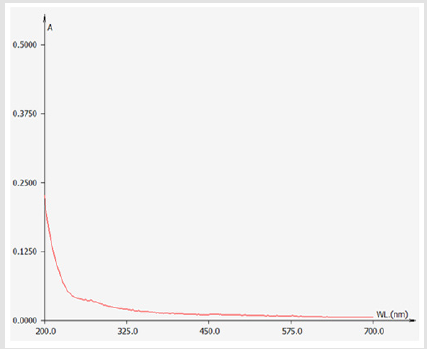
Figure 2: Uv-vis scanning curve of GFP1.
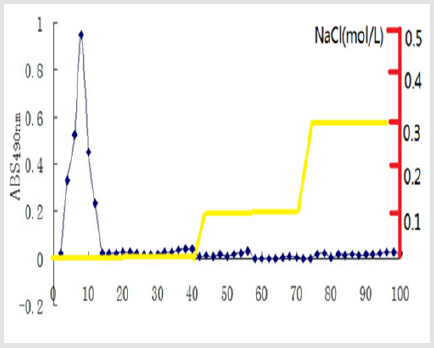
Figure 3: Purification curve of GFP1 by Sephadex G-200.
FT-IR Spectroscopy Analysis
The FT-IR spectrum of GFP1 is showed in (Figure 4A). The
absorption peaks in the range of 800-975 cm-1 indicated the
existence of α- and β-configurations. Peaks at 1200-1000 cm-1
indicated the stretching vibration of C-O-H in carboxyl and ether
bond C-O-C in pyran ring. The absorption between 1800 and 1600
cm−1 can be attributed to vibration of C=O and C=C, while absorption
between 3010 and 2850 cm-1 were designated as the stretching
vibration of -CH2 and -CH3 [22]. The stretching vibration of O-H and
N-H was generally in the range of 3700-3100 cm-1, showing a broad
absorption peak, which indicated the existence of intermolecular
and intermolecular hydrogen bonds [23]. The absorption peak
of the free hydroxyl is generally in the range of 3650-3580 cm-
1, of which shape is sharp and there is no interference of other
absorption peak. However, since the hydroxyl group is a strongly
polar group and the association phenomenon is remarkable.
The absorption peak of the O-H moves to the low wave-number,
and a broad and strong absorption peak appeared in the range
of 3500-3200 cm-1. Therefore, the absorption peak at 3409 cm-1
indicated the existence of O-H, and the absorption peak at 2935
cm-1 indicated the existence of C-H [24]. There was no absorption
at 1700-1775 cm-1, indicating that there was no carboxyl in it.
As a result, GFP1 did not contain glucuronic acid and it was a
kind of neutral sugar. The absorption peak at 1636 cm-1 was the
stretching vibration of C=O, and the range of 1026-1204 cm-1 was
the stretching vibration of C-O-C and C-O. A weak absorption peak
near 927 cm-1 was the absorption peak caused by the symmetrical
stretching vibration of C-C and C-O in arabinose furan rings [25].
1H NMR Spectroscopy Analysis of GFP1
The 1H NMR spectrum was mainly used to solve configuration of glycosidic bond, and the signal of polysaccharides was mainly in the narrow range of δ3.0-5.5 ppm. The 1H NMR spectrum of GFP1 is showed in (Figure 4B). The δ value of anomeric hydrogen in α-configuration glycoside is greater than 5.0 ppm, thus δ5.168 ppm was the chemical shift of H-1, indicating that GFP1 had the glycosidic bond of α-configuration. The δ4.919 ppm was the signal of β-configuration glycosidic bond, and δ3.5-4.0 ppm was the signal of the sugar ring proton [26,27], while the δ2.6-3.2 ppm was the signal of carbohydrates, indicating that the sample contains carbohydrates.
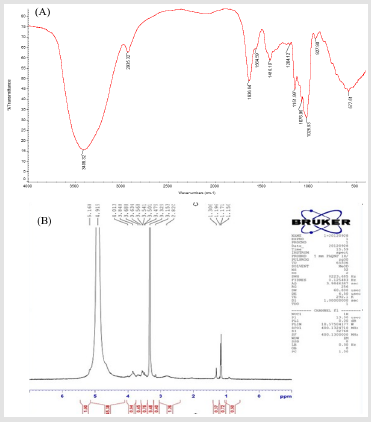
Figure 4: FT-IR spectrum
(A) and 1H NMR spectrum (B) of GFP1.
Conclusion
In our study, the GFP from the mycelia of G. frondosa cultured by solid state fermentation has hypoglycemic property. The results showed that the low-dose of GFP showed significant hypoglycemic activity. Moreover, pure GFP1 was separated by column chromatography and structurally analyzed by FT-IR and 1H NMR, suggesting that GFP1 had the glycosidic bond of α-configuration and β-configuration. However, it is necessary to study the key mechanisms of GFP1, GFP2 and GFP3 hypoglycemic activity, respectively. In addition, their molecular structure and monosaccharide composition need to be researched in the future.
Acknowledgement
This study received no official funds.
Conflict of Interest
All authors have no competing interest to declare.
References
- Foster NC, Beck RW, Miller KM, Clements MA, Rickels MR, et al. (2019) State of Type 1 Diabetes Management and Outcomes from the T1D Exchange in 2016-2018. Diabetes Technol Ther 21: 66-72.
- Budinsky A, Wolfram R, Oguogho A, Efthimiou Y, Stamatopoulos Y, et al. (2001) Regular ingestion of opuntia robusta lowers oxidation injury. Prostaglandins leukotrienes and essential fatty acids 65: 45-50.
- Bailey CJ, Day C (1989) Traditional plant medicines as treatments for diabetes. Diabetes care 12: 553-564.
- Li Q, Zhang F, Chen G, Chen Y, Zhang W, et al. (2018) Purification characterization and immunomodulatory activity of a novel polysaccharide from Grifola frondosa. Int J Biol Macromol 111: 1293-1303.
- Sato M, Miyagi A, Yoneyama S, Gisusi S, Tokuji Y, et al. (2017) CE-MS-based metabolomics reveals the metabolic profile of maitake mushroom (Grifola frondosa) strains with different cultivation characteristics. Biosci Biotechnol Biochem 81:2314-2322.
- Preuss HG, Echard B, Bagchi D, Perricone NV, Zhuang C (2007) Enhanced insulin-hypoglycemic activity in rats consuming a specific glycoprotein extracted from maitake mushroom. Mol Cell Biochem 306: 105-113.
- Kou L, Du M, Liu P, Zhang B, Zhang Y (2019) Anti-Diabetic and Anti-Nephritic Activities of Grifola frondosa Mycelium Polysaccharides in Diet Streptozotocin Induced Diabetic Rats Via Modulation on Oxidative Stress. Appl Biochem Biotechnol 187: 310-322.
- Chen Y, Liu Y, Sarker MMR, Yan X, Yang C, et al. (2018) Structural characterization and antidiabetic potential of a novel heteropolysaccharide from Grifola frondosa via IRS1/PI3K-JNK signaling pathways. Carbohydr Polym 198: 452-461.
- Mao GH, Ren Y, Feng WW, Li Q, Wu HY, et al. (2015) Antitumor and immunomodulatory activity of a water-soluble polysaccharide from Grifola frondosa. Carbohydr Polym 134: 406-412.
- Kubo K, Nanba H (1997) Anti-hyperliposis effect of maitake fruit body (Grifola frondosa) I. Biol Pharm Bull 20: 781-785.
- Tinga Z, Yina F, Mao G, Feng W, Zou Y, et al. (2017) Purification Characterization and Antioxidant Activities of Enzymolysis Polysaccharide from Grifola frondosa. Iranian Journal of Pharmaceutical Research 16: 347-356.
- Shin YJ, Lee SC (2014) Antioxidant activity and beta-glucan contents of hydrothermal extracts from maitake (Grifola frondosa). Food Science and Biotechnology 23: 277-282.
- Zhao C, Gao L, Wang C, Liu B, Jin Y, et al. (2016) Structural characterization and antiviral activity of a novel heteropolysaccharide isolated from Grifola frondosa against enter virus 71. Carbohydr Polym 144: 382-389.
- Kodama N, Murata Y, Nanba H (2004) Administration of a polysaccharide from Grifola frondosa stimulates immune function of normal mice. J Med Food 7: 141-145.
- Ohno N, Adachi Y, Suzuki I, Sato K, Oikawa S, et al. (1986) Characterization of the antitumor glucan obtained from liquid-cultured Grifola frondosa. Chem Pharm Bull (Tokyo) 34: 1709-1715.
- Suzuki I, Hashimoto K, Oikawa S, Sato K, Osawa M, et al. (1989) Antitumor and immunomodulating activities of a beta-glucan obtained from liquid-cultured Grifola frondosa. Chem Pharm Bull (Tokyo) 37: 410-413.
- Ohno N, Adachi Y, Suzuki I, Oikawa S, Sato K, et al. (1986) Antitumor activity of a beta-1,3-glucan obtained from liquid cultured mycelium of Grifola frondosa. Journal of pharmacobio-dynamics 9: 861-864.
- Chen P, Liu HP, Ji HH, Sun NX, Feng YY (2019) A cold-water soluble polysaccharide isolated from Grifola frondosa induces the apoptosis of HepG2 cells through mitochondrial passway. Int J Biol Macromol 125: 1232-1241.
- Liu C, Lin Q, Gao Y, Ye L, Xing Y, et al. (2007) Characterization and antitumor activity of a polysaccharide from Strongy locentrotus nudus eggs. Carbohydr Polym 67: 313-318.
- Zeng F, Zhao C, Pang J, Lin Z, Huang Y, et al. (2013) Chemical Properties of a Polysaccharide Purified From Solid-State Fermentation of Auricularia Auricular and its Biological Activity as a Hypolipidemic Agent. J Food Sci 78: H1470-H1475.
- Chakrabarti R, Rajagopalan R (2002) Diabetes and insulin resistance associated disorders: Disease and the therapy. Curr Sci 83: 1533-1538.
- Chiu WM, Yang CF, Zhang YS (2007) Synthesis of silicon dioxide optical films mixed with acrylic series monomers by sol-gel process. Polymer-Plastics Technology and Engineering 46: 767-773.
- Ye M, Qiu T, Peng W, Chen Wx, Ye Yw, et al. (2011) Purification, characterization and hypoglycemic activity of extracellular polysaccharides from Lachnum calyculiforme. Carbohydr Polym 86: 285-290.
- Nikonenko NA, Buslov DK, Sushko NI, Zhbankov RG (2000) Investigation of stretching vibrations of glycosidic linkages in disaccharides and polysaccharides with use of IR spectra deconvolution. Biopolymers 57: 257-262.
- Chen Y, Xie MY, Nie SP, Li C, Wang YX (2008) Purification, composition analysis and antioxidant activity of a polysaccharide from the fruiting bodies of Ganoderma atrum. Food Chem 107: 231-241.
- Chauveau C, Talaga P, Wieruszeski JM, Strecker G, Chavant L (1996) A water-soluble beta-D-glucan from Boletus erythropus. Phytochemistry 43: 413-415.
- Wu YL, Sun CR, Pan YJ (2006) Studies on isolation and structural features of a polysaccharide from the mycelium of a Chinese edible fungus (Cordyceps sinensis). Carbohydr Polym 63: 251-256.
