 Research Article
Abstract
Background: Third-generation computed tomography (CT) has advances in detector efficiency, and newer iterative reconstruction (IR) algorithms Objective: To retrospectively compare pediatric brain imaging quality between second- and third-generation CT.
Methods: Image quality was compared between second- and third-generation CT in 51 pairs of age-matched children (age range, 0–5 years) with no abnormal findings. CT images were reconstructed using filtered back-projection (FBP) and IR. The contrastto- noise ratio (CNR) and signal-to-noise ratio (SNR) were calculated at the lentiform nucleus (LN) and white matter (WM). Imaging contrast at the gray–WM interface was rated by two readers.
Results: The CNR and SNR of the LN and WM were significantly higher on thirdgeneration CT than on second-generation CT (mean CNR, 2.51 vs 2.12, p < 0.001; mean SNR for LN, 15.13 vs 12.71, p < 0.001; mean SNR for WM, 12.27 vs 11.12, p = 0.012) when FBP was used. With FBP, both readers rated visually assessed grey–white matter contrast as better on third-generation CT than on second-generation CT (p ≤ 0.002). With IR, the CNR and SNR were significantly higher than with FBP on both generation CT scanners (p < 0.001). The LN CNR was significantly higher on third-generation CT than on second-generation CT (mean, 16.79 vs 15.13, p < 0.001). With IR, visual assessments on third-generation CT were generally better than on second-generation CT.
Conclusion: Imaging quality of the pediatric brain was better on third-generation CT than on second-generation CT. IR may be effective on CT scanners of both generations.
Keywords: Computed Tomography; Children; Head; Brain; Iterative Reconstruction; Contrast
Abbreviations: CT: Computed Tomography; IR: Iterative Reconstruction; AV: Attenuation Value; FBP: Filtered Back-Projection; DLP: Dose-Length Product; ROIs: Regions-of-Interests; LN: Lentiform Nucleus; SD: Standard Deviation; CNR: Contrastto- Noise Ratio; SNR: Signal-to-Noise Ratio; ICCs: Intraclass Correlation Coefficients
Introduction
Computed tomography (CT) has been widely used as an initial imaging modality for assessment of intracranial lesions or ruling out their presence. It is also widely used for children, because CT can be completed quickly and is widely available [1-9]. The imagequality of CT is important for the initial detection of parenchymal lesions, including hypoxic-ischemic brain injury, infarction, abusive head trauma, and encephalitis/encephalopathy. All of these lesions may show a subtle decreased delineation of the gray–white matter interface [2,10-20], and may be missed on CT with low image quality. Technical progress including improved detectors, filters, and iterative reconstruction (IR) has led to improvements in CT image quality [21-26], while the pediatric-specific adjustment of protocols is also important for imaging quality [27]. Recently introduced third-generation CT includes advances in detector efficiency, improved temporal and spatial resolution, and newer raw data-based IR algorithms [28,29]. In particular, third-generation CT includes new detectors with integrated electronics with contacting technology to reduce the distance between the photodiode and the analog-to-digital converter electronics; this can reduce noise and artifact [30,31]. The image quality of third-generation CT has been reported to show improvements in angiography [28], coronary stent visualization [32], and truncal cancer imaging [33]. However, improvement in the image quality of pediatric unenhanced head CT has been little evaluated. This study therefore aimed to assess the quality of pediatric brain imaging on third-generation CT, comparing it with second-generation CT.
Materials and Methods
Subjects
This retrospective study was approved by our institutional
review board, and the requirement for informed consent was
waived. In our institution, the radiology department was equipped
with third-generation CT and the emergency department was
equipped with second-generation CT. Children were scanned when
intracranial lesions were suspected or needed to be ruled out after
an insult such as head trauma, seizure, or disturbed consciousness,
and more children were scanned in the emergency department
than in the radiology department. First, a radiologist with 14 years
of experience in pediatric neuroradiology reviewed the CT images
acquired from April 2016 to May 2018. Children who showed no
abnormal intracranial findings and aged ≤ 5 years were included.
Infants aged ≤ 2 months were excluded because the Attenuation
Value (AV) of white matter changes in the developing brain [34]. CT
examinations with severe motion artifact were also excluded. On
the third-generation CT, 67 CT examinations performed during the
period were identified as having no abnormal findings, although
seven examinations were excluded because of the results of followup
examinations.
Children were also excluded because of severe motion artifact
(n = 6), and reduced radiation doze due to the assessment for
the skull (n = 3). Finally, 51 children (mean age, 2.3 ± 1.8 years;
range, 3 months–5 years) with third-generation CT examinations
were included in the analysis. During the same period, 201 CT
examinations performed on second-generation CT were identified
as having no abnormal findings. Seven examinations were excluded
because of the results of follow-up examinations, and further
children were excluded because of severe motion artifact (n = 1), or
thin-slice reconstruction (n = 28), leaving 165 children as potential
study candidates for the second-generation CT. From these 165
children, 51 were randomly selected (mean age, 2.3 ± 1.9 years;
range, 3 months–5 years), while ensuring age-matching with the
children in the third-generation CT group.
CT Examination
In the emergency department, CT was performed on a secondgeneration CT (SOMATOM Definition AS+, Siemens Healthcare, Forchheim, Germany). Infants were fixed with an immobilizer and CT scans were generally performed without sedative agents, although triclofos sodium syrup was used for sedation when necessary. The scan parameters included: field-of-view, 220 mm; collimation, 128 × 0.6 mm; pitch, 0.6; tube voltage, 120 kVp; and rotation speed, 0.5 s. Real-time automatic mAs-modulation software (CARE Dose 4D, Siemens Healthcare) was used to reduce radiation exposure. CT images were reconstructed using filtered back-projection (FBP) and IR (sinogram-affirmed IR [SAFIRE]) with a strength level of 2. In the radiology department, CT was performed on a third-generation CT scanner (SOMATOM Definition Force, Siemens Healthcare, Forchheim, Germany) with the following parameters: field-of-view, 220 mm; tube voltage, 120 kVp; rotation speed, 0.5 s; collimation, 192 × 0.6 mm; pitch, 0.8; and tube current set according to the child’s age: 245 mAs for 0-1 years-of-age, 285 mAs for 2-4 years, and 320 mAs for 5-6 years. CT images were reconstructed using FBP and IR (advanced modeled IR [ADMIRE]) with a strength level of 2. Pitch was altered according to the child’s condition: if a child seemed to be restless in the scanner, the pitch was slightly raised. All CT images were reconstructed parallel to the orbitomeatal line with a slice thickness of 5 mm in 5-mm increments. The tube current and CDTIvol based on a 16-cm phantom were noted. As the Dose-Length Product (DLP) varied because of variation in the scanned area, which included the face, jaw and cervical spine in some children, it was not assessed in this study.
CT Quantitative Image Analysis
Regions-of-interests (ROIs) were placed in the lentiform nucleus (LN) and nearby frontal white matter (WM). ROIs were placed by a radiologist with 14 years of experience in pediatric neuroradiology, and the mean AV and standard deviation (SD) were measured for each ROI (Figure 1). Contrast-to-noise ratio (CNR) and signal-to-noise ratio (SNR) were calculated using the following formulae:
CNR = (AVLN – AVWM) / [(SDLN2 + SDWM2)]1/2 SNR = AV / SD
where AVLN and AVWM are the mean AVs in ROIs in LN and
WM respectively, and SDLN and SDWM are the SDs in ROIs in LN and
WM respectively:
ROIs were placed on both hemispheres, and the final CNR and
SNR were determined by averaging the values from both sides.
Qualitative Image Analysis
Two radiologists with 9 and 6 years of experience in neuroradiology independently reviewed the CT images, blinded to information on the scanner used or the reconstruction method. Three slices were selected for image evaluation: the level of the semiovale center, the basal ganglia, and the fourth ventricle. Image quality was assessed with respect to gray–white matter contrast using the following grades: 0 = no recognition; 1 = slight recognition; 2 = moderate recognition; and 3 = good recognition.
Statistical Analysis
All statistical data were analyzed using MedCalc version 18.5 (MedCalc Software bvba, Ostend, Belgium). A Kolmogorov-Smirnov test showed that the data were not normally distributed. The scan parameters were compared between second- and third-generation CT using Mann-Whitney test. Values for CNR, SNR, and the assessed scores were compared between second- and third-generation CT using Mann-Whitney tests. The effects of IR on the images from each scanner were assessed by comparing the CNR, SNR, and the visually assessed scores between FBP and IR using Wilcoxon tests. A p-value < 0.05 was considered statistically significant. Interobserver agreements were assessed by intraclass correlation coefficients (ICCs). ICCs were interpreted using the following criteria reported by Landis and Koch [35]: 0.01-0.20, slight agreement; 0.21-0.40, fair agreement; 0.41-0.60, moderate agreement; 0.61-0.80, substantial agreement; and 0.81-1.0, near-perfect agreement.
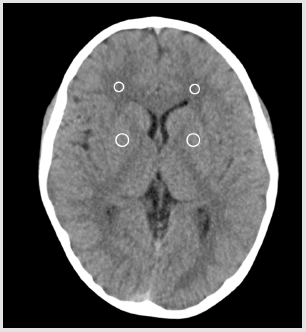
Figure 1: A schema showing region-of-interest placement at the bilateral lentiform nucleus and nearby white matter.
Results
Scan Parameters
Tube current on second- (256.4 ± 30) and third-generation CT (262.0 ± 28.1 mAs) did not significantly differ (p = 0.35). CTDIvol on second- (36.9 ± 4.4) and third-generation CT (37.4 ± 5.2 mGy) did not significantly differ (p = 0.99). The helical pitch on thirdgeneration CT (0.89 ± 0.17) was significantly higher than that on second-generation CT (0.61 ± 0.08) (p < 0.001).
Qualitative Analysis
Table 1 summarizes the CNRs and SNRs of the CT images reconstructed by FBP and IR on each scanner. The CNR and SNR for the LN and WM on FBP were significantly higher on third-generation CT than on second-generation CT (p ≤ 0.012). However, with IR, only the SNR of the LN was significantly higher on third-generation CT than on second-generation CT (p < 0.001); the CNR and the SNR of WM were not significantly different between second- and thirdgeneration CT (p > 0.05). Comparison of FBP and IR images showed that the CNR and SNR of the LN and WM were significantly higher on IR than on FBP on both generation CT scanners (all p < 0.001). On second-generation CT, when IR was used, the average CNR, SNR of the LN and WM were respectively 1.35 (95% confidence interval, 1.29-1.40), 1.19 (1.16-1.23), and 1.18 (1.13-1.23) fold greater than those on FBP. On third-generation CT, the respective IR values were on average 1.15 (1.12-1.17), 1.11 (1.08-1.15), and 1.12 (1.06-1.17), and fold greater than those on FBP.
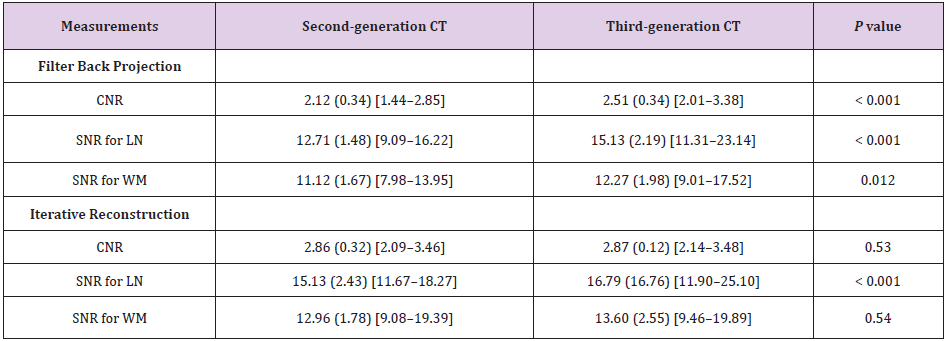
Table 1: Contrast-to-Noise Ratio (CNR) for the Lentiform Nucleus (LN) and the nearby White Matter (WM) and signal-to-Noise Ratio (SNR) for LN and WM on filter back projection and iterative reconstruction on each generation CT.
Note: Data are mean values (standard deviation) [range].
Quantitative analysis
Table 2 summarizes the visually assessed scores for gray– white matter contrast at each slice level on both scanners. Visual assessment of contrast on FBP images resulted in significantly higher scores on third-generation CT than on second-generation CT, at each slice level and for both readers (p ≤ 0.002; Figure 2). Visual assessment of contrast on IR images at the level of the semiovale center and basal ganglia showed significantly higher scores on third-generation CT than on second-generation CT for both readers (p ≤ 0.038; Figure 3). However, the contrast scores for the level of the fourth ventricle did not significantly differ between second- and third-generation CT for either reader (p > 0.05). In the comparison between FBP and IR, the scores for the gray–white matter contrast at the level of the semiovale center, basal ganglia, and the fourth ventricle were significantly higher with IR than with FBP on the second-generation CT, for both Reader 1 (all p values < 0.001) and Reader 2 (p = 0.012, 0.001, and 0.007, respectively), whereas on third-generation CT, IR images were not significantly different to FBP images for either reader (all p > 0.05). Substantial agreements were obtained for the inter-reader scores using FBP, with the mean ICCs of the scores for the contrast at the level of the semiovale center, basal ganglia, and the fourth ventricle being 0.78, 0.77, and 0.74, respectively. With IR, moderate inter-reader agreement scores were obtained, with mean ICCs for the contrast at each slice level being 0.52, 0.67, and 0.56, respectively
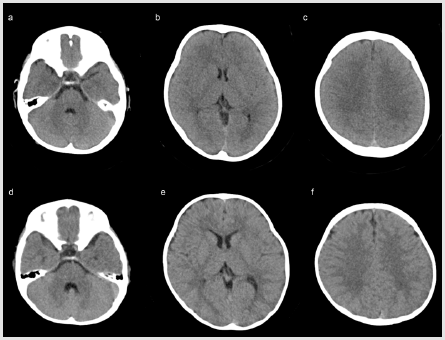
Figure 2: Comparison of representative head CT images of second-generation (a–c), and third-generation CT (d–f) reconstructed using filtered back-projection. Images from two 1-year-old boys are shown at the level of the fourth ventricle (a,d), basal ganglia (b,e), and semiovale center (c,f). Gray–white matter contrast at each level was superior on the third-generation CT than on second-generation CT.
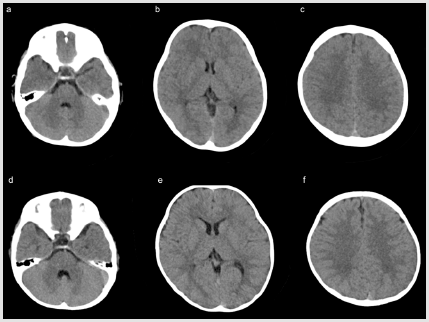
Figure 3: Comparison of representative head CT images of second-generation (a–c), and third-generation CT (d–f) using iterative reconstruction. Images are displayed at the level of the fourth ventricle (a,d), basal ganglia (b,e), and semiovale center (c,f) for the same children shown in Figure 2. On both generation CT scanners, the gray–white matter contrast at each level was improved compared with the filtered back-projection (Figure 2). The gray–white matter contrast was also slightly superior on third-generation CT than on second-generation CT.
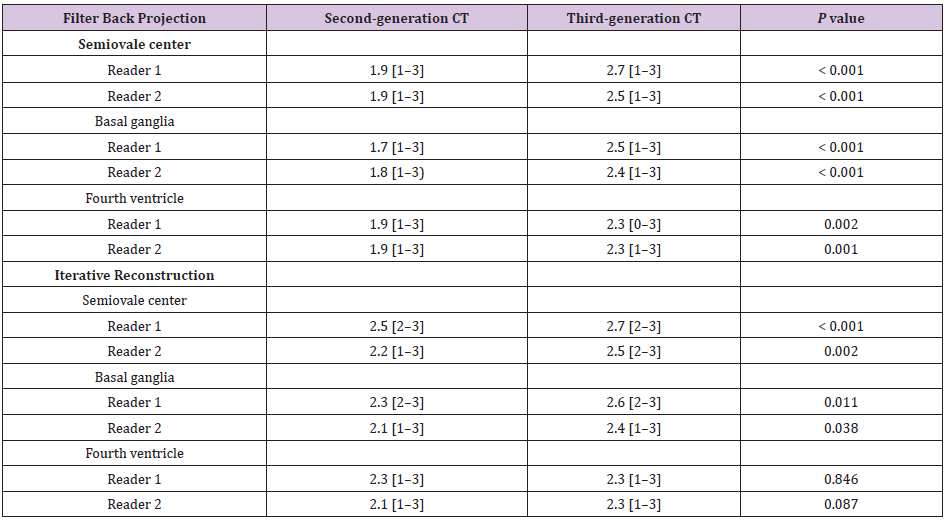
Table 2: Visually assessed scores for gray–white matter contrast in two readers.
Note: Data are the mean scores [range].
Discussion
Using FBP for image reconstruction, we found higher CNR,
SNR, and gray–white matter contrast of the pediatric brain on
third-generation CT than on second-generation CT. Generally, the
imaging quality of CT depends on the scanner system and scanning
protocol. The former includes the scanner detector, reconstruction
filters, and IR. As the tube current and CTDIvol did not significantly
differ between second- and third-generation CT in this study,
the better imaging quality with FBP on the third-generation CT
may be associated with the better scanner detector system. This
better imaging quality on third-generation CT may improve lesion
detectability, although we did not assess this in the current study.
Previously, image quality on third-generation CT was reported
to be better than that on second-generation CT with respect to
contrast-enhanced imaging [33,36,37] and stent lumen visibility
[32]. Regarding contrast-enhanced CT, the availability of high tubecurrent
on third-generation CT provides noise reduction, thus
resulting in improvement of the CT image quality, particularly at
the low tube-voltage used on contrast-enhanced CT [38].
The improved stent lumen visibility on third-generation CT in
comparison with second-generation CT was considered to be due
to hardware improvements and new reconstruction techniques.
Our results suggest that third-generation CT also achieves better
imaging quality for unenhanced pediatric head CT in comparison
with second-generation CT. This may lead to future reductions in the
radiation dose. Although there has been a tendency for reduction
of the radiation dose in recent years [27], a standard imaging
quality for pediatric use has not become well established [39]. In
the future, appropriate reduction of the radiation dose should be
assessed alongside lesion detectability. In this study, the use of IR
improved the CNR and SNR on both generation CT scanners. It
should be noted that the IR on the second- and third-generation CT
scanners used different algorithms: the second-generation CT used
SAFIRE for IR, and the third-generation CT used ADMIRE. SAFIRE is
a raw data-based IR technique, whereas ADMIRE performs detailed
modeling in the projection data domain, resulting in less noise and
improved artifact suppression [40].
IR has been reported to improve the image quality of pediatric
head CT acquired on both 64-slice multidetector CT and secondgeneration
CT [21,23]. We suggest that IR has the same effect for
pediatric unenhanced head CT on third-generation CT Nam et
al. [41] compared the image quality of CT angiography of young
children reconstructed by SAFIRE and ADMIRE, and considered
that image quality was better using ADMIRE than SAFIRE. In this
study, the degree of improvement in CNR and SNR was less on the
third-generation CT than on the second-generation CT. In addition,
visual assessment did not show a significant score difference
between FBP and IR on third-generation CT, although CNR and SNR
were improved. This lack of significant improvement may be due
to good CT imaging quality with FBP on the third generation CT,
resulting in there being little space for improvement using IR. As
the CT images were obtained on different groups of children, we
could not compare the same imaging data between second and
third-generation CT in this study.
Thus, differences resulting from the different IR methods could
not be clearly evaluated. However, with FBP reconstruction, second generation CT may contain more noise than third-generation CT,
and it may therefore be better to routinely use IR for pediatric
head CT on second-generation scanners, to ensure adequate image
quality, including gray–white matter contrast. The appropriate
setting of the strength level for IR remains a subject of debate. IR
with a greater strength level more effectively reduces noise on CT;
however, the greater strength level may cause over smoothing of
CT images [42,43]. Previous studies with contrast-enhanced CT
showed better imaging quality with a high IR strength setting [40].
In the current study, we used IR with a strength level of 2, according
to previous studies [21,44]. Although we did not compare CT
image quality with other IR strength levels, we believe the use of
a moderate IR strength level may be suitable for pediatric head CT.
With regard to the influence of IR and FBP on the imaging quality of anatomical features, the visually assessed scores at the level of the semiovale center, basal ganglia, and fourth ventricle did not differ greatly on the second-generation CT with both FBP and IR, whereas on third-generation CT the visually assessed scores were higher at the level of the semiovale center, followed by the levels of the basal ganglia and the fourth ventricle with both FBP and IR. In both scanners, score improvement on IR over that on FBP was relatively low at the level of the fourth ventricles compared with the supratentorial level. This may be due to the fact that the infratentorial structures are surrounded by thick bonystructure, which leads to less effective IR. In particular, the ADMIRE reconstruction may be less effective for improving imaging quality in the posterior fossa. This study is subject to a number of limitations. Although we compared pediatric brain imaging quality between second- and third-generation CT, we did not compare the same subjects between the two scanners. Although we compared age-matched children, conditions such as resting at the scanner differed across the children. We also only assessed the contrast of brain parenchyma in the normal brain; thus, lesion detectability should be investigated in the future. Finally, although the imaging factors were not significantly different between scanners, except for the pitch, the imaging parameters did show slight differences between the second- and third-generation CT, and these might have slightly affected image quality.
Conclusion
In conclusion, the image quality of pediatric brain CT was superior on third-generation CT than on second-generation CT, particularly when FBP reconstruction was used. IR may be effective for improving the contrast between gray and white matter on both generation CT scanners.
Acknowledgement
We thank radiology technicians at Tokai University Hospital for their skillful help.
Conflict of Interest
The authors declare no conflict of interest, financial or otherwise.
References
- Ohana O, Soffer S, Zimlichman E, Klang E (2018) Overuse of CT and MRI in paediatric emergency departments. Br J Radiol 91(1085): 20170434.
- Kralik SF, Finke W, Wu IC, Hibbard RA, Hicks RA, et al. (2017) Radiologic head CT interpretation errors in pediatric abusive and non-abusive head trauma patients. PediatrRadiol 47(8): 942-951.
- O Brien WT, Care MM, Leach JL (2018) Pediatric Emergencies: Imaging of Pediatric Head Trauma. Semin Ultrasound CT MR 39(5): 495-514.
- Sarioglu FC, Sahin H, Pekcevik Y, Sarioglu O, Oztekin O, et al. (2018) Pediatric head trauma: an extensive review on imaging requisites and unique imaging findings. Eur J Trauma EmergSurg 44(3): 351-368.
- Girard N, Brunel H, Dory Lautrec P, Chabrol B (2016) Neuroimaging differential diagnoses to abusive head trauma. PediatrRadiol 46(5): 603-614.
- Bajaj M, Offiah AC (2015) Imaging in suspected child abuse: necessity or radiation hazard? Arch Dis Child 100(12): 1163-1168.
- Vazquez E, Delgado I, Sanchez Montanez A, Fabrega A, Cano P, et al. (2014) Imaging abusive head trauma: why use both computed tomography and magnetic resonance imaging? PediatrRadiol 44 Suppl 4: 589-603.
- Roujeau T, Mireau E, Bourgeois M (2013) Nonaccidental head injury. Handb Clin Neurol 112: 905-912.
- Fundaro C, Caldarelli M, Monaco S, Cota F, Giorgio V, et al. (2012) Brain CT scan for pediatric minor accidental head injury. An Italian experience and review of literature. Childs NervSyst 28(7): 1063-1068.
- Lövblad KO, Altrichter S, Mendes Pereira V (2015) Imaging of acute stroke: CT and/or MRI. J Neuroradiol 42(1): 55-64.
- Radhiana H, Syazarina SO, Shahizon Azura MM, Hilwati H, Sobri MA, et al. (2013) Non-contrast computed tomography in acute ischaemic stroke: a pictorial review. Med J Malaysia 68(1): 93-100.
- Gutierrez LG, Rovira A, Portela LA, LeiteCda C, Lucato LT, et al. (2010) CT and MR in non-neonatal hypoxic-ischemic encephalopathy: radiological findings with pathophysiological correlations. Neuroradiology 52(11): 949-976.
- Demaerel P, Casteels I, Wilms G (2002) Cranial imaging in child abuse. Eur Radiol 12(4): 849-857.
- Nukui M, Kawawaki H, Inoue T, Kuki I, Okazaki Set al. (2018) Clinical characteristics of acute encephalopathy with acute brain swelling: A peculiar type of acute encephalopathy. Brain Dev 40(9): 792-798.
- Bletsch A, Mann C, Andrews DS, Eileen Daly, Giles MY Tan, et al. (2018) Down syndrome is accompanied by significantly reduced cortical grey-white matter tissue contrast. Hum Brain Mapp 39(10): 4043-4054.
- Bier G, Bongers MN, Ditt H, Bender B, Ernemann U, et al. (2016) Enhanced gray-white matter differentiation on non-enhanced CT using a frequency selective non-linear blending. Neuroradiology 58(7): 649-655.
- Moulin T, Cattin F, CrepinLeblond T, Tatu L, Chavot D, et al. (1996) Early CT signs in acute middle cerebral artery infarction: predictive value for subsequent infarct locations and outcome. Neurology 47(2): 366-375.
- Truwit CL, Barkovich AJ, GeanMarton A, Hibri N, Norman D, et al. (1990) Loss of the insular ribbon: another early CT sign of acute middle cerebral artery infarction. Radiology 176(3): 801-806.
- Inamasu J, Miyatake S, Nakatsukasa M, Koh H, Yagami T, et al. (2011) Loss of gray-white matter discrimination as an early CT sign of brain ischemia/hypoxia in victims of asphyxial cardiac arrest. EmergRadiol 18(4): 295-298.
- Lev MH, Farkas J, Gemmete JJ, Hossain ST, Hunter GJ, et al. (1999) Acute stroke: improved nonenhanced CT detection--benefits of soft-copy interpretation by using variable window width and center level settings. Radiology 213(1): 150-155.
- Ono S, Niwa T, Yanagimachi N, Takashi Okazaki, TakakiyoNomuraet al. (2016) Improved image quality of helical computed tomography of the head in children by iterative reconstruction. J Neuroradiol 43(1): 31-36.
- Kilic K,Erbas G, Guryildirim M (2013) Quantitative and qualitative comparison of standard-dose and low-dose pediatric head computed tomography: a retrospective study assessing the effect of adaptive statistical iterative reconstruction. J Comput Assist Tomogr 37(3): 377-381.
- Vorona GA, Zuccoli G, Sutcavage T, Clayton BL, Ceschin RC, et al. (2013) The use of adaptive statistical iterative reconstruction in pediatric head CT: a feasibility study. AJNR Am J Neuroradiol 34(1): 205-211.
- Stiller W (2018) Basics of iterative reconstruction methods in computed tomography: A vendor-independent overview. Eur J Radiol 109: 147-154.
- Halliburton SS, Tanabe Y, Partovi S, Rajiah P (2017) The role of advanced reconstruction algorithms in cardiac CT. Cardiovasc Diagn Ther 7(5): 527-538.
- Patino M, Fuentes JM, Singh S, Hahn PF, Sahani DV, et al. (2015) Iterative Reconstruction Techniques in Abdominopelvic CT: Technical Concepts and Clinical Implementation. AJR Am J Roentgenol 205(1): 19-31.
- Lee C, Pearce MS, Salotti JA,Harbron RW, Little MP, et al. (2016) Reduction in radiation doses from paediatric CT scans in Great Britain. Br J Radiol 89(1060): 20150305.
- Meyersohn NM, Szilveszter B, Staziaki PV,Scholtz JE, Takx RAP, et al. (2017) Coronary CT angiography in the emergency department utilizing second and third generation dual source CT. J Cardiovasc ComputTomogr 11(4): 249-257.
- Agostini A, Mari A, Lanza C(2019) Trends in radiation dose and image quality for pediatric patients with a multidetector CT and a third-generation dual-source dual-energy CT. Radiol Med124(8):745-752.
- Duan X, Wang J, Leng S, Schmidt B, Allmendinger T, et al. (2013) Electronic noise in CT detectors: impact on image noise and artifacts. AJR Am J Roentgenol 201(4): 626-632.
- Lell MM, Wildberger JE, Alkadhi H, Damilakis J, Kachelriess M, et al. (2015) Evolution in computed tomography: the battle for speed and dose. Invest Radiol 50(9): 629-644.
- Gassenmaier T, Petri N, Allmendinger T, et al. (2016) In vitro comparison of second- and third-generation dual-source CT for coronary stent visualization at different tube potentials. AcadRadiol 23(8): 961-968.
- Park C, Gruber Rouh T, Leithner D, Amelie Zierden, Mortiz H Albrecht, et al. (2016) Single-source chest-abdomen-pelvis cancer staging on a third generation dual-source CT system: comparison of automated tube potential selection to second generation dual-source CT. Cancer Imaging 16(1): 33.
- Mohan S, Rogan EA, Batty R (2013) CT of the neonatal head. Clin Radiol 68(11): 1155-1166.
- Landis JR, Koch GG (1977) The measurement of observer agreement for categorical data. Biometrics 33(1): 159-174.
- Meyer M, Haubenreisser H, Schoepf UJ, RozemarijnVliegenthart, ChristianneLeidecker,et al. (2014) Closing in on the K edge: coronary CT angiography at 100, 80, and 70 kV-initial comparison of a second- versus a third-generation dual-source CT system. Radiology 273(2): 373-382.
- Rompel O, Glockler M, Janka R, Sven Dittrich, Robert Cesnjevar, et al. (2016) Third-generation dual-source 70-kVp chest CT angiography with advanced iterative reconstruction in young children: image quality and radiation dose reduction. PediatrRadiol 46(4): 462-472.
- Itatani R, Oda S, Utsunomiya D, Funama Y, Honda K, et al. (2013) Reduction in radiation and contrast medium dose via optimization of low-kilovoltage CT protocols using a hybrid iterative reconstruction algorithm at 256-slice body CT: phantom study and clinical correlation. Clin Radiol 68(3): e128-135.
- Takei Y, Miyazaki O, Matsubara K, Shimada Y, Muramatsu Y, et al. (2016) Nationwide survey of radiation exposure during pediatric computed tomography examinations and proposal of age-based diagnostic reference levels for Japan. PediatrRadiol 46(2): 280-285.
- Scholtz JE, Kaup M, Husers K (2016) Advanced modeled iterative reconstruction in low-tube-voltage contrast-enhanced neck CT: evaluation of objective and subjective image quality. AJNR Am J Neuroradiol 37(1): 143-150.
- Nam SB, Jeong DW, Choo KS, Nam KJ, Hwang JY, et al. (2017) Image quality of CT angiography in young children with congenital heart disease: a comparison between the sinogram-affirmed iterative reconstruction (SAFIRE) and advanced modelled iterative reconstruction (ADMIRE) algorithms. Clin Radiol 72(12): 1060-1065.
- Bodelle B, Klein E, Naguib NN, RW Bauer, JM Kerl,et al. (2014) Acute intracranial hemorrhage in CT: benefits of sinogram-affirmed iterative reconstruction techniques. AJNR Am J Neuroradiol 35(3): 445-449.
- Kropil P, Bigdeli AH, Nagel HD, Antoch G, Cohnen M, et al. (2014) Impact of increasing levels of advanced iterative reconstruction on image quality in low-dose cardiac CT angiography. Rofo 186(6): 567-575.
- Scholtz JE, Wichmann JL, Bennett DW (2017) Detecting intracranial hemorrhage using automatic tube current modulation with advanced modeled iterative reconstruction in unenhanced head single- and dual-energy dual-source CT. AJR Am J Roentgenol 208(5): 1089-1096.
