 Research Article
Abstract
Among the causes of pathological gambling, the main theoretical reference models identify several conditions of greater individual vulnerabilities, underlined and sustained by a combination of biological, environmental, clinical, psychological, behavioural, economic and social predictive factors. This study aims to highlight aspects that motivate gambling. It provides a comparison between “heavy gamblers” (those who played more than 100 euro per week in the last three months), and “moderate risk gamblers” (those who gambled on average up to 100 euro a week in the last three months). In addition, the study aims to define characteristics of gambling, as well as of the gambler, which may facilitate the emergence of problematic addiction. Out of 1717 questionnaires administered, 1258 subjects filled the questionnaire stating that they had gambled at least once in the last three months: 41 (3%) were classifiable as “strong gamblers”, while 1157 (92%) were “moderate risk gamblers”. In the study, 80 subjects (6%) gambled on average more than 3 times a week, while 1140 subjects (91%) played up to 3 times a week. The family context also plays a fundamental role: 44% of “strong gamblers” and 19% of “moderate risk gamblers” reported having a family member who gambles.
Keywords: Gambling; Addiction; Risk Factors; Young Gamblers
Introduction
The Diagnostic and Statistical Manual of Mental Disorders (DSM-5) defines “Pathological Gambling” as a problematic gambling behaviour, recurrent and persistent in nature, which is a source of difficulty or clinically significant discomfort (American Psychiatric Association and American Psychiatric Association [1]. It is important to stress that only a small percentage of gamblers will develop a pathological form of addiction in the future. The main theoretical models of reference Blaszczynski, Steel, et al. [2- 4] identify, among the causes of the Pathological Gambling, several conditions of greater individual vulnerabilities, underlined and sustained by a combination of biological, environmental, clinical, psychological, behavioural, economic and social predictive factors. In other words, these models attribute the source of pathological gambling, fundamentally, to the greater vulnerabilities of some individuals to the addiction compared to others. Specifically, among the personality traits commonly associated with gambling and other risky behaviours, they identified impulsivity and the search for sensations and novelty Cloninger, Svrakic, et al, [5,6].
It is appropriate to assume that both problematic and nonproblematic gamblers generally base their judgment on the likelihood of uncertain events on the use of heuristic strategies. These strategies are effective in most cases, but in some situations may become a source of systematic errors Tversky, et al. [7,8]. An example is the “gambler’s fallacy”, which leads to an intuitively more likely occurrence of an event that, for example, has not occurred for a long period of time. On the basis of this mistaken belief, progressive betting systems (martingale) have been devised, often destinated to long-term defeat. The “gambler’s fallacy” explains the behaviour of the player who places bets, at the last minute, on the Lotto or Super Enalotto, who chooses to play with slot machines that have not been paid out for long time or who bets on “red spins” after ten consecutive “black spins” at roulette. It is possible, however, to apply progressive betting systems to the “late” numbers on the Lotto, but it is not possible to adopt a similar strategy, for example, to the game of Scratch Cards. In other words, it is the structure of the game that ensures that such errors in probabilistic reasoning will result into the ”chasing”, which is typical of problematic gaming.
The aim of the study was to verify the importance of the individual factors (gender, age), family or peer factors (presence of family members or acquaintances who gamble), socio-economic factors (level of education, employment status) and psychological aspects, in the genesis of gambling, by comparing “strong gamblers” (those who played on average more than 100 euro per week in the last three months) and “moderate risk gamblers” (those who played on average up to 100 euro per week in the last three months). This study design does not establish the degree in which each game induces erroneous strategies, but it aims to show that the belief that there are strategies that help to win is however more widespread among the “strong gamblers” compared to “moderate risk gamblers”. It is hypothesized that this difference is not attributable to a greater difficulty of “strong gamblers” to predict the outcome of uncertain events, but rather the fact that some games of chance are structured in a way that allows the strong gambler to translate the error in probabilistic reasoning into a fallacious game strategy, destined to long-term defeat. In fact, if it is possible to assume that gamblers, once they become problematic players, tend to choose gambling games that maximize the rewards due to winning bets (positive reinforcements). It is equally plausible to assume that those games with higher expected value, in which the number of winning bets is higher, tend to more easily induce a condition of addiction and turn the player into a pathological gambler.
Among the characteristics of several gambling games, we considered the “expected value of the game” as a secondary feature. The expected value of a gambling game can be defined as the value that is expected on average to win/lose after every single bet (Expected value = Probability of victory x the Sum won in case of victory - Probability of defeat x the Loss in case of defeat). Therefore, the expected value of a gambling game is an indicator of how convenient it is to play that particular game. A higher expected value, even if negative, generally implies the possibility, by investing the same amount of money, to obtain a greater number of winning bets, even if, in the long run, the sums won will be lower than the amount invested in the game. Finally, our study has the objective to verify “if” and “how much” some of the main risk factors for pathological gambling behaviour, as described in the literature, predict this behaviour.
Materials and Methods
The present study was conducted in 2015, through the administration of an anonymous questionnaire (Figure 1). The questionnaire was handed out at different collection points in surrounding areas of Imola and in local high schools. The questionnaire used for the present study was administered anonymously to subjects who independently decided to take part in the research. For minors, prior to proceeding with the administration of the questionnaire in the schools of the Imola territory, the methods and aims of the research were presented to teachers and managers of the involved schools, who approved the project? Out of 1717 questionnaires administered, we collected information from all questionnaires compiled by 1258 subjects who acknowledged they had gambled at least once in the last three months.
In order to address the research questions described in the Introduction, on the base of the data included in these questionnaires:
a. Sample descriptive statistics were calculated for the nominal variables, deriving from questions no. 1, 4, 5, 6 and from questions related to gender, qualification, employment status, and for the ordinal variables, deriving from the questions no. 2, 3 and from the question relating to age;
b. Comparisons were made between “strong gamblers” and “moderate risk gamblers” with regard to the variables described in questions no. 1, 4, 5, 6 and in questions related to gender, qualification, employment status (Pearson’s chi-square test, Odds Ratio - OR);
c. Non-parametric difference tests were carried out between the “strong gamblers” group and the “moderate risk gamblers” group (Wilcoxon-Mann-Whitney test) for the ordinal variables deriving from the question no. 2 and from the question related to age;
d. Parametric difference test was carried out between the “strong gamblers” group and the “moderate risk gamblers” group (T-test for independent groups) for the number of games played in the last three months;
e. For gambling games whose outcome is completely determined by chance, Kendall’s Tau correlation coefficient was calculated between the rank of the OR and the rank of the expected value;
f. Finally, a model of prediction of the “strong gamblers” category was tested through a logistic regression model, using several nominal and ordinal variables collected in the questionnaire (sex, age, family member who gamble, employment status, strategies that help to win, frequency of play, motivations to play). The level of statistical significance was considered satisfied in the case of the probability value (p), associated with the test, lower than 0.05. Regarding the interpretation of the effect size or strength of the association reported together with the p-value, reference was made to the Cohen criteria (Cohen, 1988) (≤0.10 small effect; ≥0.30 average effect; ≥0.50 large effect). The STATA/IC 13.1 for Windows (32- bit) software was used to conduct this analysis.
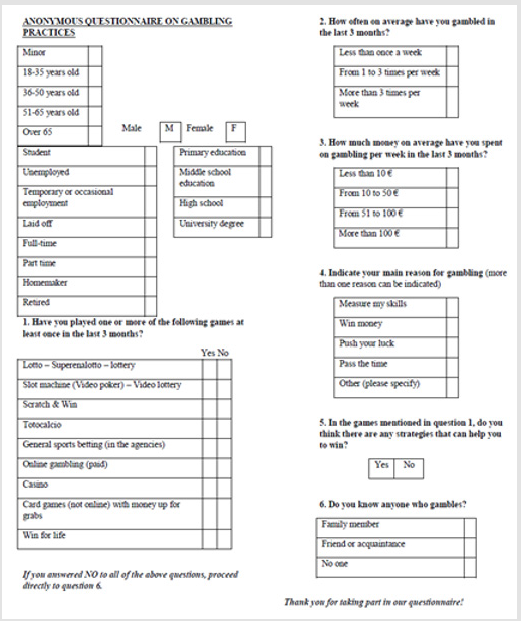
Figure 1: Questionnaire used for the detection of gambling behaviours.
Results
Statistical Description of the Sample

Figure 2: Sample distribution based on the amounts played on average each week
Of the 1258 subjects of the study sample, 41 (3%), classified as “strong gamblers”, spent more than 100 europer week on gambling, while 1157 (92%), classified as “moderate risk gamblers”, spent up to 100 europer week (Figure 2). In the study, 80 subjects (6%) gambled on average more than 3 times a week, while 1140 subjects (91%) played up to 3 times a week (Figure 3). The sample was made up of 682 males, 528 females and 48 subjects that did not indicate gender. The sociodemographic characteristics of the study population are shown in (Table 1). From the graph indications, the favourite type of gambling games are Scratch and Win tickets (860 subjects, equal to 68% of the sample) and sports betting at agencies (339 subjects, equal to 27% of the sample) (Figure 4). Regarding the factors that motivate gambling, 701 subjects (56%) played in the hope of winning money, 416 subjects (33%) played to pass the time, 285 subjects (23%) played to push their luck, 118 subjects (9%) played to measure their skills and 70 subjects (6%) indicated other motivations. 455 subjects (36%) believed that there are gambling strategies that help to win. Finally, 249 subjects (20%) have a family member who gambles, while 598 subjects (48%) have friends or acquaintances who gamble.
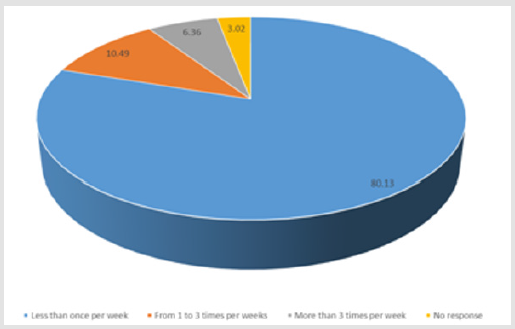
Figure 3: Sample distribution based on the frequency of gambling.

Figure 4: Distribution of the different types of gambling activities in the study sample.
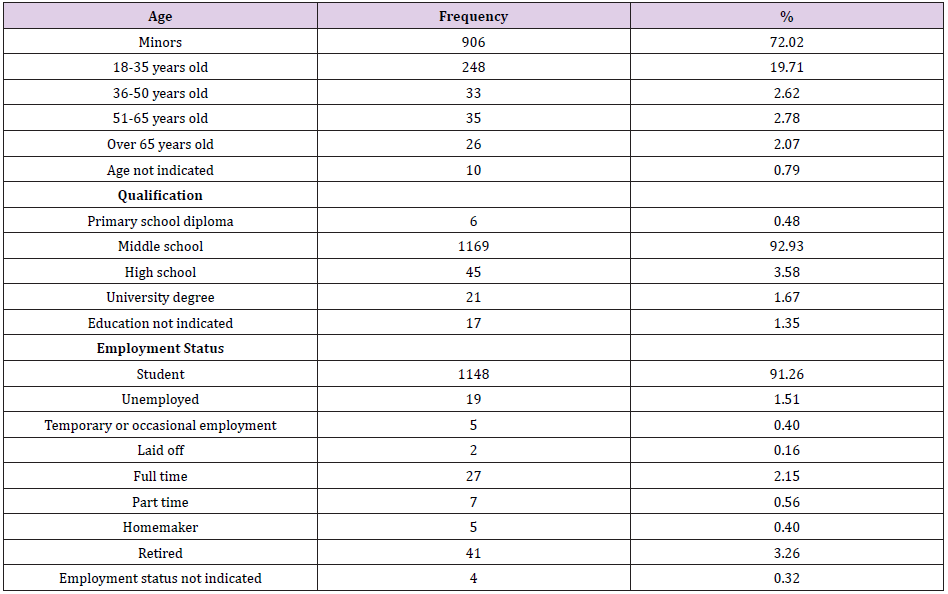
Table 1: Main characteristics of the study sample.
Differences between “Strong Gamblers” and “Moderate Risk Gamblers”: Nominal Variables
An initial statistically significant difference between “strong gamblers” and “moderate risk gamblers” is gender: 82% of “strong gamblers” are male, against only 56% of “moderate risk gamblers” (χ2 = 10.1420, p <0.001), although with a small strength of association (Cramér’s V -0.0916). The family context also plays a fundamental role. In particular, 44% of “strong gamblers” reported having a family member who gambles, while this percentage has decreased to 19% for “moderate risk gamblers” (χ2 = 15.5170, p < 0.001). Even in this case, the strength of association between variables is small (Cramér’s V 0.1111). Moreover, there are no significant differences between those who have a friend or acquaintance who gambles compared to those who do not know other gamblers. Among factors that motivate gambling (measuring their skills, winning money, pushing their luck, passing the time), a first significant difference between “strong gamblers” and “moderate risk gamblers” concerns the possibility of winning money (73% of the “strong gamblers” played in the hope of winning, against 55% of “moderate risk gamblers”) (χ2 = 5.2290, p <0.05, small effect: Cramér’s V 0.0645). “Strong gamblers” indicated other motivations behind gambling than “moderate risk gamblers” (17% of “strong gamblers”, compared to 6% of “moderate risk gamblers”) (χ2 = 10.6827, p <0.005, small effect: Cramér’s V 0.0922).
While 78% of “strong gamblers” believe that there are strategies that help to win, this percentage is reduced to 36% for “moderate risk gamblers” (χ2 = 29.5331, p <0.001, small effect: Cramér’s V 0.1563). Concerning qualification and employment status, no statistically significant differences were found between “strong gamblers” and “moderate risk gamblers”. (Table 2) shows the different types of gambling games and the degree to which the different games are more preferred by “strong gamblers” compared to “moderate risk gamblers” (Odds Ratio). Significant differences are observed for all games, with the exception of Scratch and Win.

Table 2: Differences between “strong gamblers” and “moderate risk gamblers” based on gambling game.
Differences between “Strong Gamblers” and “Moderate Risk Gamblers”: Continuous Variables
While no significant differences were found between “strong gamblers” and “moderate risk gamblers” regarding age, the results of the present study show that “strong gamblers” play more frequently than “moderate risk gamblers” (z = 13.630, p <0.0001). Besides, the “strong gamblers” played on average more than four gambling games (mean 4.46±2.72) in the last three months among those considered in the study, while the “moderate risk gamblers” played on average less than two (mean 1.83±1.24) (t = 12,6140, p <0.001).
Correlation between Preferences of “Strong Gamblers” Compared To “Moderate Risk Gamblers” And Expected Value (Gambling Whose Outcome Is Determined Exclusively By Chance)
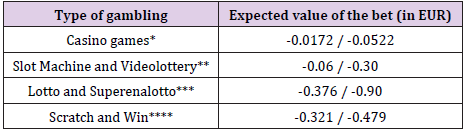
Table 3: Expected value of games whose outcome is determined completely by chance.
Note: *Considered games offered by the Venice Casino were: Blackjack, French Roulette, Slot Machine and Caribbean Stud Poker. The expected value of Casino games ranges from -0.0172 for Blackjack to -0.0522 for Caribbean Stud Poker. **The average expected value for Video lottery is equal to -0.111. The most convenient Videolottery model is characterized by an expected value of -0.06. The average expected value for slot machines is equal to -0.264. The less convenient Slot Machine model is characterized by an expected value of -0.30. ***The expected value of different Lotto bets (single number draw, positioning, both, 3 numbers, 4 numbers and 5 numbers) and of the Superenalotto game ranges from -0.376 for the single draw to -0.90 for the Superenalotto. ****The expected value of Scratch Cards has been calculated considering the last 6 series of Scratch Cards placed on the market (Tris Vincente, Wheel of Fortune, Level 4, New Horoscope, Christmas Magic and 2018). The tickets whose winning is equal to the price of the ticket itself are excluded from the calculation of the expected value, a situation that normally leads the player to purchase a second ticket. The most convenient Scratch card is the Tris Vincente, with an expected value of -0.321; the least expensive scratch card is 2018, with an expected value of -0.479.
For bets whose outcome is completely determined by chance, the relative expected value can easily be calculated from the probability shown in (Table 1). (Table 3) shows games whose outcome is determined exclusively by chance, ordered according to the expected value and the degree to which they are preferred by “strong gamblers” compared to “moderate risk gamblers”. As observed in (Table 4), “strong gamblers” tend to prefer more games whose expected value, albeit negative, is higher than the other games, compared to “moderate risk gamblers” (τ of Kendall = 0.912871, p <0.05 for one-sided hypothesis).
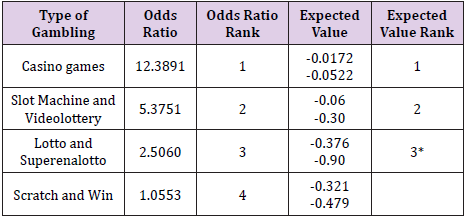
Table 4: Relationship between expected value and preference by “strong gamblers” compared to “moderate risk gamblers” for games whose outcome is completely determined by chance.
Logistic Regression
Finally, we checked whether and how much some nominal and ordinal variables collected in the questionnaire (sex, age, family members who gamble, employment status, strategies that help winning, gambling frequency, motivation to gamble) predicted“strong gambler” behaviour by applying a logistic regression model. The model indicates that it is not possible to identify a positive relationship between being a “strong gambler” and the gender and the age variables. Instead, it is possible to highlight a statistically significant positive relationship between being a “strong gambler” and the variables associated to “having other family members who gamble”, “employment status”, “strategies that help to win”, “gambling frequency” and “motivations for gambling”. Specifically, players who have a family member who gamble have an OR 2.92 times greater to gamble 100 euro per week than players who do not. Compared to the reference category “student”, those who are employed have an OR 92.94 times greater to gamble 100 euro per week. Players who think that there are strategies that help to win have an OR 3.07 times greater to gamble 100 euro per week than those who do not.
Compared to those who gamble less than once a week, gamblers who play 1 to 3 times a week have an OR 13.9 times greater to gamble 100 euro per week and those who gamble over 3 times a week have an OR 184.2 times greater to gamble 100 euro per week. Finally, those who gamble to win money have an OR 3.32 times greater to gamble 100 Euros per week than those who do not. Observing the pseudo value R2 = 0.5411 generated by the model, we can say that this model of predictors explains about 54.1% of the variance of the “strong gambler” behaviour.
Discussion
While emphasizing the importance in the origin of pathological gambling, factors pertaining to the individual, family and peer relations, socio-economic and psychological aspects, such as motivations for gambling, our study also analyses the characteristics of different games that may facilitate the onset of a problematic game mode. Firstly, the study shows that “strong gamblers” tend to prefer games with higher expected value, even if negative, than “moderate risk gamblers”. This association could be because once gamblers become problematic players, they tend to choose gambling that maximize the rewards due to winning bets (positive reinforcements). It is equally plausible to assume that games with higher expected value, in which the number of winning bets is higher, tend to induce more easily a condition of addiction and turn the player into a problem gambler. Regarding gamblers’ opinion about the existence of strategies that help to win, the present study shows that this belief is more prevalent among “strong gamblers” than “moderate risk gamblers”. This difference is not attributable to the greater difficulty of the former group to predict the outcome of uncertain events, because problematic gamblers, such as addicts and non-gamblers, are subject to the same errors in the probabilistic judgment Tversky et al, [7,8]. However, this difference is due to the fact that some games are structured in a way which allows the strong gamblers to translate the error in probabilistic reasoning into a fallacious game strategy, destined to long-term defeat.
Finally, the model with the highest number of predictors of being a “strong gambler” highlights as a risk factor having a family member who gambles, being employed compared to being a student, believing that there are strategies to win, gambling frequently and gambling with the motivation to win money. The data of the present study were collected in real-life context, so as to guarantee its generalization to other places and subjects. Moreover, the studied phenomenon is not suitable to be simulated in an experiment or in a quasi-laboratory experiment, either for practical or for ethical reasons. Therefore, if it was possible to identify an association between the degree in which “strong gamblers” prefer certain games and their expected value compared to “moderate risk gamblers”, it is not possible to demonstrate the existence of causality between these two variables. Regarding the theoretical constructs underlying the research, although it is plausible to assume that the population of pathological gamblers substantially overlaps the population of “strong gamblers”, pathological gambling is not defined according to the total amounts played, but it depends on the relationship that the gambler has with the game.
Conclusion
In conclusion, the data of the present study provide useful indications both for the prevention of pathological gambling addiction and for the choice of the most appropriate therapeutic strategies which may be adopted with problematic players, as well as offering suggestions for future research.
References
- (2013) American Psychiatric Association, and American Psychiatric Association, (Eds.). Diagnostic and Statistical Manual of Mental Disorders: DSM-5. (5th Edn). American Psychiatric Association, Washington, DC, USA.
- Blaszczynski, A, Z Steel, NmMcConaghy (1997) Impulsivity in Pathological Gambling: The Antisocial Impulsivist. Addiction (Abingdon, England) 92 (1): 75-87.
- Sharpe, Louise (2002) A Reformulated Cognitive-Behavioral Model of Problem Gambling: A Biopsychosocial Perspective. Clinical Psychology Review 22 (1): 1-25.
- Shaffer Howard J, Debi A LaPlante, Richard A LaBrie, Rachel C Kidman, Anthony N Donato, et al. (2004) Toward a Syndrome Model of Addiction: Multiple Expressions, Common Etiology. Harvard Review of Psychiatry 12 (6): 367-374.
- Cloninger CR, DM Svrakic, TR Przybeck (1993) A Psychobiological Model of Temperament and Character. Arch Gen Psychiatry 50(12): 975-990.
- Sacchetti Cleta, Stefano Martinelli, Marco Bassani, Anna Rita Atti, Giuseppe Pascarella, et al. (2017) The Evaluation of Proximity Interventions: A Pilot Study. Creative Education 8(9): 720-726.
- Tversky, Amos, Daniel Kahneman (1971) Belief in the Law of Small Numbers. Psychological Bulletin 76 (2): 105-110.
- Tversky Amos, Daniel Kahneman (1974) Judgment under Uncertainty: Heuristics and Biases. Science 185 (4157): 1124-1131.
