 Research Article
Abstract
Geographic knowledge graph is the extension of knowledge graph in geography. As the basic data of geographic data, spatial address contains rich spatial information and semantic information. It is a simplified geographic knowledge graph. In this paper, we integrate geographic knowledge into spatial addresses, study how to combine spatial information with semantic information by knowledge representation learning. The spatial address data set is trained on the TransE and TransH, two classical translation models, and a comparative study is conducted through triple classification and distance estimation between vectors. The research proves the TransH model is obviously superior to the TransE model in the task of modeling complex relationships. This study combines spatial relationships with semantic knowledge, which effectively solves the two major problems of address entities with similar semantic distance but not close in spatial distance and close spatial distance but not similar in semantic distance. The results of the research will be able to excavate more valuable information, can help the completion of geographic knowledge graph, and can provide a reference for the representation learning of geographic knowledge graph.
Keywords: Geographic Knowledge Graph; Spatial Address Data; Knowledge Based Representation Learning; Trans E; Trans H
Introduction
The continuous generalization of geographic information has become an important feature of the new geographic information era [1,2]. With the extensive application of location big data, massive location big data such as address is generated, and address data is generalized geographic data. The composition of address data includes text description and location description, namely semantic address information and spatial address information. It has become a hot research problem in the development of geographic information science and technology to research the fusion of the two based on the knowledge graph technology and dig out more valuable information in the address. Traditional address entity representation methods can be divided into two categories, one is the numeral based longitude and latitude location method, the other is the text to represent the geographical entity, this paper discusses the text representation method with more research significance. Address entity text representation is actually geocoding problems, in this information age, how to address entity accurately is the computer to understand and calculate, it is crucial to the problem, a large number of scholars to research, geographic entity not only contains rich semantic information, however, its contains spatial information is often neglected, easy to cause the address entity semantic similarity space distance is not close and similar semantic space distance is not similar, therefore, the combination of semantic information and spatial information will help to solve this problem, providing a new method for geographic information mining.
In 2012, Google first proposed the concept of knowledge graph [3], and took it as the knowledge brain of Google search engine, fundamentally solving the problem of semantic search. The purpose of knowledge graph is to describe the various entities that exist in the real world and concepts, as well as the relationship between them, the huge amounts of information into knowledge stored in this way, widely used in semantic search, intelligent q&a, the realization of personalized recommendation, and other functions, such as social networking and e-commerce but also extremely important in the field of commercial value [4]. With the rapid development of satellite remote sensing and sensor technology, a large number of location based geographic data access to and use by people, knowledge graph technology in geographical community to get the favour of a large number of scholars, geographical scholars began efforts of knowledge graph in the geographical science, discusses the application of geographic knowledge graph building and [5], the construction of corpus [6-8], geographic entities and relationship extraction [9,10], the implementation of “geography data, information, knowledge, wisdom” intelligent into [11], using knowledge enhancement technique can build intelligent interactive virtual geographic environment [12] service framework, Knowledge representation of trajectory data containing time and space is carried out by means of knowledge nesting technology, People’s Daily habits are mined [13], and deep recursive neural network is used to carry out the disambiguation task of geographical entities on social media data [14].
The extensive application of knowledge graph technology has accelerated the transformation of mass geographic data to geographic information, and also extended the new thinking of geo-science research for geographers. However, knowledge graph is a structured semantic network in essence, which is used to represent the interconnections between knowledge and construct the relationship network between entities, so as to carry out the relevant calculation of knowledge. In this process, knowledge representation is a key step in the construction and application of knowledge graph [15]. Knowledge representation of learning [16] the purpose lies in the knowledge base entities and relationships in the dense with a low dimensional vector, said in a low dimensional space the closer the distance between the object vector represents the higher semantic similarity, and the farther the distance between the object vector represents the lower the semantic similarity, the representation of knowledge learning to computing the semantic links between the entities and relationships, to quantify the semantics of the close degree between objects, so as to improve the accuracy of low frequency object [17-22]. Basic geographic data has the great effect of space vehicle and the stock of knowledge [11], along with the expansion of knowledge graph technology in geography, geographic data knowledge role has been greatly enhanced, but ignores the geographical space vector function of the nature of the elements of the most elements such as geographical spatial distribution and time evolution process and regional characteristics, such as how to geographic data of spatial relation and the semantic relationship between fusion, has become the geographical knowledge graph is a big problem.
As an important part of geographical data, address data not only provides geographical entity location attribute in space, but also provides hierarchical association of geographical entity semantically. Constructing address knowledge graph can solve the problem of semantic relation and spatial relation fusion of geographic knowledge graph. Two similar geographic entities at the semantic level does not represent the distance in space is also similar, such as south China normal university and east China normal university, but there are 1400km away, and two geographical entities on the space distance of close nor its similar at the semantic level, such as Bainaohui computer city and third affiliated hospital of zhongshan university are less than one hundred meters, but literally has nothing to do, therefore, when doing the representation of geographical entity study, the relationship between entities should not be limited to the semantic relationship, a large number of spatial relations [23-29] should also be taken into account, the two should be mutual fusion can make up for a lack of their own. At present, there are few reports on the integration of the spatial relationship and semantic relationship of geographical entities in expressive learning.
This study takes geographic knowledge graph as an example, we will conduct research on the construction of address knowledge graph that fuse spatial and semantic relationships. It focuses on the learning problems of knowledge graph, and compares the spatial address data sets in the two classic translation models, TransE and TransH. Use the methods of triple classification and distance evaluation between vectors to perform quantitative analysis and find the representation learning model that is most suitable for spatial addresses. By selecting test samples and calculating entity text similarity, linear distance and vector distance respectively, it is verified that the address entity can effectively solve the problem of semantic space inconsistency of address entity after being transformed into spatial vector by the representation learning method. This research will help to more accurately construct the knowledge graph of addresses, and provide a reference for the representation learning of geographic knowledge graph. Provide new research ideas for the research of geographic information science in the field of knowledge graph.
Research Methods
In this study, the constructed spatial address knowledge graph is used to establish a spatial address triple data set. The entities include address hierarchy see Table 1 for details name, information point name and information point type, and the relationship includes semantic relationship (address dependency relationship, attribute relationship) and spatial relationship (spatial distance). TransE and TransH, the classical models of learning, were used to train the address data set, and the advantages and disadvantages of the two models were evaluated by triple classification and distance.
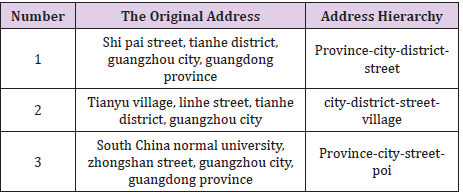
Table 1: Address hierarchy.
Address Hierarchy
According to the 2009 China national standardization management committee issued digital urban geographic information public platform name/address encoding rules, combined with the actual address name, place name, street name, Chinese address roughly divided into administrative areas, community name, door (floor) address and sign things such as a category five addresses(based on BiLSTM - CRF Chinese level address participle), name of experimental data selection point of interest as a geographic entity name, the street road, street, lane and land use types at all levels as an entity relationship between said.
Spatial Address Triple
Traditional hot said alone cannot apply to massive knowledge representation, RDF proposed a simple binary relation model to represent the semantic relationships between things, namely using a triple set way of describing things and relationships, gradually of three yuan for the basic unit of knowledge representation in knowledge graph, the entities and relationship are expressed as RDF triples data form (head entities, relationships, end entity) or down (h, r, t). In this paper, RDF data description method is used, as shown in Table 2. Address triples are expressed as (geographical entity name, spatial relationship/semantic relationship, hierarchical entity name). The address hierarchy is divided into four levels, which are residential village committee, street, lane, land type and information point. According to the Euclidean distance between the two information point is less than 50m as the adjacent rules, divided according to the longitude and latitude of each information point information point adjacent relations, resulting from the processing in this paper, the use of space address triples. Semantically, space address triples can be said in the knowledge base address entity hierarchy semantic relationship, can also be as entities with the attribute value; From the point of space, space address triples can be represented by neighboring relations address entity on the space distance and topology relations, also can use blackboard to ask address, such as the southeast northwest the orientation of the relationship between entities, can well completion knowledge graph on the geographical spatial knowledge representation method. Through the above space address triples can build knowledge graph.
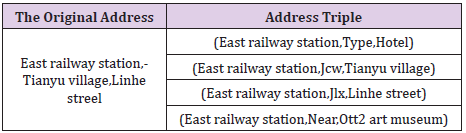
Table 2: Address triple.
TransE Model
Bordes et al. First proposed the TransE model in 2013. Based on the distributed vector representation of entities and relationships, consider the relationship r in each triple instance (head, relation, tail) as a translation from the head entity h to the tail entity t, by continuously adjusting h, r, and t, Make (h + r) as equal to t as possible to achieve the purpose of learning. The core idea is shown in Figures 1 & 2, that is, when (h, r, t) is true, there should be h + r ≈ t. Based on the core idea of the TransE model, we imagine that for a correct real triple, there exists (h + r) between the embedding of the entity and the relationship, which is infinitely close to t, and the wrong negative triple should exist (h + r) away t, so a scoring function is defined for the triple in the experiment, that is, the rationality is measured by the L1 or L2 distance of the difference between the vector of the head entity h and the relationship r and the vector of the tail entity t. The score function of TransE is As shown in formula (3-1), for a correct triple, the lower the score, the better, and for a wrong triple, the higher the score, the better. Train the model to distinguish between positive and negative samples. From this, we can get the hinge-based hinge loss function as shown in formula (3-2).
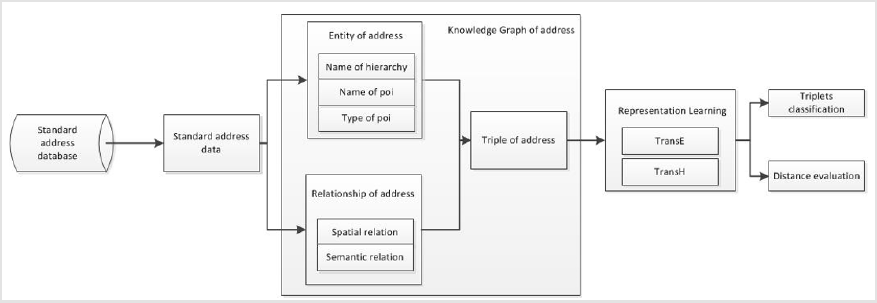
Figure 1: Flow map of the methodology.
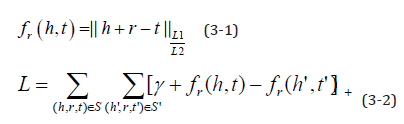
among them [x]+ Indicates that x is greater than 0 and the original value, and less than 0 is 0. γ Represents the hyperparameter margin used to distinguish positive and negative triples, this article takes 1; S Represents the set of positive triples, S' Represents the set of negative triples where the head or tail entities are randomly replaced. The TransE model training algorithm is shown in Figure 3.

Figure 2: Core idea map of the TransE.
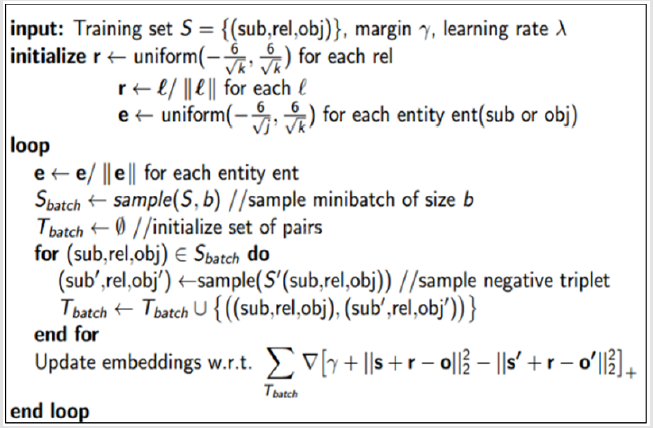
Figure 3: Model training algorithm diagram of the TransE.
TransH Model
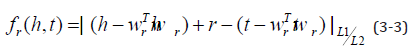
The TransE model, as the originator of the translation model, has the advantages of fewer parameters and low computational complexity.However, it has defects in handling non-one-to-one relationships, so subsequent scholars have improved the TransE model and even proposed it in 2014. TransH model proposed by Wang Z and other scholars [20]. In order to solve the problem that the model needs to assign different relationship vectors when dealing with different relationships, TransH defines a hyperplane for each relationship r, and uses the translation vector r and normal vector w of the relationship r on the plane to represent it. Given a real triple (h, r, t), the head entity h and the tail entity t are projected onto the hyperplane along the normal vector w and translated on the hyperplane. The core idea is shown in Figure 4, where The scoring function is shown in formula (3-3).
Different from the construction of TransE negative triples, TransH uses Bernoulli negative sampling to construct negative triples. In actual cases, the head and tail entities corresponding to the relationship are imbalanced, that is, there is a non-one-to-one Relationship, so it is not reasonable to use random negative sampling to replace head and tail entities. Therefore, a negative sampling method based on probability is designed in TransH: if the relationship is one-to-many, the head entity is replaced with a larger probability, and if the relationship is many-to-one, the tail entity is replaced with a larger probability. First, the average number of tail entities for each head entity needs to be counted in all triples, recorded as tph , The average number of head entities per tail entity, recorded as hpt , Define a Bernoulli distribution with sampling parameters as shown in formula (3-4). During training, we will use P( X =1) To construct negative triples by replacing the head entity with the probability of x, and construct negative triples by replacing the tail entity with the probability of P( X = 0) .
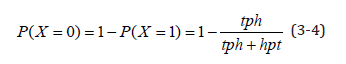
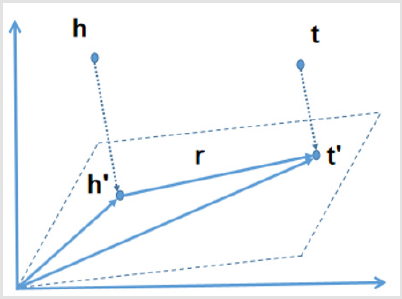
Figure 4: Core idea map of the TransH.
Experiments and Discussion
Experimental Data
The research area selected Tianhe District, Guangzhou, with a total of 118,807 POI information points. Data including address name (semantic address) and address the latitude and longitude (address space), in accordance with the address hierarchy, from the smallest administrative unit in the village, the hierarchical structure of the minimum network unit street road lane to address data partitioning entities and semantic relations, with 50m apart design are neighboring spatial relations, the resulting article 1658378 triples, addresses the knowledge graph construction see Figure 5, the processed data and relevant training data as shown in Tables 3 & 4.
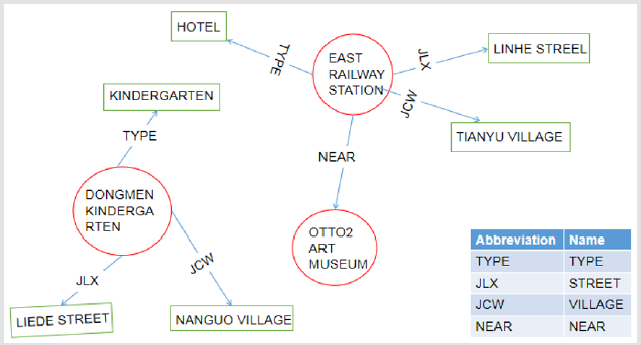
Figure 5: Display of address knowledge graph.

Table 3: Data Scale.
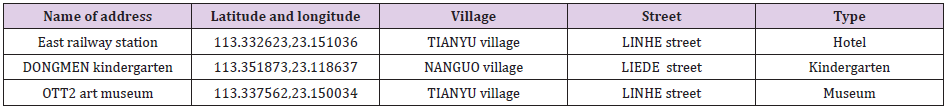
Table 4: Show of Data.
Experimental Design
The triples are input according to the data format required by TransE and TransH, and the training rate is 0.01 according to the stochastic gradient descent, with a margin of 1, a batch of 5000, and a dimension k of 128. The number of iterations is limited to 2000 for training, and the loss is reduced from 20 to 0.1, the training process is shown in Figure 6, and the models of TransE and TransH are obtained, based on which triple classification and distance evaluation are performed.
Figure 6: Model training flow map of TransE and TransH.
Experimental Methods
The goal of this research are extracted from knowledge base address space address triples data sets, respectively using TransE and TransH training, get entities to quantify, respectively, according to the distance between the entities vector to compare the two models address the merits of the triple data set in the space, by selecting test samples respectively space distance, entity semantic similarity computing entities and entity vector, the distance between the experiments are verified through the comparison and analysis to solve with the problem of spatial relations and semantics relations.
1) TransE Model Experiment and Partial Code Implementation
In this experiment, the serialized entities, relationships and training samples were firstly read in memory. During the training, loss of positive and negative triples were calculated for each epoch, each batch and each sample, and model embedding was updated through stochastic gradient descent to generate model files. The python code of the calculation diagram of TransE in Tensorflow is as follows:
self.headEntityVector=tf.placeholder(tf.int32,[None],name=”headEntityVector”)
self.tailEntityVector=tf.placeholder(tf.int32,[None],name=”tailEntityVector”)
self.relationVector=tf.placeholder(tf.int32,[None],name=”relationVector”)
self.ones=tf.placeholder(tf.float32,[None],name=”one”)
self.headEntityVectorWithCorruptedTriplet=tf.placeholder(tf.int32,[None],name=”headEntityVectorWithCorruptedTriplet”)
self.tailEntityVectorWithCorruptedTriplet=tf.placeholder(tf.int32,[None],name=”tailEntityVectorWithCorruptedTriplet”)
headEntityVector_embedding=tf.nn.embedding_lookup(self.embedding,self.headEntityVector)
tailEntityVector_embedding=tf.nn.embedding_lookup(self.embedding,self.tailEntityVector)
relationVector_embedding=tf.nn.embedding_lokup(self.embedding,self.relationVector)
headEntityVectorWithCorruptedTriplet_embedding=tf.nn.embedding_lokup(self.embedding,self.headEntityVectorWithCorruptedTriplet)
tailEntityVectorWithCorruptedTriplet_embedding=tf.nn.embedding_lokup(self.embedding,self.tailEntityVectorWithCorruptedTriplet)
headtailrel=tf.subtract(tf.add(headEntityVector_embedding,relationVector_embedding),tailEntityVector_embedding)
headtail_corrupted=tf.subtract(tf.add(headEntityVectorWithCorruptedTriplet_embedding,relationVector_embedding),tailEntityVectorWithCorruptedTriplet_embedding)
headtailrel_square_sum=tf.reduce_sum(tf.pow(headtailrel,2),1)
headtailrel_corrupted_square_sum=tf.reduce_sum(tf.pow(headtailrel_corrupted,2),1)
headtailrel_loss=tf.subtract(headtailrel_square_sum,headtailrel_corrupted_square_sum)
loss=tf.add(headtailrel_loss,self.ones)
loss_max=tf.nn.relu(loss)
loss_v=tf.reduce_mean(loss_max)
optimizer=tf.train.AdamOptimizer(0.01)
train_op=optimizer.minimize(loss_v)
returnatrain_op,loss_v,headEntityVector_embedding,tailEntityVector_ embedding,headEntityVectorWithCorruptedTriplet_embedding, tailEntityVectorWithCorruptedTriplet_embedding,relationVector_ embedding
2) TransH Model Experiment and Code Implementation
The algorithm calculation process of TransE and TransH is similar, except that in the model training process, a plane embedded vector w needs to be designed. When calculating positive and negative triples of different samples, the head and tail entity vectors projected on the plane w are used to calculate the loss, and Bernoulli sampling method is required for the design of negative triples. The python code of the calculation diagram of TransH in Tensorflow is as follows:
_w=tf.get_variable(name=“w”, shape=[128,1] , dtype=tf.float32)
w=tf.nn.l2_normalize(_w , name=“L2_normalize_w”)
self.headEntityVector=tf.placeholder(tf.int32,[None],name=”headEntityVector”)
self.tailEntityVector=tf.placeholder(tf.int32,[None],name=”tailEntityVector”)
self.relationVector=tf.placeholder(tf.int32,[None],name=”relationVector”)
self.ones=tf.placeholder(tf.float32,[None],name=”one”)
self.headEntityVectorWithCorruptedTriplet=tf.placeholder(tf.int32,[None],name=”headEntityVectorWithCorruptedTriplet”)
self.tailEntityVectorWithCorruptedTriplet=tf.placeholder(tf.int32,[None],name=”tailEntityVectorWithCorruptedTriplet”)
headEntityVector_embedding=tf.nn.embedding_lookup(self.embedding,self.headEntityVector)
tailEntityVector_embedding=tf.nn.embedding_lookup(self.embedding,self.tailEntityVector)
relationVector_embedding=tf.nn.embedding_lokup(self.embedding,self.relationVector)
headEntityVectorWithCorruptedTriplet_embedding=tf.nn.embedding_lokup(self.embedding,self.headEntityVectorWithCorruptedTriplet)
tailEntityVectorWithCorruptedTriplet_embedding=tf.nn.embedding_lokup(self.embedding,self.tailEntityVectorWithCorruptedTriplet)
headEntityVector_embedding_w=tf.matmul(tf.matmul(headEntityVector_embedding,w),tf.transpose(w))
tailEntityVector_embedding_w=tf.matmul(tf.matmul(tailEntityVector_embedding,w),tf.transpose(w))
headEntityVectorWithCorruptedTriplet_embedding_w=tf.matmul(tf.matmul(headEntityVectorWithCorruptedTriplet_embedding,w),tf.transpose(w))
tailEntityVectorWithCorruptedTriplet_embedding_w=tf.matmul(tf.matmul(tailEntityVectorWithCorruptedTriplet_embedding,w),tf.transpose(w))
headtailrel=tf.subtract(tf.add(headEntityVector_embedding-headEntityVector_embedding_w,relationVector_embedding),tailEntityVector_embedding-tailEntityVector_embedding_w)
headtail_corrupted=tf.subtract(tf.add(headEntityVectorWithCorruptedTriplet_embedding-headEntityVectorWithCorruptedTriplet_embedding_w,relationVector_embedding),tailEntityVectorWithCorruptedTriplet_embedding-,tailEntityVectorWithCorruptedTriplet_embedding_w)
headtailrel_square_sum=tf.reduce_sum(tf.pow(headtailrel,2),1)
headtailrel_corrupted_square_sum=tf.reduce_sum(tf.pow(headtailrel_corrupted,2),1)
headtailrel_loss=tf.subtract(headtailrel_square_sum,headtailrel_corrupted_square_sum)
loss=tf.add(headtailrel_loss,self.ones)
loss_max=tf.nn.relu(loss)
loss_v=tf.reduce_mean(loss_max)
optimizer=tf.train.AdamOptimizer(0.01)
train_op=optimizer.minimize(loss_v)
returnatrain_op,loss_v,headEntityVector_embedding,tailEntityVector_ embedding,headEntityVectorWithCorruptedTriplet_embedding, tailEntityVectorWithCorruptedTriplet_embedding,relationVector_ embedding
3) The Python Code for Constructing TransE’s Negative Triples is as Follows:
def getCorruptedTriplet(self,triplet): i=uniform(-1,1) if i<0: while True: entityTemp = sample(self.entityList,1)[0] if(entityTemp,triplet[1],triplet[2]) not in self.filter: break corruptedTriplet = (entityTemp,triplet[1],triplet[2]) else: while True: entityTemp = sample(self.entityList,1)[0] if(triplet[0],entityTemp,triple[2]) not in self.filter: break corruptedTriplet = (triplet[0],entityTemp,triplet[2]) return corruptedTriplet
4) The Python Code for Constructing TransH’s Negative Triples is as Follows:
def getCorruptedTriplet(self,triplet):
i=uniform(0,31)
if i<13:
while True:
entityTemp = sample(self.entityList,1)[0]
if(entityTemp,triplet[1],triplet[2]) not in self.filter:
break
corruptedTriplet = (entityTemp,triplet[1],triplet[2])
else:
while True:
entityTemp = sample(self.entityList,1)[0]
if(triplet[0],entityTemp,triple[2]) not in self.filter:
break
corruptedTriplet = (triplet[0],entityTemp,triplet[2])
return corruptedTriplet
Compare the advantages and disadvantages of the two; Because the data set selected in this experiment is a spatial address triplet, it cannot be inferred from the existing knowledge.For example, the a and b addresses are in a proximity relationship, and the b and c addresses are in a proximity relationship. Prove that a and c addresses are also adjacent, so this experiment does not choose link prediction and text relationship fact extraction as evaluation methods. Considering that in addition to semantic relationships, it also includes spatial distance relationships, so we choose triple classification and distance between vectors. Evaluation as a model evaluation method.
Triple classification
Triple classification refers to determining whether a given triple (h, r, t) belongs to the correct triple, which is essentially a binary classification task. For example, given a triple (East railway station, Near, Otto2 art museum), to determine whether the triple is correct by calculating whether the distance between the head entity vector plus the relationship vector and the tail entity vector is less than the threshold (the threshold size is determined by the validation set). By randomly selecting 1,000 triples to Construct the test data set and get the classification accuracy of TransE and TransH, as shown in Table 5. It is found that TransH (88.5%) is indeed better than TransE (71.7%) in terms of triple classification accuracy. There are many non-one-to-one relationships in the set.Therefore, TransH, which introduces hyperplane projection, performs better in the triple classification task of Chinese address data sets, indicating that modeling complex relationships is performed in the vector discretization task of Chinese address data. There is optimization.
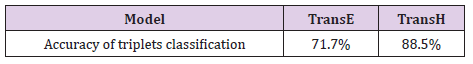
Table 5: Accuracy of triplets classification.
Distance evaluation
Distance evaluation refers to the calculation of the distance between the head entity vector plus the relationship vector and the tail entity vector in different models of the positive trigram and the negative trigram in different models, and according to the mechanism trained by the translation model (i.e., reducing the positive triad The distance between h + r and t in the group and the distance between h + r and t in the negative triad are increased) to evaluate the model’s pros and cons. The verification set of positive and negative triples was constructed by 1:1 relationship, and the vector distances in TransE and TransH were calculated, respectively. The results are shown in Table 6.TransH can be found in cases of triples (0.525) model is superior to the vector distance TransE (0.531), but in a negative example triples TransE on the vector distance (1.388) is superior to TransH (1.379), the difference of the two data point of view, TransE(0.857) is slightly better than TransH (0.854), showed that TransE and TransH two models in a single triples vector distance between training situation is similar, and do not have too big discrepancy, however, Select the same three address entities to display the results, as shown in Figures 7 & 8.
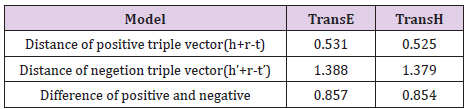
Table 6: Distance between triple vector.

Figure 7: Entity distance map of the TransE.

Figure 8: Entity distance map of the TransH.
In the algorithm model, both TransE and TransH, the distance between two entities with a relationship is indeed much closer than the distance between two entities without a relationship, For example, (East railway station, Otto2 art museum, 0.545 / 0.533) is much smaller than (East railway station, Dongmen kindergarten, 1.414 / 1.335) .However, it can be found from Figure 8 that in the TransH algorithm model, the neighbors describing the spatial distance are described. The distance between the relationship vector entities is better than other vector entity distances describing semantic relationships. For example, the (East railway station, Dongmen kindergarten, 1.335) without adjacent relations is greater than the (Hotel, Kindergarten, 1.235), (East railway station, Kindergarten, 1.141), (Otto2 art museum, Nanguo village, 1.173), (Otto2 art museum, Liede street, 1.224), while the neighboring relationship (East railway station, Otto2 art museum, 0.533) is less than (East railway station, Hotel, 0.613), (Otto2 art museum, Tianyu village, 0.552), etc., but this situation is not obvious in the TransE algorithm model, such as the existence of proximity (East railway station, Otto2 art museum, 0.545) less than (East railway station, Linhe street, 0.613), but greater than (Otto2 art museum, Tianyu village, 0.513), it can be speculated that TransH is more focused on complexity than TransE. Modeling the relationship, it can be found from Tables 1 & 2 that the number of neighboring relationships in the address triples data set is much larger than several other semantic relationships. The spatial relationship is more complex than the semantic relationship, so it performs better in the TransH algorithm model.
The Experimental Summary
It can be seen from the results of the above triple classification and vector distance evaluation that the TransH model is superior to the TransE model, so the training results of the TransH model are selected as the quantitative standard to evaluate the inconsistencies in the semantic and spatial similarity of traditional geographical entities to be solved in this study. Two groups of six geographical entities were selected, (Taipingyang computer city, Bainaohui computer city, Yidong computer city) and (Huoju building, Renfeng building, Modeng store), replace with A, B, C, D, E, F, by latitude and longitude respectively calculate the linear distance of A and B,L (AB) is 0.1km, L (AC) is 0.2km, L (DE) is 0.2km, L (DF) is 0.5 km, entities vector is obtained by TransH training respectively calculate the distance between A and B of the vector,V (AB) is 1.131, V (AC) is 0.551, V (DE) is 1.312,V (DF) is 0.571, according to the geographical entity semantic similarity computation, considering the geographic entity for short text, so choose relatively simple and efficient cosine similarity calculation method, to calculate the semantic similarity of A and B, S (AB) is 0.67, S (AC) is 0.58, S (DE) is 0.5, S (DF) is zero, thus it can be seen that the V (AC) is less than V (AB), on the basis of fully consider the semantic and the spatial relationship, the TransH model considers the A is more similar than the C, Although L (AB) on the space distance is less than L (AC), but A and C belong to day henan street, B belongs to huashi street, semantic relationship of similar degree higher than similar degree in the spatial relations, conforms to the characteristics of semantic similarity space distance don’t close, V (DF) is less than V (DE), on the basis of fully consider the semantic and the spatial relationship, TransH model think D entities and F more similar to the entity, though on the semantic relation S (DE) is greater than the S (DF), D, E, F belong to huashi street, but L (DF) is less than L (DE), the closer distance, There will also be more similar proximity around geographical entities, so it can be assumed that D is more similar to F, conforms to the characteristics of near space distance but not similar semantic. Above all, in the process of entity training, the model of representation learning combines the semantic relationship and spatial relationship of entities, which can solve the problem that the semantic and spatial inconsistency may exist when geographical entities represent geographical objects.
Conclusion
Based on the research of the TransE and TransH models, this paper collects the spatial address data of Tianhe District and extracts the spatial address triples. Based on the characteristics of the spatial address data set containing both semantic relationships and spatial relationships, the semantics of the spatial address triples are designed. The introduction of spatial and spatial relationships and spatial relationships makes up for the traditional method of calculating the similarity of two address entities based on address semantic relationships only, ignoring the shortcomings of semantically similar addresses that are not necessarily close in spatial distance.Through the TransE and TransH models, respectively Perform training, perform triple classification on the data set, and evaluate the distance between vectors, verify the knowledge representation learning capabilities of the two translation models on the spatial address data set, and confirm that TransH is performing in the spatial address triple data set. When representing learning tasks of complex (non-one-to-one) relationship triples, the learning effect is better than TransE.
It can effectively solve the difficulties of TransE’s modeling of complex relationships such as one-to-many, many-to-one, and many- to-many.TransH not only weighs and balances The complexity of the model and the ability to express the model are also designed, and Bernoulli sampling is also designed to better conform to the average entity at the head and tail of the data set. The method of constructing negative triples with inconsistent number characteristics makes the training of the model more reasonable and effective. The combination of semantic relationship and spatial relationship can solve the problem of semantic and spatial inconsistency in the representation of geographical entities. The introduction of spatial relationships in the data set will also greatly enrich the complex relationships in the geographic knowledge graph and dig out more valuable geographic information. At the same time, the use of Chinese datasets in knowledge representation learning can enrich the knowledge representation research of translation models in Chinese datasets, and also help us better perform text semantic research on Chinese texts, and facilitate the transformation of research results.
References
- Li Deren, Shao Zhenfeng (2009) On the New Era of Geographic Information [J]. Chinese Science (Series F: Information Science) 06: 3-11.
- Gong Jianya, Wang Guoliang (2013) From Digital City to Smart City: New Challenges Facing Geographic Information Technology [j]. Geomatics for Surveying and Mapping 38(2): 1-6.
- Pujara J, Miao H, Getoor L, William Cohen (2013) Knowledge Graph Identification[C].International Semantic Web Conference. Springer Berlin Heidelberg. pp. 542-557.
- Huang Hengqi, Yu Juan, Liao Xiao, Review of Knowledge Graph Research [J]. Journal of Computer System Applications 28 (6).
- Jiang Bingchuan, Wan Gang, Xu Jian (2018) Large-scale geographic knowledge map construction of multi-source heterogeneous data [J]. Journal of Surveying and Mapping 8: 1051-1061.
- Zhang Chunju, Zhang Xueying, Wang Shu (2016) Temporal and Spatial Information Labeling of Events in Chinese Texts [J]. Journal of Chinese Information Processing 30(3): 213-222.
- Zhang Xueying, Zhang Chunju, Zhu Shaonan (2012) Geospatial Relation Annotation of Chinese Texts [j]. Journal of Surveying and Mapping 03: 156-162.
- Wang Jibu, Lu Feng, Wu Sheng (2018) Construction method of geographic entity relation corpus based on automatic back-marking [J]. Journal of Geo-Information Science 20(131): 5-13.
- Gao Jialiang, Yu Li, Qiu Peiyuan (2019) An Open Relation Filtering Method for Geographic Entities Based on General Knowledge Base [J]. Journal of Geo-Information Science 21(9).
- Lu Feng, Yu Li, Peng Peng, A Keyword Extraction Method and Device Containing Geographic Entity Relations [J]. Journal of Geo-Information Science.
- Chen Jun, Liu Wanzeng, Wu Hao (2019) Basic problems and research directions of basic geographic knowledge services [J]. Journal of Wuhan University (Information Science Edition) 44(01): 41-50.
- Jiang Bingchuan, Tan Liheng, Ren Yan, Li Feng (2019) Intelligent Interaction with Virtual Geographical Environments Based on Geographic Knowledge Graph. ISPRS International Journal of Geo-Information 8(10): 428.
- Qian Tieyun, Liu Bei, Hung Nguyen, Yin Hongzhi (2019) Spatiotemporal Representation Learning for Translation-Based POI Recommendation. ACM Transactions on Information Systems 37(2): 1-24.
- Zuheros C, Tabik S, Valdivia A (2019) Deep recurrent neural network for geographical entities disambiguation on social media data. Knowledge-Based Systems 173: 117-127.
- Li Yongfang Research on Knowledge Graph Oriented Representation Learning [d].
- Bengio Y, Courville A, Vincent P (2013) Representation Learning: A Review and New Perspectives. IEEE Transactions on Pattern Analysis and Machine Intelligence 35(8): 1798-1828.
- Jiang Tianwen, Qin Bing, Liu Ting (2018) Open Domain Chinese Knowledge Reasoning Based on Representation Learning. Journal of Chinese Information Processing 32(3): 34-41.
- Bordes A, Glorot X, Weston J, Yoshua Bengio (2014) A semantic matching energy function for learning with multi-relational data. Machine Learning 94(2): 233-259.
- Socher R, Chen D, Manning CD, Andrew Y Ng (2013) Reasoning With Neural Tensor Networks for Knowledge Base Completion. International Conference on Neural Information Processing Systems. Curran Associates Inc.
- Wang Z, Zhang J, Feng J, Zheng Chen (2014) Knowledge Graph Embedding by Translating on Hyperplanes. Twenty-eighth Aaai Conference on Artificial Intelligence. AAAI Press.
- Lin H, Liu Y, Wang W, YinliangYue, ZhengLin (2017) Learning Entity and Relation Embeddings for Knowledge Resolution. Procedia Computer Science 108: 345-354.
- Minervini P, Fanizzi N, D'Amato C, Floriana Esposito (2015) Scalable Learning of Entity and Predicate Embeddings for Knowledge Graph Completion. 2015 IEEE 14th International Conference on Machine Learning and Applications (ICMLA). IEEE.
- Peiyuan Qiu, Jialiang Gao, Li Yu, Feng Lu (2019) Knowledge Embedding with Geospatial Distance Restriction for Geographic Knowledge Graph Completion [J]. International Journal of Geo-Information 8(6): 254.
- Tan Z, Zhao X, Fang Y, Weidong Xiao (2018) GTrans: Generic Knowledge Graph Embedding via Multi-State Entities and Dynamic Relation Spaces. IEEE Access 6: 8232-8244.
- Zhang Zhao, Ji Jianmin, Chen Xiaoping (2019) Adversarial negative sample generation for knowledge representation learning. Journal of Computer Applications.
- Wang Baokui, Wu Lin, Hu Xiaofeng, He Xiaoyuan (2019) Knowledge Representation of Joint Combat Situations Based on Knowledge Graph [j] .Journal of System Simulation 31(11): 2228-2237.
- Jin Jin (2018) Research on knowledge graph representation learning based on deep learning and entity description [d] .Beijing Jiaotong University.
- Winston PH (2017) On Computing Machinery and Intelligence. Philosophical Explorations of the Legacy of Alan Turing. Springer International Publishing.
- Cheng b, li w h, tong h x (2019) bilstm-crf based hierarchical address segmentation in Chinese [J]. Journal of geosciences 21(8): 1143-1151.
