 Research Article
Abstract
Objectives: Understanding the effects of different clinical contexts on key quality indicators will help laboratories account for unforeseen errors when circumstances change. Our aim was to assess hemolysis in relation to changing case-mix before and after a major earthquake.
Design and Methods: A preliminary investigation, over a two-week period in 2008, compared the hemolysis rates of blood specimens collected by nurses and phlebotomists from inpatients and emergency department patients using two techniques. The main investigation determined the percentage hemolysis rates of 676,045 blood specimens collected for potassium testing between February 2010 and November 2012. In the main study, emergency department, inpatient, and community data were compared using the Chi-squared (χ2) test. A negative association between specimen numbers and hemolysis rates was tested using a randomization procedure and spearman correlation coefficients.Results: In the preliminary study, 2.2% (nurses) and 3% (phlebotomists) of the specimens collected from inpatients using straight needle venipuncture in the antecubital fossa area hemolyzed. This contrasted to hemolysis rates of 18% (nurses) and 20% (phlebotomists) for blood collected from IV starts in the emergency department. Prior to the earthquake, our laboratory received 79% of its specimens for potassium testing from inpatient wards, 20% from an emergency department, and 1% from acutely ill community patients. After the earthquake, an almost 30-fold increase in community testing (from 200 to ~6000 specimens per month) corresponded with an abrupt decrease in mean monthly hemolysis rates (from 23% to 7%; r= -0.083, p<0.001). A negative association between number of specimens and hemolysis rates was significant for the inpatient (rs -0.43; p<0.01) and community (rs – 0.84; p<0.01) groups.
Interpretation/Conclusion: Variability in hemolysis rates between clinical settings was primarily associated with techniques used. High use of IV starts was associated with high hemolysis rates in the Emergency Department. When venipuncture was used to draw blood from stable inpatients or healthy community patients, hemolysis rates were low. A decrease in hemolysis rates observed following the large influx of specimens from community patients likely reflects a “dilution” effect from relatively healthy patients in whom venipuncture is undertaken in more optimal circumstances.
Keywords: Hospital Laboratory; Hemolysis; Phlebotomy Techniques; Potassium; Emergency Department; Community; Inpatients/p>
Abbreviations: CHL: Canterbury Health Laboratories; Inpatient: public-hospital ward patients Community: primary care clinics, outpatients and private hospitals; ED: emergency department; HRs: hemolysis rates; Pre-quake: period spanning February 2010 – 21 February 2011; before 22 February 2011 Christchurch earthquake. Period that CHL received specimens from the emergency department, inpatients, and acutely ill patients treated in the community. Influx: 23 February 2011 – 14 June 2012; period that CHL received a mass increase in numbers of specimens from non-acute patients in the community. During this period mean monthly hemolysis rates of community blood specimens collected for potassium testing decreased from 23% (pre-quake) to 7% (influx); Post-influx: 14 June 2012 – November 2012; period after 14 June 2012, when the influx of non-acute community specimens ended at CHL and resumed at a community laboratory.
Introduction
A significant number of all blood specimens received by clinical laboratories are rejected due to hemolysis [1,2]. Hemolysis confounds the interpretation of several analytes, including critical parameters such as potassium, which may be falsely elevated. This problem leads to repeat specimen collection delaying results for acutely ill patients. Hemolysis is caused by a range of pre-analytical factors including the skill and practice of the blood drawer, the gauge of needle used, the technique used, and the body anatomical site from which blood is drawn from [3]. There are few published reports that compare hemolysis rates of blood specimens collected from different health care settings, over time. Blood specimens taken from acutely ill patient emergency department (ED)and public hospitals are tested at the central hospital laboratory (Canterbury Health Laboratories (CHL)). The 22 February 2011 Christchurch Earthquake destroyed Christchurch City’s two community laboratories responsible for non-acute, non-urgent diagnostic testing [4]. Consequently, CHL undertook most of the city’s community diagnostic testing for the following year and a half. After June 2012, community testing was re-established at one of the former community laboratories, in a new building [4].
In a preliminary study, we compared the hemolysis rates (HRs) of blood specimens collected by nurses and phlebotomists from Christchurch Hospital inpatients and ED patients, in June 2008. The mean percentage hemolysis rate of specimens received by CHL between October 2009 and 21 February 2011 was 8.9%. It dropped to 5.9% between March 2011 and June 2012. The reduction was attributed to the influx of specimens from non-acute community patients following the earthquake. In the main study, we compared HRs of blood collected for potassium testing from different clinical care settings (community, hospital inpatient, and emergency department), before and after the earthquake.
Methods
As a baseline, we compared HRs of blood specimens collected by nurses and CHL phlebotomists from Christchurch Hospital inpatients and ED patients over two weeks in, June 2008. For inpatients, blood was collected from the antecubital fossa area using straight needle venipuncture with evacuated blood tubes. In the ED, blood was collected from IV starts placed on arms or hands, taking the first withdrawal. Blood was processed in the laboratory as described for the main study below. In the main study, we retrospectively evaluated HRs of blood specimens collected for potassium testing between February 2010 and November 2012. This period was split into three-time phases for analysis. ‘Pre-quake’ was defined as the period from February 2010 to 21 Feb 2011; ‘Influx’ was defined as the period spanning 23 Feb 2011 through to 14 June 2012 when CHL received a mass influx of specimens from the community; and ‘Post-influx’ was defined as the period from 14 June 2012 through November 2012 after which, community specimen testing was re-established at a new community laboratory. Specimens were routinely received from patients in the Christchurch Hospital Emergency Department (the single acute emergency department (ED) in the Canterbury region); Christchurch’s public hospital inpatient wards (inpatients); and primary care clinics, blood collection centers, outpatients, and private hospitals in the community (community).
Blood specimens were collected in lithium heparin gel tubes, from ED patients and acute community patients by nurses, doctors, or an IV technician. In the ED, blood is typically drawn using IV starts, but may also have been drawn using straight needle venipuncture, or winged-infusion (“butterfly”) needles from anywhere on arms, hands and feet depending on the type of trauma, age of patient, and skin texture. A wide range of needle sizes are used, ranging from 14 to 24 gauge, depending on the size and condition of patients. In the inpatient wards and non-acute community settings, blood is normally collected by certified phlebotomists (~50% in inpatient settings) or nurses using flushed IV starts and straight needle venipuncture with evacuated blood collection tubes or syringes. Except in extremely difficult cases, blood is drawn from the anticubital fossa area with 21-22-gauge cannula diameter needles into evacuated blood collection tubes. Most non-acute community patients (including outpatients) were bled from the antecubital fossa by nurses in primary care surgeries, midwives, and certified phlebotomists (~45%) in blood collection centers using standardized techniques.
Blood specimens were centrifuged immediately after receipt at the laboratory, unless they arrive from distant towns. If transportation took more than four hours specimens were centrifuged prior to transport. All ED and most inpatient specimens (~95%) were transported to the laboratory via pneumatic tube (taking approximately 10-15 minutes) [4]. Specimens from acute and non-acute community patients were transported to the laboratory by taxi (if taking 30 minutes to one hour) and courier (if taking more than one hour). Hemolysis was measured at CHL using a semi-quantitative serum index. Blood samples were diluted in 0.9% saline and the absorbance measured at seven wavelengths on Abbott Chemistry analyzers - c8000 (before February 2011) and c16000 (after February 2011) [4]. Serum index values (0 – >2.5g/L) were calculated from the absorbance readings using pre-programmed formulae. The cut off used to denote hemolysis in this study was >0.35g/L free hemoglobin. Hemolysis rates are expressed as percentages per month.
Statistical Analysis
Hemolysis rates of specimens from each health care setting were compared using the Chi-squared (χ2) test. The association between HRs and number of specimens is inherently negatively correlated because number of specimens is the denominator in the calculation of HR. For this reason, the association between HRs and number of specimens was tested using a randomization procedure, which simulated the null distribution of Spearman’s correlation coefficient for the association. The test was based on 1000 simulated values. From this distribution (which was independently generated for each sample tested), empirical p-values were generated for the observed Spearman’s correlation coefficients (rs).
Results
During the preliminary two-week trial in 2008, 3% (315/10503) and 2.2% (308/14001) of the specimens collected by phlebotomists and nurses, respectively, from inpatients hemolyzed. In contrast, 20% (35/175; phlebotomists) and 19.9% (375/1886; nurses) of the specimens collected from ED patients hemolyzed. During the main study period, a total of 676,045 specimens were analyzed between February 2010 and November 2012. Prior to the earthquake (pre-quake), CHL received approximately 79% of all its specimens for potassium testing from the inpatient wards (mean=13,317, median= 13,496), 20% from the ED (mean=3,331, median=3,375), and the other 1% from acutely ill patients in the community (mean=200, median= 197; Fig. 1a). Over the study period, absolute specimen numbers from the ED remained constant. In contrast, during the influx period, numbers increased slightly from the inpatient wards, and approximately 30-fold from the community (Figure1a & Table 1). During the influx, most community testing was for healthy or non-acute patients. Post-June 2012, community specimen numbers dropped but remained above pre-quake levels.
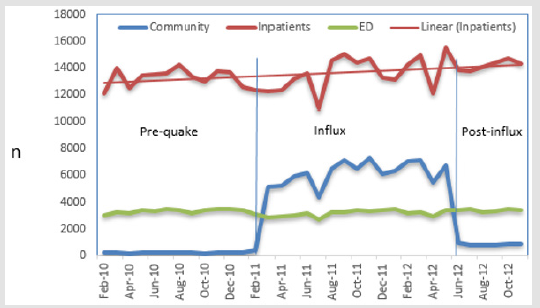
Figure 1a: Number of Potassium Tests (n). Note: ED=Emergency Department. Pre =February 2010 to 21 February 2011. Influx = 23 February 2011- June 2012. Post-influx= 15 June 2012-December 2012).
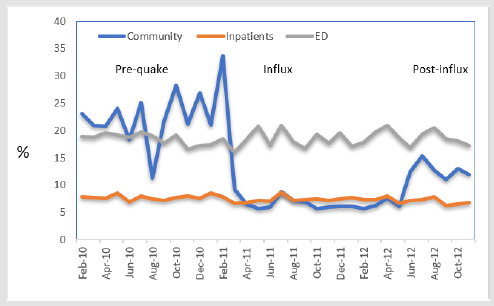
Figure 2b: Hemolysis rates (%).
Hemolysis occurred considerably more frequently in the ED (18%; 20,498/110,974) and pre-quake community specimens (22%; 521/2,404) from acutely ill patients than in the inpatient (7.4%; 34,244/461,523) and influx community (7.1%; 7,426/103,548) specimens (Figure 1b & Table 1). ED hemolysis rates were constant across the study period (median= 18.5%; Figure 1b & Table 1). Pre-quake community HRs fluctuated and peaked in February 2011, but the mean (23%) and median values (21%) were not significantly different from those of the ED (Table 1). The abrupt drop in community HRs (mean=7%, median=6.2%) during the influx period corresponded with the mass influx of specimens from the non-acute community setting. The increase in community HRs (mean=13%, median=12.9%) after June 2012 corresponded with the significant drop in non-acute community diagnostic testing at CHL during that phase (compare Figures 1a & 1b). During the influx period, community and inpatient HRs were not significantly different (Table 1). The 1% reduction in the inpatient HRs from pre-quake to influx and pre-quake to post-influx was significant (Table 1).
In several clinical settings, HRs decreased as number of specimens increased. Significant negative correlations were observed within the inpatient (rs = -0.43, p<0.01) and community (rs = -0.84, p<0.01) settings, but not within the ED setting (rs = -0.19, p=0.13).
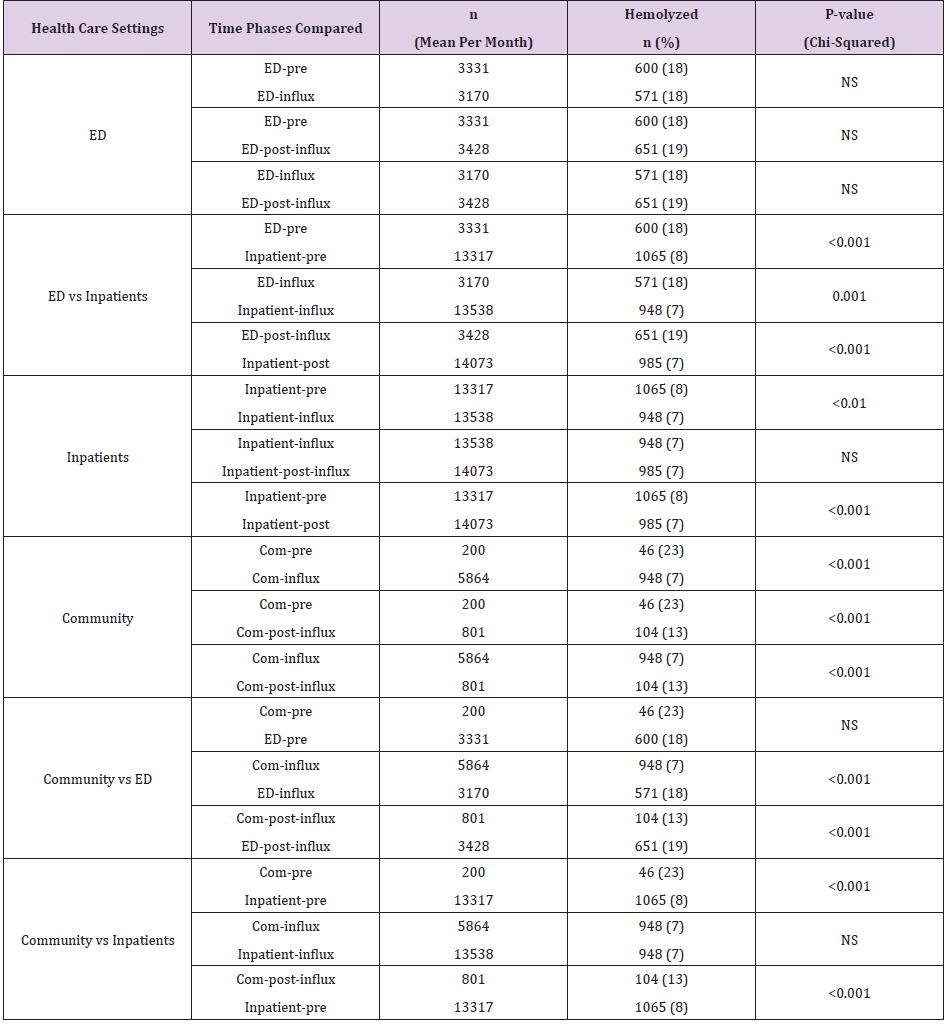
Table 1: Comparisons of hemolysis of potassium specimens between healthcare settings.
Note: NS=not significant. ED-pre= emergency department prior to 22 Feb 2011. ED-influx= emergency department during period of mass influx of additional specimens from community (23 Feb 2011- 14 June 2012). ED-post-influx= emergency department after the mass influx (June 2012 -Nov 2012). Inpatient-pre= inpatients prior to 22 Feb 2011. Inpatient-influx= inpatients during period of mass influx of additional specimens from community (23 Feb 2011- 14 June 2012). Inpatient-post-influx= inpatients after the mass influx (June 2012 -Nov 2012). Com-pre= community prior to 22 Feb 2011 earthquake (Feb 2010- 21 Feb 2011). Com-influx= community during period of mass influx of additional specimens from community (23 Feb 2011- 14 June 2012). Com-post-influx= community after the mass influx (June 2012 -Nov 2012).
Discussion
This study confirmed that hemolysis rates vary in different clinical settings. ED HRs were similar in the 2008 study and the longer 2010 to 2012 study. This finding suggests that the high hemolysis rate in the ED could generally be influenced by the common practice of withdrawing blood from IV starts placed on distal parts of the arm or hand, and condition of the patient [2,3,5- 8]. A study that compared HRs in an ED with outpatient clinics found that 16% of ED specimens hemolyzed compared with none from outpatients [7]. All the ED specimens were collected from IV starts in that study, and the first specimen drawn more frequently hemolyzed than subsequent specimens [9-12]. Other studies have found a reduction in numbers of hemolyzed specimens on serial draws from IV starts or subsequent venipuncture from non ED environments [8,13]. In a study of 788 emergency department patients, Florkowski, et al. [13] reported 177 (22%) of patients had a least one hemolyzed blood specimen on the first draw. Of these patients, 112 (63%) had subsequent blood specimens withdrawn, usually outside the ED that did not hemolyze.
Pre-quake-quake acute community HRs were statistically like those of the ED. This result should be interpreted with caution because the number of pre-quake community specimens received by CHL was low and variable. None-the-less, pre-quake community specimens received in our laboratory were from acutely unwell patients who required urgent blood tests. Consequently, patient condition may have been a factor influencing hemolysis of blood from these patients. The peak in community specimen HRs in February 2011 may have been brought about by delays in transporting and processing specimens during the first week after the earthquake when the city was in a state of emergency. During the initial days, courier fleets stopped and when they started again, large volumes of specimens arrived at CHL that had been collected several days earlier and sat in vehicles in the summer heat [14]. Further delays were incurred in processing specimens because the coding systems of the destroyed community laboratories did not match those of CHL. These factors possibly contributed to the high number of specimens that hemolyzed that week.
The low HRs of specimens collected from inpatients and community patients compared with ED patients supports a relationship between hemolysis and withdrawal technique. Low HRs of blood from inpatients and outpatients are generally attributed to withdrawal from flushed IV starts and by venipuncture from the antecubital fossa by skilled nurses or certified phlebotomists, [3,5,7,10,13] which was observed in our case. Studies have reported that blood taken this way is two to three times less likely to hemolyse than blood taken by other methods [1,2,11]. The lowest HRs have been reported for outpatients. When phlebotomy techniques are standardized, skill of drawer may be an important variable. After the earthquake, as inpatient numbers increased processes were computerized and streamlined at the CHL Blood Collection Centre. Consequently, phlebotomists collecting blood from inpatients knew in advance how many patients they needed to see, and where and why. This reduced pressure on staff, improved turnaround times [4], and may have been a contributing factor in the decline in HRs observed for the inpatient wards. Hawkins, [2] reported a similar inverse association in outpatient settings.
His study used a cut-off value (0-0.5 g/L free hemoglobin) like that of our study and found a significant increase in HRs when specimen numbers were low. He suggested that a goal of 5% is feasible. Hawkins concluded that workload and experience are important determinants in phlebotomy competency. Empirically, our community findings support those of Hawkins [10] except in our case the low-volume pre-quake community specimens were from acutely unwell patients and the high-volume influx community specimens were primarily from non-acute or healthy patients. Therefore, we may be seeing a patient “dilution” effect.
Limitations
We analyzed data for community and outpatients together and HRs could have differed between these two groups. Before the earthquake, CHL only tested community blood specimens from acutely unwell patients. Post-earthquake, the exact proportions of tests for acute and non-acute community patients otherwise is not known. Knowing the exact proportions would have given us more insight into the relationship between the number of specimens and HRs in the community group.
Conclusion
We observed variability in HRs due to a shifting case-mix of patients in our laboratory catchment following the Christchurch earthquake. This variably related to patient condition and techniques of blood withdrawal. These findings support current thinking that blood withdrawal from IV starts is associated with high HRs. and that blood withdrawn from the antecubital fossa area by venipuncture is associated with lower HRs.
Acknowledgement
We thank Lesney Stuart, Neil Langford, and Gordon Sutton for analytical methods information; Clint Edwards for emergency department phlebotomy information; Karen Heatley for CHL phlebotomy information; Carolyn Tallentire and Gordon Sutton for community phlebotomy information; Malcolm Main for data and statistical analyses and reviewing the manuscript.
References
- Lippi G, Blanckaert N, Bonini P, Green S, Kitchen S, et al. (2008) Haemolysis: an overview of the leading cause of unsuitable specimens in clinical laboratories. Clin Chem Lab Med 46(6): 764-772.
- Heyer NJ, Derzon JH, Winges L, Shaw C, Mass D, et al. (2012) Effectiveness of practices to reduce blood sample hemolysis in (Eds.)., a laboratory medicine best practices systematic review and meta-analysis. Clin Biochem 45(13-14): 1012-1032.
- Burns ER, Yoshikawa N (2002) Hemolysis in serum samples drawn by emergency department personnel versus laboratory phlebotomists. Laboratory Medicine 33(5): 378-380.
- Taylor K, George P, Deely JM (2014) Laboratory turnaround times in response to an abrupt increase in specimen testing after a natural disaster. Am J Clin Pathol 142(1): 35-42.
- Lowe G, Stike R, Pollack M, Bosley J, O'Brien P, et al. (2008) Nursing blood specimen collection techniques and hemolysis rates in an emergency department: analysis of venipuncture versus intravenous catheter collection techniques. J Emerg Nurs 34(1): 26-32.
- Lippi G, Salvagno GL, Favaloro EJ, Guidi GC (2009) Survey on the prevalence of hemolytic specimens in an academic hospital according to collection facility: opportunities for quality improvement. Clin Chem Lab Med 47(5): 616-618.
- Munnix IC, Schellart M, Gorissen C, Kleinveld HA (2011) Factors reducing hemolysis rates in blood samples from the emergency department. Clin Chem Lab Med 49(1): 157-158.
- Dugan L, Leech L, Speroni KG, Corriher J (2005) Factors affecting hemolysis rates in blood samples drawn from newly placed IV sites in the emergency department. J Emerg Nurs 31(4): 338-345.
- Ong ME, Chan YH, Lim CS (2008) Observational study to determine factors associated with blood sample haemolysis in the emergency department. Ann Acad Med Singapore 37(9): 745-748.
- Hawkins RC (2010) Phlebotomy site haemolysis rates vary inversely with workload. Clin Chem Lab Med 48(7): 1049-1051.
- Fang L, Fang SH, Chung YH, Chien ST (2008) Collecting factors related to the haemolysis of blood specimens. J Clin Nurs 17(17): 2343-2351.
- Proehl J, Bradford J, Leviner S, Storer A, Barnason S, et al. (2012) Clinical practice guideline: prevention of blood specimen hemolysis in peripherally collected venous specimens.
- Florkowski C, Wallace J, Walmsley T, George P (2010) The effect of hemolysis on current troponin assays-a confounding preanalytical variable? Clin Chem 56(7): 1195-1197.
- Sowemimo SCoker SO (2002) Red blood cell hemolysis during processing. Transfus Med Rev 16(1): 46-60.
