 Mini Review
Abstract
Since air pollution constitutes one of the main environmental threats for human, the World Health Organization (WHO) as well as other national or regional authorities established Air Quality Guidelines (AQGs) to monitor the air pollution and prevent its harmful impact on the population. This paper presents the results of a monitoring program of the air pollution in the scientific campus of Lille university, which aims at measuring the exposure of the campus users to air pollution and to analyse the spatial variation of the pollution in the campus. Results show that despite some peaks in the air pollution and important spatial variation, the air quality is acceptable regarding EU and WHO recommendations.
Keywords: Air pollution, Campus, Monitoring, PM, NO2, EU, WHO, Recommendations
Introduction
Air pollution constitutes one of the main environmental threats for human. The World Health Organization (WHO) reports that air pollution kills around 7 million people in the world each year. In Europe, despite the slow improvement in the air quality, air pollution causes around 467 000 premature deaths per year [1]. According to the European Environment Agency, the air pollution monitoring should focus on the following pollutants [2]: nitrogen dioxide (NO2), sulfur dioxide (SO2), ozone (O3) and particulate matter. Road traffic and fossil energy production constitute the major cause of NO2, while SO2 is mainly emitted by the industrial activity. O3 is formed from oxides of nitrogen (NOx) and volatile organic compounds (VOCs) under the action of light. Its concentration in urban area is lower than that in rural area, because it vanishes when it reacts with other pollutants. Particulate matter refers to solid and liquid particles in the air. It is produced by both human activity (traffic, domestic combustion, industry, construction activity) and natural activity (windblown dust, wildfires and volcano eruptions activities). Table 1 summarizes the EU references values and WHO quality guidelines (AQGs) for main air pollutants [3]. It shows that the WHO quality guidelines are mostly stricter than that of the EU, in particular for PM2.5, PM10 and SO2. Since air pollution is dependent on human activity [4], its concentration could have important spatial and time variation. In order to explore this variation, air pollution was measured at different locations of Lille University campus. This paper presents the results of this monitoring program as well as the relationship between measured values and the campus activity.
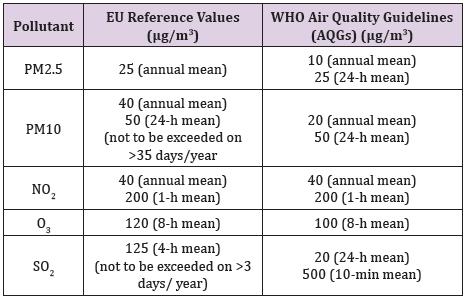
Table 1: European Union (EU) reference values and World Health Organization (WHO) air quality guidelines (AQGs) for the main air pollutants [3].
Methods
The air pollution monitoring program was conducted at the Scientific Campus of Lille University, located in the City of Villeneuve d’Ascq in the North of France. The area of the campus is around 130 hectares with large green area and around 100 buildings for research, education, administration and sportive activity. The campus is heated by a district heating system using gas energy. The campus is close to main highways, which are particularly congested at rush hours. According to the EU recommendations, the monitoring program included the measurement of the concentration of NO2, SO2, O3, PM2.52 and PM10. Measurements were conducted using the professional air quality station ECOMSMART. To analyze the spatial variation of the pollutant’s concentration, measurements were conducted at 5 locations in the campus. Figure 1 shows these locations. 4 Canton is located at the South access of the campus, which suffers from traffic congestion at the rush hours. IMT is located at the West of the campus, very close to a highly congested highway. Green space, Library and Pariselle are located inside the campus with reduced traffic activity.
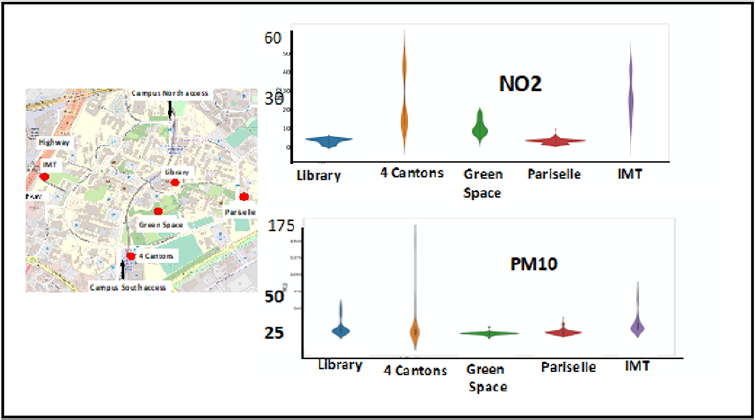
Figure 1: Spatial variation of the air pollution (NO2 and PM10) in the Cmpus.
Results and Discussion
The presentation of results is limited to PM10 and NO2, which are significant for the activity on the campus and surrounding environment, which are mainly affected by the traffic activity. Figure 1 shows the spatial variation of the concentration of NO2 and PM10 inside the campus. It could be observed that the concentration of NO2 is very low inside the campus: It is inferior to 10 μg/m3 at the Library and Pariselle and to 10 μg/m3 at the Green space station. The mean value of the NO2 concentration at the Library and Pariselle is equal to 3.2 μg/m3, while that at Green space station is equal to 10.5 μg/m3 (Table 2). The concentration of NO2 at IMT and 4 Cantons includes 2 levels of pollution levels. The first level is inferior to 10 μg/m3, which corresponds to off-peak hours, while the second level is in the range 30-60 μg/m3, which corresponds to the peak hours. The mean value of the NO2 at 4 Cantons and IMT is equal to 23.5 μg/ m3and 26.9 μg/m3, respectively. Globally, the NO2 concentration in the campus is accepted according to both EU and WHO standards, which set the 1-hour mean limit concentration of NO2 to 200 μg/m3. The variation of PM10 in the campus shows trends similar to that of NO2. The value of the concentration inside the campus (Library, Pariselle and Green space) is lower than that of locations close to the traffic activity (IMT and 4 Cantons). The mean value of PM10 concentration in the campus is inferior to 21.0 μg/m3. However, at the rush traffic hour, the concentration of PM10 at 4 Cantons and IMTS 160 μg/m3 and 80 μg/ m3, respectively. Globally, according to the EU recommendations, the concentration of PM10 in the campus is acceptable (EU PM10 limit = 40 μg/m3), while it slightly exceeds the WHO limit (in only one location (WHO PM10 limit = 20 μg/m3).
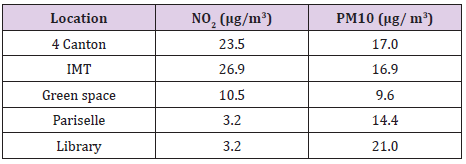
Table 2: Mean values of the concentration in NO2 and PM10 in the Campus.
Conclusion
This paper presented the results of an air pollution monitoring program, which was conducted in the Scientific Campus of Lille University. Recorded values show that the concentration of NO2 and PM10 inside the campus are lower than that at the campus periphery, because of the high traffic activity at the rush hours near the campus periphery. However, according to the EU and WHO recommendations, the air quality in the campus is globally acceptable. This good air quality could be attributed to the large green area in the campus, the absence of industrial activity, and the reduced traffic inside the campus.
References
- (2014) World Health Organization. 7 million premature deaths annually linked to air pollution.
- (2016) European Environment Agency. Premature deaths attributable to air pollution.
- (2014) European Parliament, Directorate-General for internal policies, policy department a: economic and scientific policy. EU air quality policy and who guideline values for health. European Union.
- Annesi Maesano I (2017) The air of Europe: where are we going? Eur Respir Rev 26: 170024.
