 Research Article
Abstract
Heavy rainfall associated with severe flash floods cause loss of life and property. Forecasting of these severe weather events is highly essential because of their impacts on infrastructure and life over Egypt. Sinai Peninsula and sometimes southern parts are more affected by frequent heavy rainfall during the last decade in January. Early warning of these events will contribute avoiding destructive effects. WRF model was run with three convective cumulus schemes (Kain-Fritsch, Grell-Devenyi and Betts-Miller- Janjic) to simulate rainfall during January 14-19 in 2008 and 2009 over Egypt. The run of the model was done based on two nest domains at horizontal resolution of 27 km for mother domain and 9 km for nest domain to establish the best scheme that simulates rainfall better than the other two schemes during the period of study over the country. After comparing rainfall from these convective schemes with corresponding daily-clim reanalysis, Grell among the chosen cumulus convective schemes was found to give better results compared to other cumulus schemes along the period of the study. Synoptic study of these two cases was conducted. It is found that the extreme rainfall events were due to amalgamation between tropical and mid latitudes pressure systems.
Abbreviations: KF: Kain Fretch; GDAS: Global Data Assimilation System; GFS: Global Forecast System; NCEP: National Centre for Environmental Prediction; G3D: Grell 3D; BMJ: Betts Miller Janjic; GRADS: Grid Analysis and Display System
Introduction
Climate of Egypt
Climate of Egypt is generally described as arid and semi-arid, characterized by hot, dry summers, mild winters and erratic rainfall [1]. Most parts of the country are occupied by the Sahara Desert, which represents the widest area of severe aridity over world (Domores and Tantawi). Rainfall in Egypt is very unususal, with nearly an annual average of 12 mm [2]. The mean annual rainfall is from 0 mm/year in the desert to 200 mm/year in the northern coast. Rain falls in the winter [3]. Most of Rain is concentrated on the northern part of the country. It is between 150 - 200 mm, and decreases gradually to the south reaching around 24 mm. The climate in winter (December-February) is cold, moist, mostly cloudy and rainy. The depressions of Cyprus are the most feature in winter, while in summer (June-August) it is hot, dry and no rain with clear sky. The low pressure of Indian monsoon and the Azores high are interacting alternatively, that if the Indian low is prevailing the high pressure goes back and vice versa. In spring (March-May) Khamasine depressions are associated with high temperatures, very dry and usually sandstorms. The depressions that are formed at Atlas Mountains and move easterly on the northern desert prevails in spring. In autumn season (September-November) the extension of Sudan low as inverted V shape trough is accompanied with upper air trough that prevailing and causing thunderstorms with heavy rainfall because of the generation of the humid air comes from the Red Sea In Egypt, heavy rainfall frequently occurs in many regions namely upper Egypt, eastern desert of Egypt, and Sinai Peninsula. The worst heavy rainfall in Egypt occurred in 2 November 1994 in Drunka Village (Assuit, Upper Egypt) and the 18 January 2010 in wadi El Arish (Northern Sinai) [4]. The Sinai region has an average annual rainfall of 80-100 mm (Enviromental Science Service Administration 1951-1960).
An efficient forecast can save millions of lives and properties from the upcoming disasters and hazards. Early warning is used in decreasing damages associated to thunderstorm activities. We need high-resolution observations and numerical modeling technique to better predict heavy rainfall events and understand the evolution and development mechanisms of mesoscale convection and storms responsible for heavy rainfall. Many studies have been made around the world to evaluate physical schemes of WRF model. WRF model was used to understand how topography and land surface conditions affect the extreme convection in western and eastern Himalayas [5]. Studies have been conducted so far in Bangladesh using WRF model [6] simulated WRF using KF (Kain Fretch) as cumulus and YSU as PBL (planetary boundary layer) scheme to understand heavy rainfall over Bangladesh. Kumar, et al. [7] performed a simulation of high impact rainfall events over the whole Indian subcontinent to analyze the performance of physical options of WRF model. It was found that the model can be very useful for forecasting of rainfall and depression tracks in short range time scales over Indian monsoon region.
The Objectives of the Study
a) One effective way to reduce the risk of heavy rainfall and flash floods lies in the implementation of an early warning system.
b) To identify an optimized cumulus convective schemes of WRF model for forecasting an extreme rainfall during the period of study (2008-2009) in January.
Data and Methodology
Study Area
Egypt has suffered more than once of flash floods during the last decade especially over Sinai and sometimes over the southern parts of the country. It becomes necessary to study heavy rainfall all over the country through the study period.
Data Used
1) Six hourly reanalysis data FNL, with 1° × 1° horizontal grid points have been used as initial and boundary conditions data for the WRF model from NOAA (National Oceanic and Atmospheric Administration).
2) Daily rainfall climate data with horizontal grid spacing 0.1° x 0.1° over the period of the study are used from NOAA and National Climatic Data Center (NCDC) ftp://ftp.cpc.ncep.noaa. gov/fews/fewsdata/africa/arc2/bin to analyze the rainfall over Egypt.
3) Six hourly mean sea level atmospheric pressure (MSLP), absolute vorticity and wind at 700hPa, moisture flux from 1000hPa to 500hPa, finally wind speed and direction at 200hPa, .Global Data Assimilation System (GDAS) are used for all cases with horizontal resolution of 1°X1° from the NOAA/NOMADS to diagnose and analyze the synoptic features in each case of study.
4) Visible satellite images for extreme cases during period of study at 06:00Am from: https://weather.us/satellite/africa/ satellite-visible-archive/20130114-1200z.html
The Used Schemes of WRF are Listed below:
a) Kain–Fritsch Scheme [8] (KF).
b) Betts–Miller–Janjic Scheme [9] (BM).
c) Grell 3D Ensemble Scheme [10] (GR).
Design of Experiment and Model Domain
The study period is in January from 2008 and 2009. To simulate these two events WRF model version 3.7 is used with fixed two nesting domains depending on the purpose, timeframe and location. Horizontal resolution of 27 km for mother domain and 9 km for nest domain are used. The parent domain takes information from FNL analysis every six hour, while nesting domain takes information from parent domain every time step. A time step of 180 seconds is used for the integration of two domains. The model is integrated for forecasts up to 168 hours. In this study, two domains are configured, as shown in Figure 1. Domain 1 is the main domain with a horizontal grid spacing of 27 km and it covers some of the surrounding regions. Domain 2 is nested domain at 9 km grid spacing and it covers most of Egypt. The initial and boundary conditions are derived from National Centre for Environmental Prediction (NCEP) 6 hourly Global Forecast System (GFS) outputs freely available in the Internet at the horizontal resolution of 1° x 1° (http://nomad3.ncep.noaa.gov/ncep_data/index.html) (Figure 1). The model starts its run for 7 days forecast from 00:00 UTC 13 January to 00:00UTC 20 January in January 2008 and 2009. In all these run three different cumulus convective schemes: Betts Miller, Grell 3D Ensemble and Kain Fretch are used and fixing the other physical schemes [11].
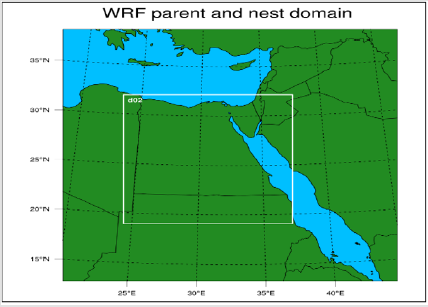
Figure 1: WRF domain setup with the parent domain 1 (larger rectangle) and a nested child domain 2 over Egypt.
Methodology
a) WRF Outputs are used to simulate rainfall over Egypt by using three different cumulus convective schemes (Grell 3D Devenyi ensemble (G3D), Betts Miller Janjic (BMJ) and Kain- Fritsch scheme (KF)) compared with daily – clim data to find the bias for each scheme in each case.
b) The Grid Analysis and Display System (GRADS) software is used to explain the synoptic features lead to occurrence of each extreme case depending on six hourly GDAS data.
c) Satellites images are used to judge against cloud patterns with locations of heavy rainfall in each extreme case of study.
Results
Rainfall Analysis and Bias of the Cumulus Schemes
The intention of this section is to compare reanalysis rainfall with corresponding from WRF model output with different convective schemes Betts Miller (BM), Grell (GR) and Kain Fretch (KF) to detect the best one that better simulate rainfall in each year over area of study for both years 2008 and 2009. Rainfall pattern starts to strike the southern regions through January 16 and 17, 2008 and extends eastward to hit the Red Sea Mountains in January 18 and 19 as shown in Figure 2a. Although the rainfall through January 16 to 18 exceeds 4 mm, it intensifies in January 19 to exceed 24 mm only over small area in the southwest of Egypt. The distribution of rainfall is illustrated in Figures 2b, 2c & 2d where all the used cumulus schemes in this year shows nearly the same pattern for the reanalysis and they are slightly underestimated compared to the daily rainfall analysis with the lowest error due to Grell scheme [12,13].
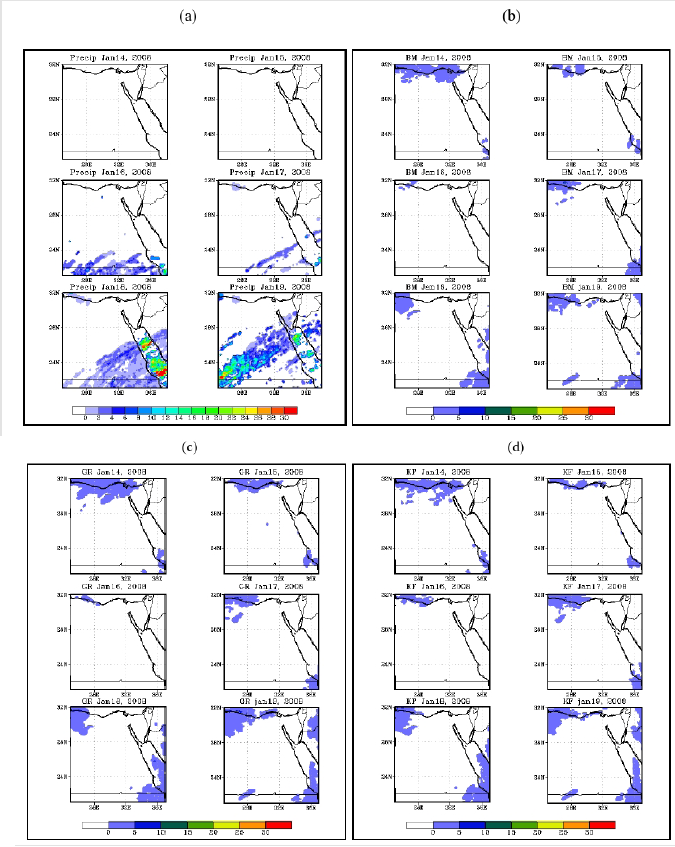
Figure 2: (a) Reanalysis rainfall for January (day14 to day19) in 2008 and its rainfall of WRF schemes (b) Betts Miller- (c) Grell (d) Kain Fretch).
Synoptic Features for January 2008
Daily MSLP analysis from January 14 to January 19, 2008 is illustrated in Figure 3. It is obvious that a weak trough starts in January 14 over the Red Sea and strengthens from day 16 to become stronger in days 18 and 19. This extension is accompanied by warm advection of humid warm air from tropics. Most of vorticity is concentrated over the country in January 17, 18 and 19 with little strong at 700 hPa. The wind is south westerly from 14-19 of January as noticed in Figure 4. Integrated moist flux (1000-500hPa) analysis is noticed in Figure 5 where there is a little amount of moisture flux from day 14 to day 17 while it becomes heavy at the southern areas in days 18 and 19. The upper air wind at 200hPa (Figure 6) shows that, there is coincident between southward extension of subtropical jet and ridge at 500hPa during January 14 and 15. Also northward extension of subtropical jet is nearly coincident with southward extension of trough at 500hPa with rainfall southward of the jet especially in 18 and 19 January.
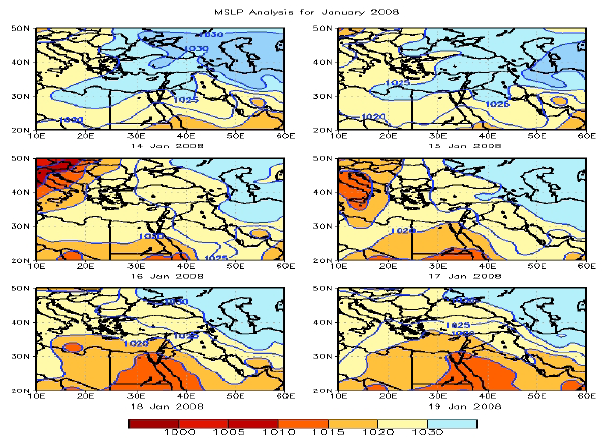
Figure 3: Mean sea level pressure from 14 to 19 January 2008.
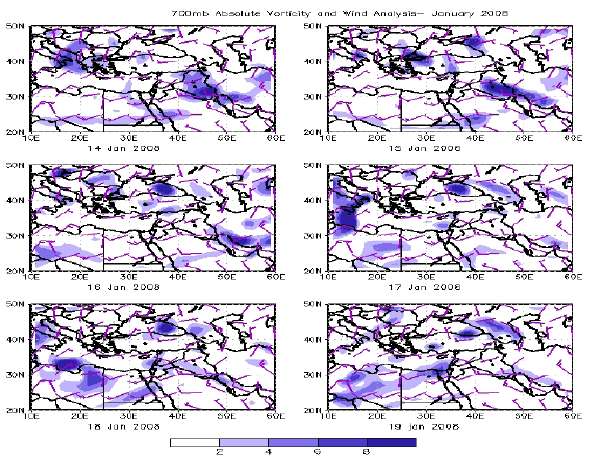
Figure 4: 700hPa absolute vorticity and wind analysis from 14 to 19 January 2008.
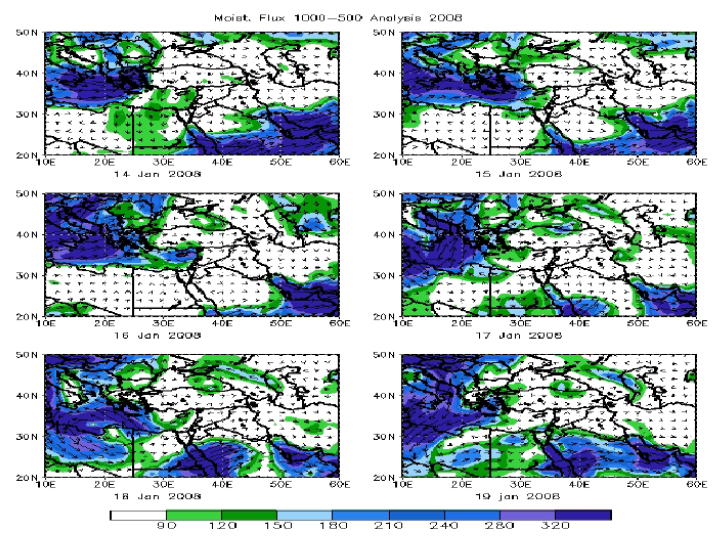
Figure 5: Integrated moisture flux (1000-500hPa) from 14 to 19 January 2008.

Figure 6: 200hPa wind speed and direction from 14 to 19 January 2008.
Visible Images in 2008
It is obvious that very little thick clouds appear over Delta and dark cloud over the Red Sea Mountains in January 14. Dark clouds concentrated over the Red Sea Mountains in January 15. Most of the country is covered with clouds in days 16 and 17 while in January 18 the cloud covers the southern areas and the Red Sea mountains. In January 19 the clouds affect the southern and eastern parts of the country Figure 7. Most cloud cover from satellite images coincide with the reanalysis rainfall distribution during the period from 14 to 19 January 2008. Daily rainfall analysis through January 14- 19, 2009 is obtained from Figure 8a. Heavy rainfall invades south western part which exceeds 10 mm, while moderate rainfall hits the north western part and exceeds 4 mm in January 15. The rainfall decreases gradually in January 16 and moves eastward to exceed 8 mm. In January 17 the rainfall occurs at very small regions at the northeast of Sinai with nearly 2mm. Rainfall analysis for the cumulus schemes is shown in Figures 8b, 8c & 8d, where the pattern of rainfall in January 15 gives slight underestimation rain compared to daily rainfall analysis. In January 16 and 17 the pattern is coincident with the daily rainfall analysis for the used schemes.
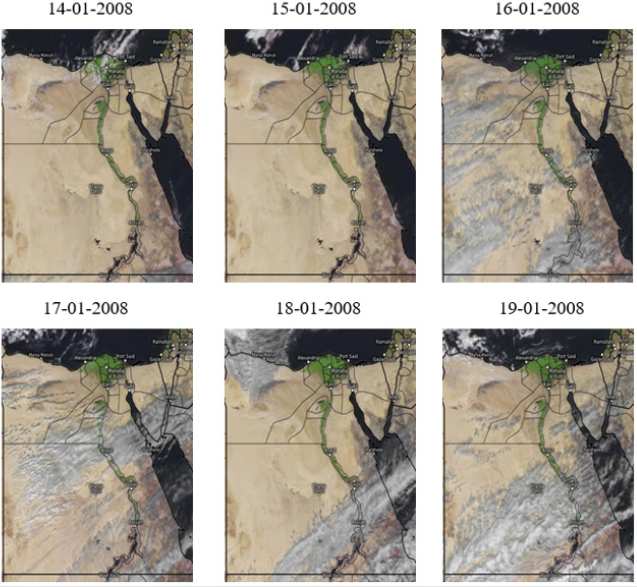
Figure 7: Daily visible satellite images from 14 to 19 January 2008.
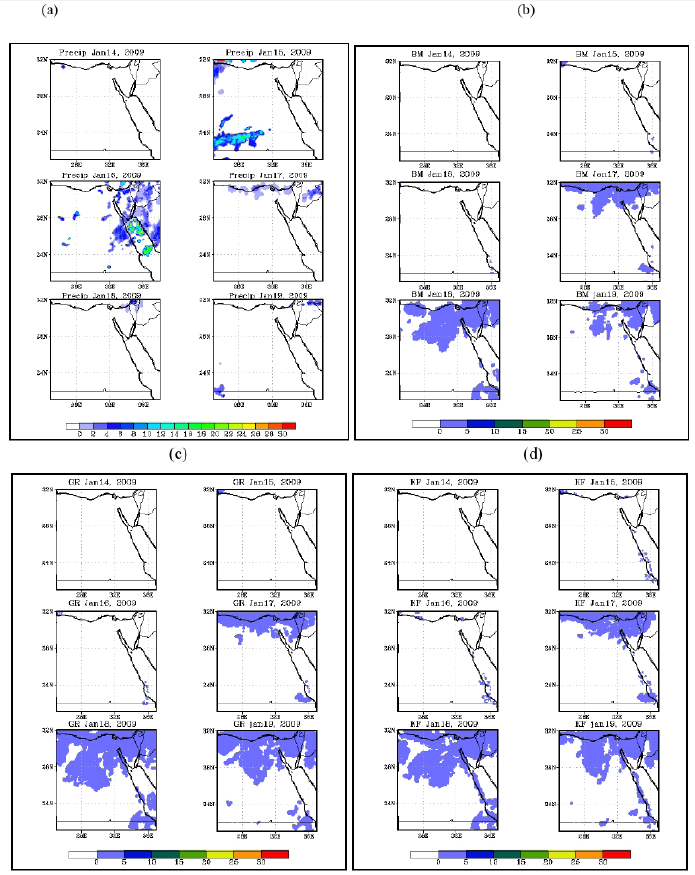
Figure 8: (a) Reanalysis rainfall for January (day14 to day19) in 2009 and its rainfall of WRF schemes (b) Betts Miller (c) Grell (d) Kain Fretch).
Synoptic Features for January 2009
It is clear that Siberian high covers eastern part of Egypt in January 14 and returns eastward in January 15. Extension of Red sea trough invades all Egypt in January 16 and 17. This trough weakens and moves eastward in January 18 and 19 as in Figure 9. 700hPa Absolute Vorticity and wind analysis are illustrated in Figure 10. The vorticity is strong at western parts from January 14 to 17 and then become weak in January 18 and 19 while the wind is mostly north westerly. Integrated moist flux (1000-500hPa) analysis shows that, moisture affects most Libya is accompanied by SW wind from tropical region through January 14 and 15. Westerly wind with strong moisture prevail Mediterranean and north coast of Egypt and Libya during January 16 and 17. Northerly to NW wind transports moisture from Mediterranean and Europe by 18 and 19 January (Figure 11). At 200 hPa the wind is nearly north westerly along the period and nearly strong in days 18 and 19 Figure 12.
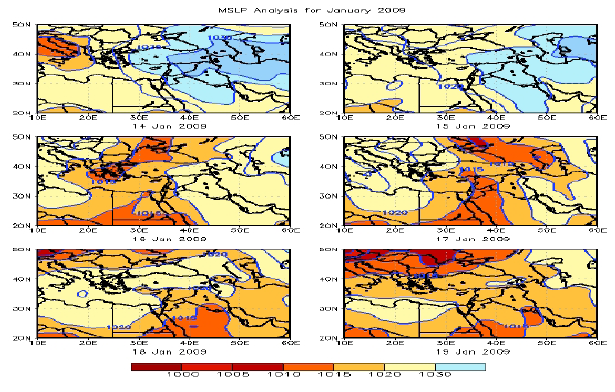
Figure 9: Mean sea level pressure from 14 to 19 January 2009.
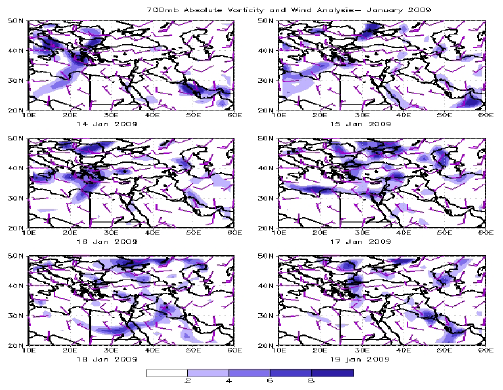
Figure 10: 700hPa absolute vorticity and wind analysis from 14 to 19 January 2009.
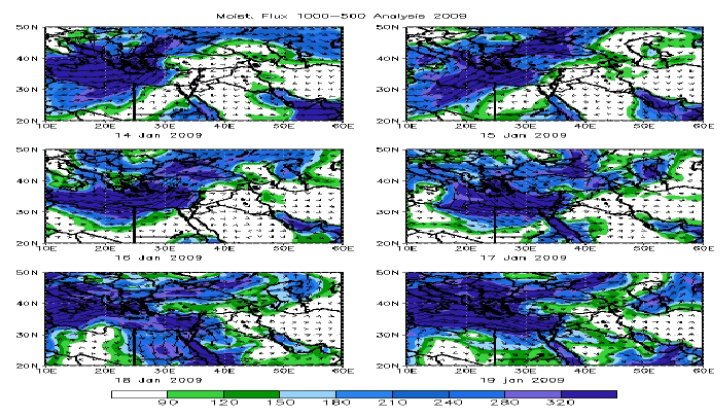
Figure 11: Integrated moisture flux (1000-500hPa) from 14 to 19 January 2009.
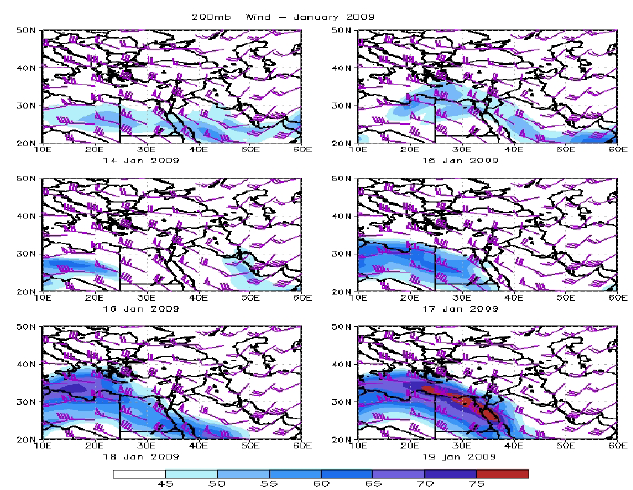
Figure 12: 200hPa wind speed and direction from 14 to 19 January 2009.
Visible Images in 2009
Small batch of clouds invade most Egypt in January 14 while in January 15 they increased to cover most of the western north and western south parts. The clouds become thicker in January 16 which covers almost Egypt as stated in Figure 13, while in January 17 patches of light clouds spread over most of the country with thick clouds covers northern areas of Delta. Little amount of clouds appear in January 18 and 19. The satellite images are nearly matched with the rainfall reanalysis especially in January 15 and 16, 2009.
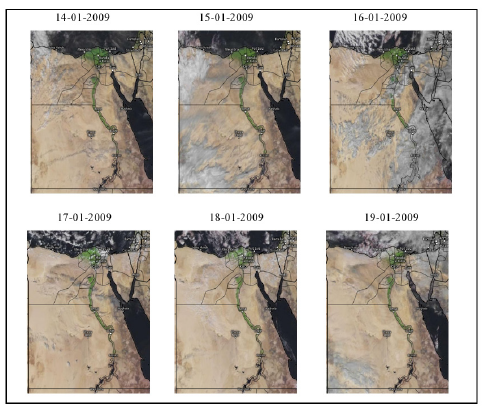
Figure 13: Daily visible satellite images from 14 to 19 January 2009.
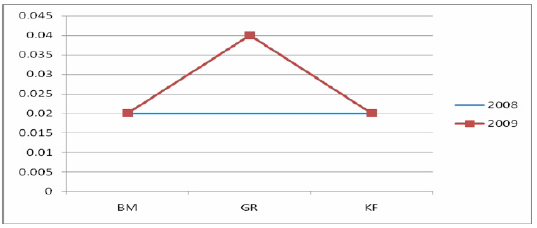
Figure 14: RMSE for the cumulus convective schemes for 2008 and 2009.
Summary and Conclusion
Heavy rainfall due to thunderstorms is one of the important weather phenomena that lead to flash floods affects not only northern and eastern parts of Egypt but also arid and semi-arid areas such as Upper Egypt and Sinai Peninsula in winter, autumn and spring seasons. Many of these heavy rainfall events occurred during January over Egypt which caused an infrastructure damages and losses of life. The study concerns on rainfall along January days 2008 and 2009. This study is divided into three parts as:
a) The main part of the study is to run WRF model with three different cumulus convective schemes to simulate rainfall from 14 to 19 January in each year. The model run is based on two nest domains with horizontal resolution 27Km for first domain and 9 Km for second domain. Reanalysis rainfall data is compared with WRF outputs to demonstrate the best scheme among three convective schemes that simulates rainfall better than other two schemes. It is concluded that all schemes give the lowest RMSE and simulates rainfall better in 2008 while in 2009 Betts Miller and Kain Fretch give the lowest RMSE Figure 14. Synoptic study for extreme heavy rainfall cases showed that most heavy rainfall events occurred due to interaction between tropical surface Red Sea trough and 500 hPa midlatitude trough associated with severe atmospheric instability and thunderstorm activities that appears from upper air wind at 200 hpa. Satellite images for the severe cases are used to ensure the accuracy of reanalysis rainfall data.
Acknowledgement
It gives me pleasure to take the opportunity to thank those who made it possible for me to complete this thesis. Foremost, I would like to show my deepest gratitude to my parents. I want to thank my supervisors and my colleagues for their generous help and support to develop my knowledge and experience in this work.
References
- Maged M Hussein A, Ebtisam E Mohamed E (2016) Temperature Trend over Nile Delta, Egypt in 20th Century, Advances in Research 7(2): 1-14.
- Abdel Kader AM, Abdel Rassoul SM (2010): Prospects of Water Conservation In: Egypt (Special Reference to Wastewater Reuse). Fourteenth International Water Technology Conference. Cairo, Egypt pp. 519-526.
- Abdel Shafy HI, Aly RO (2002) Water issue in Egypt: resources, pollution and protection endeavours. Central European J of Medicine 8(1): 3-21.
- Moawad BM, Ahmed OAA, Buhalqem M (2016) Flash floods in the Sahara: A case study for the 28 January 2013 flood in Qena, Egypt Geomatics. Natural Hazards and Risk 7(1): 215-236.
- Medina S, Houze RA, Kumar A, Niyogi D (2010) Summer monsoon convection in the Himalayan region: Terrain and land cover effects. Q J Roy Meteorol Soc 136: 593-616.
- Ahasan M, Rayhun K, Mannan M, Debsarma S (2013) Synoptic Analysis of a Heavy Rainfall Event Over Southeast Region of Bangladesh Using WRF Model. Journal of Scientific Research 5(3): 421-434.
- Kumar A, Dudhia J, Bhowmik S (2010) Evaluation of Physics options of the Weather Research and Forecasting (WRF) Model to simulate high impact heavy rainfall events over Indian Monsoon region. Geofizika, 27(2): 101-125.
- Kain JS, Fritsch JM (1990) A one-dimensional entraining/detraining plume model and its application in convective parameterization. Journal of the Atmospheric Sciences 47(23): 2784-2802.
- Janjic ZI (1994) The step-mountain eta coordinate model: Further developments of the convection, viscous sublayer, and turbulence closure schemes. Monthly Weather Review 122(5): 927-945.
- Grell GA, Dévényi D (2002) A generalized approach to parameterizing convection combining ensemble and data assimilation techniques. Geoph. Research Lett 29(14): 38-1-38-4.
- Bukovsky MS, Karoly DJ (2009) Precipitation Simulations Using WRF as a Nested Regional Climate Model. Journal of applied meteorology and climatology 48: 2152-2159.
- Domroes M, Tantawi A (2005) Recent temporal and spatial temperature changes in Egypt. International Journal of Climatology 25: 51-63.
- Enviromental Science Services Administration 1951-1960: World Weather Records. Environmental Science Services Administration, Washington D.C.
