 Research Article
Abstract
Background: Globally the prevalence of Metabolic Syndrome (MetS) is high and
may reach a frightening level in the nearest future given the current trends of rising
prevalence of hypertension and obesity. The presence of metabolic syndrome is linked
with increased risk of cardiovascular disease, diabetes and all-cause mortality. Despite
the recent proliferation of models and scores for assessing the risk of developing MetS,
there is hardly any used in practical setting. Hence, we conducted a systematic review to
determine the performance of risk models and scores for predicting metabolic syndrome.
Methods: We systematically searched MEDLINE, CINAHL, PUBMED and Web
of Science to identify studies that either derive or validate risk prediction models or
scores for predicting the risk of metabolic syndrome. Data concerning models’ statistical
properties as well as details of internal or external validations were extracted. Tables
were used to compare various components of models and statistical properties. Finally,
PROBAST was used to assess the methodological quality (risk of bias) of included studies.
Result: A total of 15102 titles were scanned, 29 full papers were analyzed in detail
and 24 papers were included. The studies reported about the development, validation
or both of 40 MetS risk models; out of these, 24 models were studied in detail. There is
significant heterogeneity between studies in terms of geography/demographics, data
type and methodological approach. Therefore, this precludes a formal meta-analysis.
Majority of the models or risk scores were developed or validated using data from crosssectional
studies, or routine data that were often assembled for other reasons. Various
combinations of risk factors (predictors) were considered significant in the respective
final model. The number of predictors utilised in a single risk score ranged from 2 to 11
(mean 5.6, SD 1.95). Similarly, different criteria were used in the diagnosis of MetS, but,
NCEP criteria including its modified versions were by far the most widely used (32.5%).
There is generally poor reporting quality across the studies, especially concerning
statistical data. Any form of internal validation is either not conducted, or not reported in
nearly a fifth of the studies. Only two (2) risk models or scores were externally validated.
Conclusion: There is an abundance of MetS models in the literature. But their
usefulness is doubtful, due to limitations in methodology, poor reporting and lack of
external validation and impact studies. Therefore, researchers in the future should focus
more on externally validating/ applying such models in a different setting.
Introduction
The prevalence of Metabolic Syndrome (MetS) has increased significantly over the last three decades [1]. In 2015, the International Diabetic Federation (IDF) suggested that approximately a quarter of the global adult population (>20 years) are having MetS [1].This figure is disturbing, especially because individuals with MetS have increased risk of Cardiovascular diseases (CVD) (2 to 3-fold) [2], and type 2 diabetes (T2DM) (up to 5-fold) [3]. Additionally, the number of those with the syndrome may likely reach a frightening level in the nearest future given the current worldwide trends of rising prevalence of hypertension, obesity and diabetes [1,4]. Therefore, it is necessary to adopt effective preventive strategies and work in a systematic way to reduce the rising burden of morbidity and mortality related to MetS.
However, studies of MetS are often challenging and problematic. First, there is lack of a universally acceptable definition of MetS. Although the various proposed definitions utilized same metabolic risk factors in defining the cluster of risk factors, they vary regarding the cut-off point of the individual components, the weight assigned to certain components, or even the pathophysiological reasoning behind the clustering [5]. This lack of definition that is generally acceptable makes comparison between studies difficult. Second, the exact mechanism that brings about MetS remains unclear despite advances in pathophysiology and risk factor identification. Certainly, the widely observed difference in terms of susceptibility and age of onset is highly suggestive of a major interplay between genetic and environmental factors [6]. However, the main aim of developing the concept of MetS is not describing or identifying the biologic basis of the constellation, but rather, to identify individuals with increased risk of CVD and T2DM. Actually, the term ‘syndrome’ is used to demonstrate the fact that there are numerous possible pathophysiological mechanisms that can explain the clustering of risk factors.
Risk prediction models are of great significance in supporting decision making both in clinical and public health practice, and are increasingly being incorporated in guidelines [7,8]. For instance, in cardiovascular disease (where the application of models is more advanced), several prediction models have been developed and are currently in use, e.g. QRISK (qrisk.org), the Framingham risk score (framinghamheartstudy.org), Assign score (assign- score.com) etc. Furthermore, prediction modelling is becoming more popular in chronic disease research due to the increase in availability of large datasets, advanced statistical methods and computational power [8,9]. This may have a crucial role to play in informing how the rising burden of MetS on public health can be reduced. However, researchers that either develop or validate multivariable prediction models face several challenges. Indeed, regardless of disease area or discipline, these challenges include poor reporting of prediction model studies, use of inappropriate statistical techniques, small sample, poor handling of missing values and absence of validation [10-15]. These methodological deficiencies result in models that currently are not or should not be utilised. For that reason, it is not surprising that, relative to the large number of models published, only a few are extensively implemented or utilised in real life settings [16].
In recent years, there is proliferation of models and scores for assessing the risk of developing MetS, however, to the best of our knowledge, none is in routine use either in clinical or in public health setting, and there is no available systematic review in the academic literature. This we believe may present a confusing picture for both GPs, public health specialists and policymakers, who would be potentially faced with very complex literature, multiple different methodologies, and probably very few studies of use in real life. We conducted a systematic review to determine the performance of risk models and scores for predicting metabolic syndrome.
Methods
Aim
This review aims to determine the performance of risk models and scores for predicting metabolic syndrome.
Objectives
a) To systematically review known metabolic syndrome risk models and scores.
b) To analyse the demography of the populations from which the models and scores were derived and/or validated.
c) To analyse the final components of the models and scores and their contribution to overall risk.
d) This review follows standard methodology for systematic reviews reported in a previous study as well as in the York Centre for Reviews and Dissemination guidelines [17,18].
Search Strategy
Mixed search strategy involving both electronic and manual databases [19,20] was adopted in this study. The search strategy was designed with the help of IHR specialist librarian (DA), and relevant guidance was drawn from “Systematic Reviews: Centre for Reviews and Dissemination guidance for undertaking reviews in health care”, and “Systematic Reviews to Support Evidence-Based Medicine” [17,18] to identify any relevant studies of metabolic syndrome risk models and scores. The final search strategy was implemented by MI and was double-checked by DP, GR and YP. The final search was conducted on 21 September 2018.
The literature was searched using keywords which includes predict, screen, risk, score, metabolic syndrome, insulin resistance syndrome, model, regression, risk assessment, risk factor, calculator, analysis, sensitivity and specificity, ROC and odds ratio. Both MESH terms and text words were used. Articles were searched using titles and abstracts, the search was limited to studies conducted in English language, but no date restriction was applied. The details of the search strategies used can be found in supplementary material 1.0. The literature search was conducted in databases such as MEDLINE, CINAHL, Web of Science and PUBMED.
Eligibility Criteria
We included peer-reviewed studies that either combine two or more known risk factors to derive a metabolic syndrome risk model or score or validated a pre-existing model on a different population or conducted both. Furthermore, the main outcome of this review is metabolic syndrome, and the secondary outcomes are any related predictive outcomes (discrimination and calibration inclusive). Finally, this review only includes studies published in English. We excluded studies on screening and early detection, genetic mutation models, conducted on animals, investigating one or more single risk factors which are not connected to build a model or score, studies that applied other disease model or score to predict MetS. Also, studies whose main outcome is not metabolic syndrome, studies that did not report any related predictive outcomes (either discrimination or calibration). Finally, studies conducted in languages other than English.
Selection of Studies
A total of 16821 titles were transferred into the electronic reference software Endnote version 8 (endnote.com), and duplicates were removed automatically, resulting in a total of 15222 titles. The duplicate titles that were not removed automatically by endnote were removed manually, resulting in 15102 titles.The entire 15102 titles were scanned by MI, and if the title was suspected to represent a paper that met the inclusion/ exclusion criteria, the entire abstract was reviewed.Title scanning and abstract review was completed in November 2018. A total of 66 titles were marked as potentially meeting the inclusion criteria. Out of these, ten (10) titles were double-checked by DP.
The full paper review was conducted by applying the inclusion/ exclusion criteria to the retrieved articles. At this stage, studies were excluded because of the following: predicting genetics (1), investigating one or more single risk factors which are not connected to build a model or score (20), used unconventional predictors (alternative medicine) (1), applied other disease model or score to predict MetS (CVD, T2DM) (4) main outcome is not metabolic syndrome (8) did not report any related predictive outcomes (either discrimination or calibration) (7) conducted in languages other than English (2). This reduced the number of full papers to 23. Full papers from other sources. In order to identify more relevant articles, a manual search of the reference lists of all the selected articles was conducted. Furthermore, relevant “grey literature” was searched for in the following: The Grey Literature Report (www.greylit.org/), OpenGrey (www.opengrey.eu/) and OAISTER (www.oaister.org/). From the above, three further papers were added from the initial scoping search, and three from the reference lists of the included papers. However, the search for the grey literature yielded no result. This makes the total number of articles selected for data extraction to 29. The selection process is summarized using the PRISMA flow diagram (PRISMA 2009) (Figure 1).
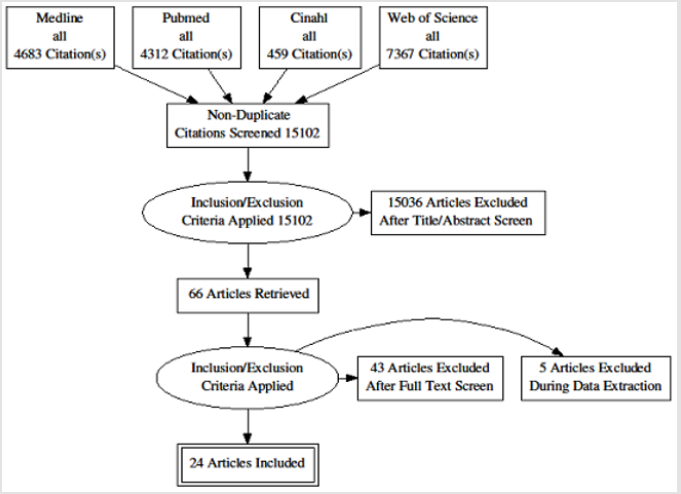
Figure 1: Prisma flow diagram describing the selection of studies.
Data Extraction
Data extraction was conducted using a standard form adopted from a similar study [21] and saved in Microsoft Excel 2016. The extracted data were on those variables relevant to the review question and which satisfied the conditions for the narrative synthesis conducted. It is noteworthy that, some of the studies presented several models with each model composed of different risk factors. However, it is beyond the capacity of this researcher to study in details each of those models. Furthermore, the researchers themselves often conclude that one of their reported models is obviously better than the others in terms of performance. Therefore, where this is the case, data from the authors’ preferred model(s) or (if no clear preference was stated in the article), the one judged to be more detailed or robust statistically was extracted. During the data extraction, a total of five studies were excluded, leaving 24 articles. The primary data extraction was conducted by MI and double-checked by DP, GR and YP and discrepancies were resolved by discussions.
Assessment of Methodological Quality
The PROBAST (Prediction study Risk of Bias Assessment Tool) [11], a tool for assessing the risk of bias and applicability of prognostic model studies, was used to assess the quality (risk of bias and applicability) of included studies. Briefly, the PROBAST is a tool recently developed to assess the quality of primary studies included in a systematic review. It evaluates both risk of bias and issues concerning applicability of studies that develop, validate or update a multivariable model (both diagnostic and prognostic). Furthermore, PROBAST comprises of 4 domains covering 20 signalling questions to enable risk of bias assessment and applicability. These domains are concerned about participants such as (the study design used, whether appropriate inclusion/ exclusion criteria were used), the predictors used, outcome, and how the analysis was conducted. Aside from its specific purpose of appraising studies in systematic reviews of prediction models, PROBAST can also be utilised in the general critical appraisal of primary prediction model studies. Noteworthy, PROBAST is not meant for generating summary “quality score” due to the documented drawbacks related to such scores [22]. Therefore, the effect of problems observed within each domain should be discussed by users [21]. Table 1 above provided a summary of the quality assessment of the included studies.

Table 1: Quality assessment of the included studies based on PROBAST.
Note: *ROB: Risk of Bias. (+) shows low ROB/low concern regarding applicability; (-) shows high ROB/ high concern regarding applicability; and (?) shows unclear ROB/ unclear concern regarding applicability.
In summary, the quality assessment revealed that in the entire included studies there is moderate-to-high risk of bias, primarily due to the use of inappropriate study design and absence of external validation. Further look at the studies, it was observed that majority of the models suffered a high risk of bias and significant methodological deficiencies arising from poor choice of model analyses, significantly underpowered analyses, dichotomisation of continuous variables, lack of adjustment for optimisation, poor handling of missing data and overall poor model presentation.
Prioritising/ Ranking Models or Risk Scores
The number of papers and risk models or scores included in the final sample of this review is relatively high. Therefore, for clarity, it was decided to highlight the risk models or scores with the most potential to be useful to end users, i.e. practitioners, policymakers or laypersons. Furthermore, for any prediction model or risk score to be considered useful, it should be accurate (statistically significant calibration, and discrimination above 0.70), generalisable (externally validated by a separate research team on a different population) and usable (has few components that are commonly used in practical setting) [23]. However, MetS prediction discipline is arguably still in its early phase of development; therefore, it is difficult to identify any model or score that fulfils all of the above criteria. Hence, to prioritise risk models or scores in this study, we developed pragmatic criteria by modifying the criteria set by Altman et al. [23]. A similar approach was used by Nobel et al. [20]. Studies were favoured if they used prospective/cohort data to develop their model, they reported discrimination above 0.70 and or calibration, and has few components that are commonly used in a practical setting. The three prioritised risk models or scores are summarised in an easily accessible table (Table 2).

Table 2: Components of three MetS risk models or scores with potential for adaption for use in routine practice.
Note: BP: Blood Pressure; HDL: High Density Cholesterol; WC: Waist Circumference, TG/TAG= Triglyceride; FBG: Fasting Blood Glucose
Result
A total of 29 full papers were analysed in detail after which a final sample of 24 papers was produced. Of these 24 papers, 22 report about the development of one or more risk model or score [24-47], and 2 studies report about the development and external validation of one or more risk model or scores on an external population [36,39]. Overall, the 24 studies reported 40 models, out of which 24 models were selected for full data extraction. The rest (16 models) were not selected, either because they were judged to be minimally different from the reported ones or they were not the preferred models by the authors, or they were significantly deficient in details or statistical reporting. Furthermore, publication dates of the included studies ranged from 2008 to 2018 with the majority appearing within the past 3 to 4 years (Figure 2). Table 3 provides the detail characteristics of the included studies. In summary, there is high heterogeneity in the studies. Studies were conducted in 16 countries across 6 continents (10 in Asia, 4 in North America, 4 in Europe, 4 in the Middle East, 1 in South America, 1 in Australia), but none from Africa. Similarly, due to the heterogeneity of data, difference in methodological approach and presentations, it is challenging to make comparisons across studies.
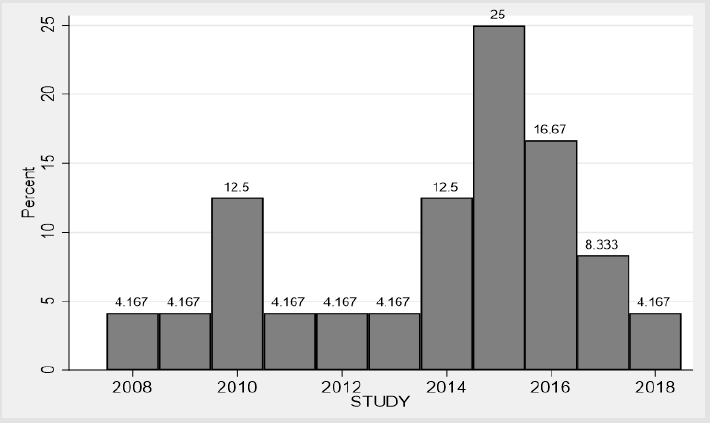
Figure 2: Publication of MetS risk models and scores 2008 to 2018.
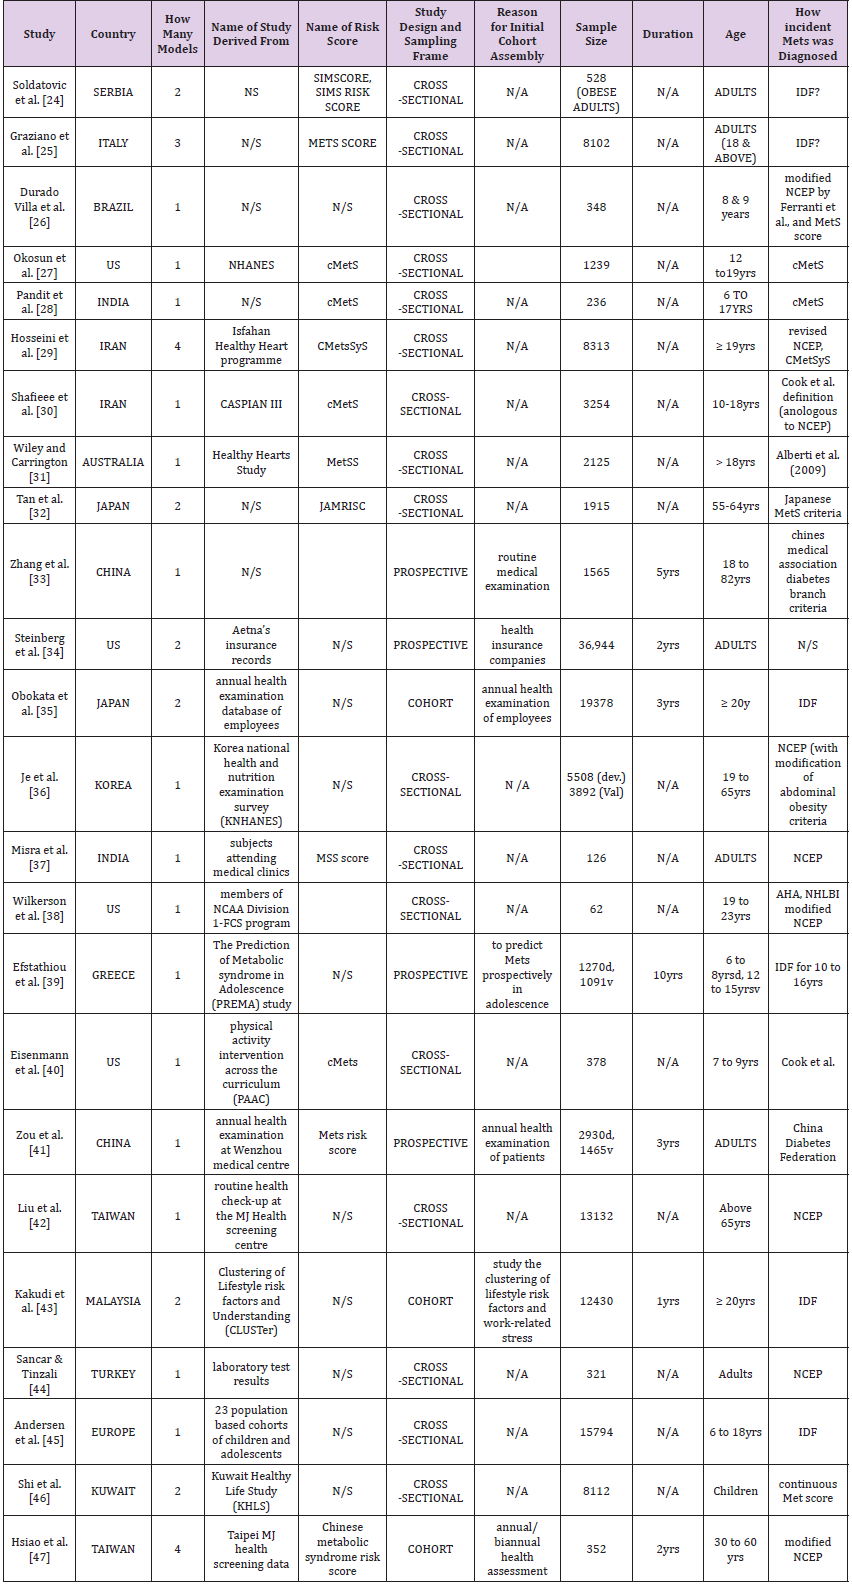
Table 3: Summary of 24 papers from which 40 MetS risk models or scores were identified for systematic review.
Note: *N/S: Not stated; N/A: Not Applicable; IDF: International Diabetic Federation; NCEP: National Cholesterol Education Panel; cMetS: Continuous Metabolic Syndrome Score; MetSS= Metabolic Syndrome Score; JAMRISK: Japanese Metabolic Risk Score.
In terms of study design, majority (seventy per cent) of the models or risk scores were developed or validated using data from cross-sectional studies, or routine data that were often assembled for other reasons. Again, of the remaining thirty per cent that reported using cohort data [33-35,41,43,47], none of those cohorts was prospectively assembled to develop a MetS risk model. The study population also varies across the studies. Study sample range in size from 62 to 36944 participants. Overall, risk models were tested on 150,810 individuals. Regarding the age of the sample, more risk scores were reported in adults than in children or adolescent. Of the 24 included models, 15 risk models were focused on adult subjects [24,25,29,31-38,41-44,47], while 8 targets children and adolescents [26-28,30,39,40,45,46].
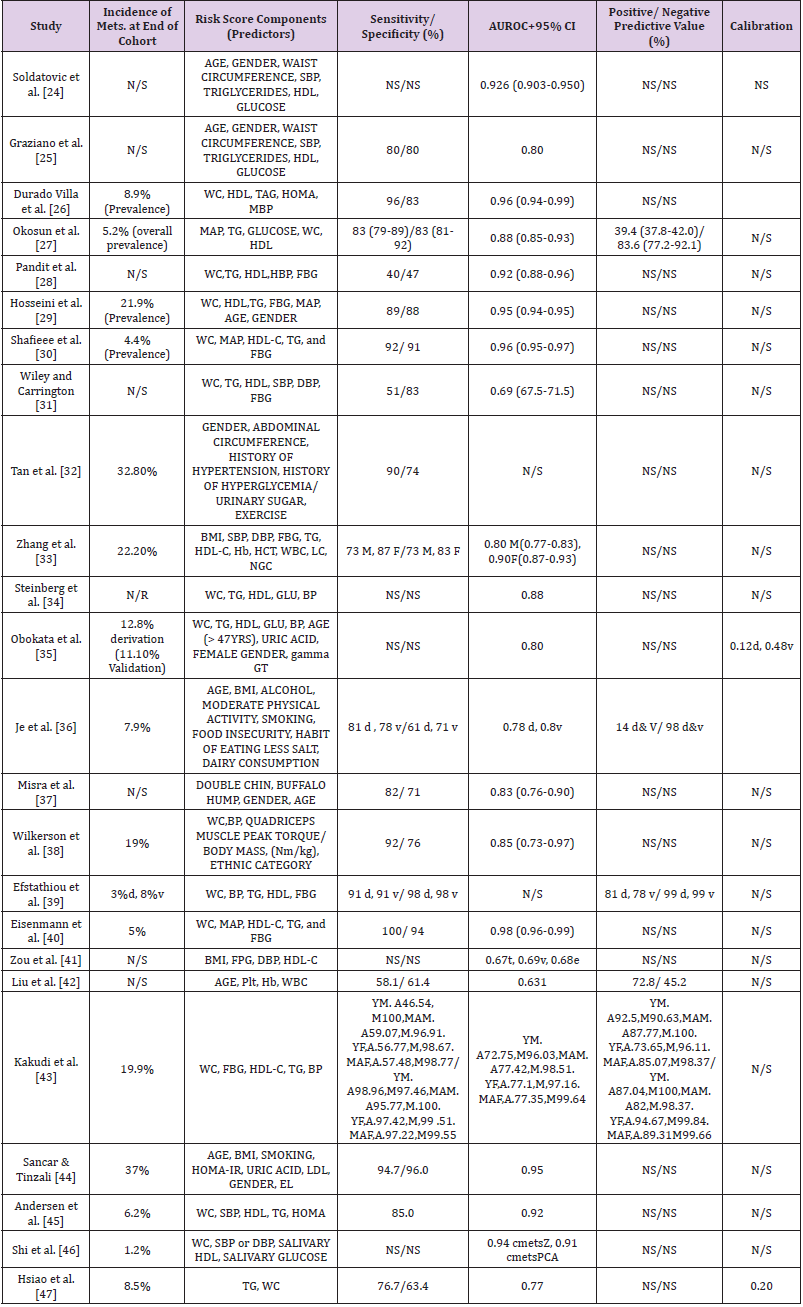
Table 4: Key characteristics of metabolic syndrome risk models or scores included in the systematic review.
Note: *N/S: Not stated; SBP: Systolic Blood Pressure; DBP: Diastolic Blood Pressure; HDL: High Density Cholesterol; d: Derivation; v: Validation; WC: Waist Circumference; TG/TAG: Triglyceride; MAP/MBP: Mean Arterial Blood Pressure; Hb: Haemoglobin; HCT: Haematocrit; WBC: White Blood Cell; LC: Leucocyte Count; Plt: Platelet
Table 4 shows the details of the components of the included 24 risk models or scores as well as their statistical properties – which includes (where available) their “sensitivity, specificity, discrimination, calibration, positive and negative predictive values, AUROC”. Furthermore, additional complex statistical analyses were employed in some of the studies leading to a lack of consistency in terms of the statistical approach. Consequently, a formal metaanalysis was precluded due to the heterogeneity of data particularly regarding the diverse demographics of the studied participants and different components of the scores.
Surprisingly, the observed incidence/prevalence of MetS at the end of the study is not reported in nearly a third (twenty-nine per cent) of the studies [24,28,31,37,41,42]. For those that reported it, the prevalence/ incidence of MetS ranged from as little as one per cent to as high as thirty-seven per cent (median is thirteen per cent). As expected, lower prevalence/ incidence was observed in children studies, and the higher rates were observed from those studies with adult participants. In all the 24 included risk scores, various combinations of risk factors (predictors) were considered significant in the respective final model. Again, different weights were assigned to different components in the various models. The number of predictors utilised in a single risk score ranged from 2 to 11 (mean 5.6, SD 1.95). Similarly, different criteria were used in the diagnosis of MetS, including IDF, NCEP, and CmetS. But, NCEP including its modified versions were by far the most widely used criteria (32.5%).
There is generally poor reporting quality across the studies, especially concerning statistical data. For instance, calibration (of any statistic form) was reported by only three out of the twentyfour studies [35,36,47]. Similarly, one-fifth of studies did not report sensitivity/specificity; two-third did not report positive and negative predictive values. Similarly, Area Under Receiver Operating Curve (AUROC) ranged from 63.0 to 97.8. One study did not report any AUROC. Regarding the validity of the risk models or scores, any form of internal validation is either not conducted, or not reported in nearly a fifth of the studies. The commonest technique of internal validation used by those studies is ROC analyses (eighteen studies). Similarly, only two (2) risk models or scores were externally validated. More so, all the external validations were done by the same authors and, reported in the same paper (with corresponding model development).
Studies differ in terms of the biomarkers they used to capture certain assumption in MetS. For example, as a measure of body fat composition (obesity), 18 studies used waist circumference to denote obesity while 4 studies used BMI, and 2 studies did not use either (any). Similarly, fasting blood glucose (FBG) is the most popular marker of body glucose used. 14 studies utilised FBG, 3 studies used HOMA-IR, one study used salivary glucose and 6 studies used no biomarker of body sugar at all. In addition to the traditional biomarkers/ predictors of MetS (i.e. abdominal obesity, blood pressure, blood glucose, triglyceride and HDL-cholesterol), some studies employed other (novel) biomarkers, such as salivary biomarkers (as against blood biomarkers) [46], phenotypic biomarkers (double chin, buffalo hump) [37],Quadriceps muscle peak torque/body mass, (Nm/kg) [38], and lifestyle factors (alcohol, moderate physical activity, smoking, food insecurity, habit of eating less salt, dairy consumption) [36]. Reporting the model equation can add to the reporting quality and replicability of the study. However, the final model equation was reported in only 15 studies. Also, one study reported having an online risk calculator, and another one developed a nomogram.
Discussion
This systematic review revealed that there are numerous MetS prediction models or scores in the literature. This finding is similar to what is seen in other chronic diseases such as CVD [15,48,49] and T2DM [13,14,20]. There is some level of variability/ diversity regarding the geographical location (origin) of the models in this review. Indeed, no less than a single model has been developed in almost all continents of the world except Africa. With nearly seventy-five per cent of all chronic disease-mortality occurring in middle and low-income countries (African countries inclusive) [50], this finding calls for serious action by researchers from the continent. Having MetS models from those countries is necessary because it is a known fact that in risk prediction models there are significant variations in predictor-outcome association in different ethnicities [13,51].
Poor conduct and reporting of prediction model studies is a common finding reported across most similar reviews [13-15, 20,48,49], and often, this leads to missing of vital information. This finding is also observed in most of the studies included in this review. The lack of standardised guideline both for conduct and reporting of prediction model studies is believed to be largely responsible for this occurrence [10]. However, with tools such as TRIPOD [10]and PROBAST [11] being developed and validated, the situation is likely to change in the nearest future. Assessing the overall performance of prediction models is necessary before translating research findings into the real-world setting [52]. However, model performance can be affected in several ways. One of these ways is how continuous variables are handled; are they retained as continuous measures or are they categorised into two or more categories [53]. Often, variables are dichotomised by either using the median value or by choosing an optimal cut-off point (based on the minimum P-value). The practice of treating continuous risk predictors as categorical should be avoided, irrespective of the approach used [53].
Unfortunately, this is frequently observed in risk prediction model studies [12,54-56]. In this review, categorisation of some, or all variables was conducted in (65%) of the studies. This finding is in keeping with what is reported previously in similar reviews [13,15,49]. By dichotomising continuous variables, there is risk of serious loss of information and statistical power to observe real associations. This effect is comparable to losing a third of the overall data or even more if the data are distributed exponentially [57]. Therefore, it is recommended that while developing a model, continuous risk variables (predictors) should be retained as continuous variables, or rather, splines or fractional polynomial functions should be used if the relationship between the predictor and the outcome is nonlinear [58]. Another way that the performance of models is affected is through missing values. Missing values are a common occurrence in most datasets. In fact, collecting all data on all risk predictors for all individuals is a difficult task that is rarely achieved, no matter the study design used [13]. Researchers are then faced with the challenge of dealing with the missing values (especially if the study is based on a retrospective cohort data).
One of the common methods employed in this regard is complete case analysis, after completely excluding participants with missing data on any of the variables of interest [59]. However, this approach is not recommended as it does not only discard useful information; it also leads to biased results and conclusions [23]. Nearly half of the studies in this review failed to report information regarding how they treated missing values. This finding is in keeping with other similar reviews [12,13,15,54]. One of the potent ways of minimising the effect of missing values is the use of multiple imputation technique. But this is rarely conducted in studies of prediction models or scores [60]. Therefore, researchers should always report the completeness of the overall data and how the missing values are dealt with so that the representativeness and quality of the data can be judged by readers. Again, there is a lack of consistency in studies of MetS prediction as they used different predictors and statistical methods. To the very least, discrimination and calibration measures are recommended to be reported [61]. Although nearly all studies reported some form of discrimination, however, calibration is rarely reported.
In this review, only two studies reported any form of calibration measure. This is similar to other relevant reviews [20]. This makes it difficult to make comparison across studies, e.g. metaanalysis and to assess the generalizability of the studies [62]. Furthermore, majority of the studies used common biomarkers (blood pressure, fasting blood sugar, cholesterol, triglycerides and waist circumference) as predictors in building their models. In addition to these, however, other novel predictors /biomarkers have been used once or twice by some researchers. However, none of the models that reported using novel biomarkers has been used elsewhere or externally validated. A similar observation is made in CVD models studies [15]. This shows that researchers in the field give more significance to the process of identifying new predictors and new model building as against validating and applying existing ones. Regarding the definition/ criteria of MetS, there is significant heterogeneity amongst the studies. But, the NCEP criteria [63] or its modified versions are the most commonly used. This further makes it difficult to compare between studies because different definitions of outcome result in difference in predictor effect and resultant model performance [15]. Having a more uniform definition/ criteria would help significantly in mitigating the above (thereby making it easy to compare between studies and eventually translate research findings into clinical setting) [10].
When it comes to multivariable model-building strategies, the commonest used to derive the final model or risk score is automated selection (either forward selection, backward elimination or stepwise) (52% in this review). However, the automated selection strategy is data dependent (rely on statistical significance without reference to clinical significance. Additionally, this strategy often produces models that are unstable, with estimates that are biased and ultimately leading to poor predictions [64,65]. Furthermore, most of the studies included in this review described developing MetS prediction models, but, the external validation of such models is seriously lacking. Certainly, the ultimate aim of any multivariable model study is to show that the model in question works [13]. It is, therefore; of paramount importance that the model performance is assessed once it is developed. Generally, model performance can be assessed in two broad ways (internal validation and external validation) [66]. The internal validation is done using such techniques as (in increasing order of evidence): “split sample (in large cohorts), cross-validation, and resampling (bootstrapping technique)”.
On the other hand, external validation involves applying the prediction model on a new sample that is entirely different from the developing one [62]. Only two models in this review were externally validated. Lack of external validations is a common problem of most prediction model studies [12,13,15,54]. Head-tohead comparison of models assists in knowing which models are better in terms of performance. In this review, no such comparative study is observed. This makes it difficult to choose, or advocate amongst the existing studies. Comparative studies (preferably of multiple models in a single study) are recommended in prognostic risk prediction models [15]. However, as significant as the statistical characteristics of a prediction model may be, they do not guarantee its usefulness in a clinical/ real-life setting. None of the models in this review is reported to have been applied in clinical setting. Therefore, in the future, more emphasis should be given on impact studies- applying the models in clinical setting and assessing their ability to influence decision making or patients’ outcome.
What Is Already Known on The Topic
a) The findings of this review are in keeping with earlier published reviews of risk prediction models or scores in CVD, diabetes, cancer and stroke.
b) Numerous MetS prediction models or scores exist in the literature
c) No detailed review has described how these models, or scores were developed, their predictive performance and how many were validated (externally).
What This Study Adds
a) Though there are many MetS prediction models or scores, only a few have been externally validated.
b) Poor reporting was observed in all aspects of risk prediction models development, specifically, in terms of data description and sufficient detail in all steps taken in building the model.
c) This makes them of doubtful value to potential users (practitioners, policy makers and guideline developers).
Strengths
a) The strengths of the systematic review include:
b) This review consists of models or scores that are geographically diverse (across different countries and continents). This is likely to give a broader picture of MetS risk prediction because it has been shown that models performances are affected by race/ethnicity.
c) A comprehensive literature search was conducted (covering multiple sources, with many keywords). Also, studies were carefully selected, and extensive data extraction on relevant significant characteristics of MetS prediction models was done.
d) The review used standard methods that apply to reviews of any risk models and scores.
Limitations
This review was limited to articles published in English; therefore, some significant additional findings might be missed. Notwithstanding, it is strongly suspected that none of the study findings would be altered by adding more articles. Furthermore, large numbers of titles and abstracts were screened at the initial stages of the review due to lack of a sensitive literature search strategy. Finally, due to significant heterogeneity between the included studies, detailed quantitative analysis and formal metaanalysis could not be performed.
Conclusion
This systematic review of 24 published studies highlights numerous methodological deficiencies and a generally poor level of reporting in studies in which risk prediction models were developed for the detection of MetS. Furthermore, there is an abundance of MetS models in the literature. But their usefulness is doubtful, due to limitations in methodology, poor reporting and lack of external validation and impact studies. Therefore, researchers in the future should focus more on externally validating/ applying such models in a different setting.
Declarations
Ethics approval and consent to participate: The ethics approval for this study was provided by the Institute for Health Research Ethics committee, University of Bedfordshire.
Consent for Publication
Not applicable.
Availability of Data and Materials
Not applicable.
Competing Interest
The authors declare that they have no competing interests.
Funding
This research received no specific grant from any funding agency in the public, commercial or not-for-profit sectors.
Authors’ Contributions
MSI conceptualised the review, co-developed the search strategy and ran the search, scanned all titles and abstracts, extracted quantitative data, conducted the quality appraisal and wrote the paper. He is also the guarantor for the paper. DP assisted with double-checking the search strategy, studies selection, data extraction and quality appraisal. YP double-checked the search strategy, data extraction, read and revise drafts of the paper, and approved the final manuscript. GR checked the search strategy, data extraction, read, provide feedback and approved the final manuscript.
Acknowledgement
The authors will like to acknowledge the contribution of David Abdy, the specialist librarian for Institute for Health Research, University of Bedfordshire for his contribution in designing the search strategy for the study.
References
- (2017) International Diabetes Federation IDF Diabetes Atlas (8th Edn).
- Dekker JM, Girman C, Rhodes T, Nijpels G, Stehouwer CD, et al. (2005) Metabolic syndrome and 10-year cardiovascular disease risk in the Hoorn Study. Circulation 112: 666-673.
- Wilson PW, D’Agostino RB, Parise H, Sullivan L, Meigs JB (2005) Metabolic syndrome as a precursor of cardiovascular disease and type 2 diabetes mellitus. Circulation 112: 3066-3072.
- Kaur J (2014) A comprehensive review on metabolic syndrome. Cardiology research and practice.
- Balkau B, Valensi P, Eschwège E, Slama G (2007) A review of the metabolic syndrome 33: 405-413.
- Ordovas JM (2007) Genetic links between diabetes mellitus and coronary atherosclerosis. Current atherosclerosis reports 9: 204-210.
- (2014) National Institute for Health and Clinical Excellence. Lipid modification.
- Briggs A, Scarborough P, Smith A (2016) Modelling in Public Health. In: Krishna R, Ivan G, (Eds.)., Public Health Intelligence. Cham: Springer p. 67-90.
- Maglio PP, Mabry PL (2011) Agent-based models and systems science approaches to public health. American journal of preventive medicine 40: 392-394.
- Collins GS, Reitsma JB, Altman DG, Moons KG (2015) Transparent reporting of a multivariable prediction model for individual prognosis or diagnosis (TRIPOD): The TRIPOD statement. BMC medicine 350: g7594.
- Moons KG, Wolff RF, Riley RD, Whiting PF, Westwood M, et al. (2019) PROBAST: A tool to assess risk of bias and applicability of prediction model studies: Explanation and elaboration. Annals of Internal Medicine 170: W1-33.
- Mallett S, Royston P, Dutton S, Waters R, Altman DG (2010) Reporting methods in studies developing prognostic models in cancer: A review. BMC medicine 8: 20.
- Collins GS, Mallett S, Omar O, Yu LM (2011) Developing risk prediction models for type 2 diabetes: A systematic review of methodology and reporting. BMC medicine 9: 103.
- Abbasi A, Peelen LM, Corpeleijn E, Van der Schouw YT, Stolk RP, et al. (2012) Prediction models for risk of developing type 2 diabetes: systematic literature search and independent external validation study. Bmj 345: e5900.
- Damen JA, Hooft L, Schuit E, Debray TP, Collins GS, et al. (2016) Prediction models for cardiovascular disease risk in the general population: systematic review. Bmj 353: i2416.
- Collins GS, Moons KG (2012) Comparing risk prediction models. Bmj 344: e3186.
- Khan K, Kunz R, Kleijnen J, Antes G (2011) Systematic reviews to support evidence-based medicine. Crc Press, United States.
- (2010) Evidence for Policy and Practice Information and Co-ordinating Centre (2010) EPPICentre Methods for Conducting Systematic Reviews.
- Brereton P, Kitchenham BA, Budgen D, Li Z (2008) Using a Protocol Template for Case Study Planning. In EASE 8: 41-48.
- Bettany-Saltikov J (2012) How to do a systematic literature review in nursing: a step-by-step guide. McGraw-Hill Education, UK.
- Noble D, Mathur R, Dent T, Catherine Meads, Trisha Greenhalgh, (2011) Risk models and scores for type 2 diabetes: systematic review. Bmj. 343: d7163.
- Whiting P, Harbord R, Kleijnen J (2005) No role for quality scores in systematic reviews of diagnostic accuracy studies. BMC medical research methodology 5: 19.
- Altman DG, Vergouwe Y, Royston P, Moons KG (2009) Prognosis and prognostic research: validating a prognostic model. Bmj 338: b605.
- Soldatovic I, Vukovic R, Culafic D, Gajic M, Dimitrijevic Sreckovic V (2016) siMS score: simple method for quantifying metabolic syndrome. PLoS One 11: e0146143.
- Graziano F, Grassi M, Sacco S, Concas MP, Vaccargiu S, et al. (2015) Probing the factor structure of metabolic syndrome in Sardinian genetic isolates. Nutrition, Metabolism and Cardiovascular Diseases 25: 548-555.
- Villa JK, E Silva AR, Santos TS, Ribeiro AQ, Da Rocha Sant'Ana LF (2015) Metabolic syndrome risk assessment in children: Use of a single score. Revista Paulista de Pediatria (English Edition) 33: 187-193.
- Okosun IS, Lyn R, Davis Smith M, Eriksen M, Seale P (2010) Validity of a continuous metabolic risk score as an index for modeling metabolic syndrome in adolescents. Annals of epidemiology 20: 843-851.
- Pandit D, Chiplonkar S, Khadilkar A, Kinare A, Khadilkar V (2011) Efficacy of a continuous metabolic syndrome score in Indian children for detecting subclinical atherosclerotic risk. International journal of obesity 35: 1318.
- Hosseini M, Sarrafzadegan N, Kelishadi R, Monajemi M, Asgary S, et al. (2014) Population-based metabolic syndrome risk score and its determinants: The Isfahan Healthy Heart Program. Journal of research in medical sciences: The official journal of Isfahan University of Medical Sciences 19: 1167.
- Shafiee G, Kelishadi R, Heshmat R, Qorbani M, Motlagh ME, et al. (2013) First report on the validity of a continuous Metabolic Syndrome score as an indicator for Metabolic Syndrome in a national sample of paediatric population-the CASPIAN-III study. Endokrynologia Polska 64: 278-284.
- Wiley JF, Carrington MJ (2016) A metabolic syndrome severity score: A tool to quantify cardio-metabolic risk factors. Preventive medicine 88: 189-95.
- Tan C, Sasagawa Y, Kamo KI, Kukitsu T, Noda S, et al. (2016) Evaluation of the Japanese Metabolic Syndrome Risk Score (JAMRISC): a newly developed questionnaire used as a screening tool for diagnosing metabolic syndrome and insulin resistance in Japan. Environmental health and preventive medicine 21: 470.
- Zhang W, Chen Q, Yuan Z, Liu J, Du Z, et al. (2015) A routine biomarker-based risk prediction model for metabolic syndrome in urban Han Chinese population. BMC public health 15: 64.
- Steinberg GB, Church BW, Mc Call CJ, Scott AB, Kalis BP (2014) Novel predictive models for metabolic syndrome risk: a" big data" analytic approach. The American journal of managed care 20: e221-228.
- Obokata M, Negishi K, Ohyama Y, Okada H, Imai K, et al. (2015) A risk score with additional four independent factors to predict the incidence and recovery from metabolic syndrome: development and validation in large Japanese cohorts. PloS one 10: e0133884.
- Je Y, Kim Y, Park T (2017) Development of a self-assessment score for metabolic syndrome risk in non-obese Korean adults. Asia Pacific journal of clinical nutrition 26: 220.
- Misra A, Jaiswal A, Shakti D, Wasir J, Vikram NK, et al. (2008) Novel phenotypic markers and screening score for the metabolic syndrome in adult Asian Indians. Diabetes research and clinical practice 79: e1-5.
- Wilkerson GB, Bullard JT, Bartal DW (2010) Identification of cardiometabolic risk among collegiate football players. Journal of athletic training 45: 67-74.
- Efstathiou SP, Skeva II, Zorbala E, Georgiou E, Mountokalakis TD (2012) Metabolic Syndrome in Adolescence: The Prediction of Metabolic Syndrome in Adolescence (PREMA) Study. Circulation 125: 902-910.
- Eisenmann JC, Laurson KR, Du Bose KD, Smith BK, Donnelly JE (2010) Construct validity of a continuous metabolic syndrome score in children. Diabetology & metabolic syndrome 2: 8.
- Zou TT, Zhou YJ, Zhou XD, Liu WY, Van Poucke S, et al. (2018) MetS Risk Score: A Clear Scoring Model to Predict a 3-Year Risk for Metabolic Syndrome. Hormone and Metabolic Research 50: 683-689.
- Liu H, Hsu CH, Lin JD, Hsieh CH, Lian WC, et al. (2014). Predicting metabolic syndrome by using hematogram models in elderly women. Platelets 25: 97-101.
- Kakudi HA, Loo CK, Moy FM (2017) Predicting metabolic syndrome using risk quantification and ensemble methods. In2017 IEEE Symposium Series on Computational Intelligence (SSCI). IEEE:1-8.
- Sancar N, Tinazli M (2016) Development of an intelligent model to estimate the probability of having metabolic syndrome. Procedia Computer Science 102: 106-112.
- Andersen LB, Lauersen JB, Brond JC, Anderssen SA, Sardinha LB, et al. (2015) A new approach to define and diagnose cardiometabolic disorder in children. J Diabetes Res pp. 539835.
- Shi P, Goodson JM, Hartman ML, Hasturk H, Yaskell T, et al. (2015) J Continuous metabolic syndrome scores for children using salivary biomarkers. PloS one 10: e0138979.
- Hsiao FC, Wu CZ, Hsieh CH, He CT, Hung YJ, et al. (2009) Chinese metabolic syndrome risk score. Southern medical journal 102: 159-164.
- Beswick AD, Brindle P, Fahey T, Ebrahim S (2008) A systematic review of risk scoring methods and clinical decision aids used in the primary prevention of coronary heart disease. Royal College of General Practitioners [GRA] 4: 105.
- Siontis GC, Tzoulaki I, Siontis KC, Ioannidis JP (2012) Comparisons of established risk prediction models for cardiovascular disease: systematic review. Bmj 344: e3318.
- WHO (2014) Global status report on noncommunicable diseases 2014?
- Gijsberts CM, Groenewegen KA, Hoefer IE, Eijkemans MJ, Asselbergs FW, et al. (2015) Race/ethnic differences in the associations of the Framingham risk factors with carotid IMT and cardiovascular events. PLoS One 10: e0132321.
- Simon R (2006) A checklist for evaluating reports of expression profiling for treatment selection. Clinical Advances in Hematology and Oncology 4: 219.
- Royston P, Altman DG, Sauerbrei W (2006) Dichotomizing continuous predictors in multiple regression: A bad idea. Statistics in medicine 25: 127-141.
- Gao WG, Dong YH, Pang ZC, Nan HR, Wang SJ, et al. (2010) A simple Chinese risk score for undiagnosed diabetes. Diabetic medicine 27: 274-281.
- Counsell C, Dennis M (2001) Systematic review of prognostic models in patients with acute stroke. Cerebrovascular diseases 12: 159-170.
- Hukkelhoven CW, Rampen AJ, Maas AI, Farace E, Habbema JD, et al. (2006) Some prognostic models for traumatic brain injury were not valid. Journal of clinical epidemiology 59:132-143.
- Lagakos SW (1988) Effects of mismodelling and mismeasuring explanatory variables on tests of their association with a response variable. Statistics in medicine 7: 257-274.
- Royston P, Sauerbrei W (2008) Multivariable model-building: a pragmatic approach to regression anaylsis based on fractional polynomials for modelling continuous variables. John Wiley & Sons, US.
- Little RJ (1992) Regression with missing X's: A review. Journal of the American Statistical Association 87: 1227-1237.
- Burton A, Altman DG (2004) Missing covariate data within cancer prognostic studies: A review of current reporting and proposed guidelines. British journal of cancer 91: 4.
- Steyerberg EW, Vickers AJ, Cook NR, Gerds T, Gonen M, et al. (2010) Assessing the performance of prediction models: a framework for some traditional and novel measures. Epidemiology (Cambridge, Mass.) 21: 128.
- Altman DG, Vergouwe Y, Royston P, Moons KG (2009) Prognosis and prognostic research: validating a prognostic model. Bmj 338: b605.
- (2001) Expert Panel on Detection E. Executive summary of the third report of the National Cholesterol Education Program (NCEP) expert panel on detection, evaluation, and treatment of high blood cholesterol in adults (Adult Treatment Panel III). Jama 285: 2486.
- Austin PC, Tu JV (2004) Automated variable selection methods for logistic regression produced unstable models for predicting acute myocardial infarction mortality. Journal of clinical epidemiology 57: 1138-1146.
- Steyerberg EW, Eijkemans MJ, Harrell Jr FE, Habbema JD (2000) Prognostic modelling with logistic regression analysis: a comparison of selection and estimation methods in small data sets. Statistics in medicine 19: 1059-1079.
- Altman DG, Royston P (2000) What do we mean by validating a prognostic model? Statistics in medicine 19: 453-473.
