 Research Article
Abstract
Purpose: Recently, many academic research groups have focused their attention on changes in human brain networks related to several kinds of pathologies and diseases, generating the new discipline termed “Network Medicine”. Purpose of this paper is to investigate the ability of the Network Medicine to give deeper insights in the functionality of brain activity.
Material and Methods: In the proposed study of Tourette syndrome, we have investigated with the functional magnetic resonance imaging the possibility that the mechanisms associated with the monitoring and internal control of movements were compromised in individuals with Tourette syndrome; we enrolled 20 Tourette Syndrome patients in comparison with a healthy Controls group of 15 subjects matching for age and sex distribution. We proposed, for the fMRI analysis, a novel task based on the execution of switching between complex movements on demand.
Results: The elementary activation model found that the effort related to the task in comparing Tourettic vs Controls mainly concerns the areas of the Gyrus of the Cingulum, the precuneus and the thalamic area of the ventral-lateral nucleus. In particular, the BA11 plays an essential role in the Tourette Patients related to the continue tentative to correct the TIC. Considering the status of the pilot study of this work, we remark the power of proposed methods to investigate the complex interaction of the brain networks.
Conclusion: Alteration in brain activity for a population of Tourette Syndrome patients is evaluable by the use of complex indexes, results confirm the literature about this pathology and these medical physics methods can be applied to all neurological diseases investigation by opportune task-driven experiments or by resting state fc-MRI experiments.
Keywords: Brain Complex Network; Tourette Syndrome; Functional Connectivity MRI; Network Medicine
Abbreviations: EEG: ElectroEncephaloGraphy; MEG: Magnetoencephalography; MRI: Magnetic Resonance Imaging; PET: Positron Emission Tomography; TS: Tourette Syndrome; OCD: Obsessive Compulsive Disorder; BOLD: Blood Oxygen Level Dependent; ADHD: Attention Deficit Hyperactivity Disorder; CSF: Cerebrospinal Fluid; ICC: Intrinsic Connectivity Contrast
Introduction
Recently, several academic research groups have focused their attention on changes in human brain networks related to several kinds of pathologies and diseases, generating the new discipline termed “Network Medicine” [1]. Network Medicine promises to identify the principles to understand, at the molecular level, the mechanisms of life in humans using the approach of the complex systems biology [2]. Biological complex systems may be mathematically modelled using graph theory and community properties applied to the links and nodes, that are elements activated in the networking of the fundamental system units [3]. In the human brain the connections, the network links, between different areas, the network nodes, creating a set of specific and interacting networks with properties of adaptivity and hierarchy. In the regions of interest for the brain activity (ROIs), neurons contribute to a locally synchronized activity, and all these local regions can work collaboratively, or connected, to the global brain functioning. The way the links between nodes change over time depends on the fitness of nodes, a property defining the ability of each node to attract, to connect, other nodes: the nodes with higher fitness level attract more links at the expense of less fit nodes. This linking strategy is a mechanism underlying the brain functioning and characterizing the self-reorganization of the brain, a remarkable property occurring in a different situation as pathologies or environmental interactions: in these situation brain networks alteration may be induced; external and internal factors may induce functional networks alteration. Studies of brain diseases can be designed to attempt to identify the self-reorganization principles that drive the related functional networks alteration. In this way, it is possible to reveal the properties of the modified system and use these markers for a diagnostic process.
How can we investigate the brain functions? Several techniques are available to investigate the brain functioning: ElectroEncephaloGraphy (EEG), Magnetoencephalography (MEG), Magnetic Resonance Imaging MRI, Positron Emission Tomography (PET) [4]. The imaging with Magnetic resonance is a crucial tool widely used to study brain activity and morphology. In Magnetic Resonance Imaging (MRI), the functional MRI (fMRI) is used to investigate how the brain operates all the functions [4]. In fMRI, patients can perform particular tasks to highlight the areas of interest activated by the brain to carry out the work (movement tasks, mental calculation, recognition and counting of specific images or sounds transmitted by objects MRI compatible to the patients under examination in controlled and timing condition) [5]. These activations, with the default activity of the brain, can be revealed by the BOLD effect by means we can visualize the brain areas activated and their connections [6]. All the areas involved can be investigated about the connectivity between them during task or function execution [7] or a rest status [5]. As an example of pathological brain networks dynamics, we propose a study of the Tourette Syndrome (TS) [8,9]. We acquired task-driven functional connectivity MRI (td-fcMRI) images, to analyze networks defined in a population of Tourette’s Syndrome (TS) patients in comparison with a control population matching in age, sex [10].
Tourette syndrome is a complex brain disorder characterized by tics expressed as repetitive, sudden, and involuntary movements and noises. Tics can appear in childhood, and their severity can vary with the growth of the individuals. In most cases, tics decrease intensity and frequency in adulthood. In addition to tics, Tourettic patients are at risk for other problems which include the disorders of attention and hyperactivity (ADHD), and Obsessive-Compulsive Disorder (OCD), as well as anxiety, depression, and sleep disorders [11]. Several genetic and environmental factors could play a role in causing Tourette syndrome. Most of these factors are still unknown, and researchers are studying risk factors before and after birth, that may contribute to this complex neurological disorder [12]. Scientists involved in the Tourette Syndrome studies believe that tics may result from changes in brain neurotransmitters responsible for controlling voluntary movements. Genetic Mutations involving the SLITRK1 gene, for example, have been identified only in a small number of patients affected by the Tourette syndrome. This gene carried out instructions for a protein active in the brain, and essential for the development of nerve cells, and the growth of axons and dendrites that allow neurons communication. It is still unclear how mutations in the SLITRK1 gene can lead to this disorder. Because mutations have been reported in a few subjects with this condition, researchers suspect that changes in other genes connected to the TS and not yet identify may occur [13]. Nevertheless, alterations in neurotransmitters activity can be revealed by several techniques. We used the fMRI task-driven paradigm for the T2* brain signal alteration in the TS population, a technique frequently used for investigation of this kind of pathologies [14,15].
The principal aim was the evaluation of the neural activity and connectivity in patients with TS during a complex motor task execution [16]. The most critical variation expected was the circuitry alterations in attention-control brain networks in TS [17]; these circuitries, or networks, are related to the cortical-striatal-thalamocortical circuitry, and fronto-parietal and front striatal networks [11,18]. Using the complex network properties parameters alteration applied to the networks of TS population, we find an altered trend in the balance of the ‘segregation’ (a general decrease in correlation strength) between regions close in anatomical space and ‘integration’ (an increased correlation strength) between selected regions distant in space [4,19]. Several studies in the TS emphasize the role of the cortical-striatal-thalamocortical circuits, particularly the subcortical component-such as the basal ganglia-and the cortical component-such as the prefrontal cortex. TS population frequently report atypical brain connectivity. However, the neural correlates underlying their motor TIC development are still poorly understood. For this reason, we were interested in the possible involvement of the front-striatal system networks that are responsible for self-regulatory control [20].
In our study we proposed an innovative exploration of motor circuitries alteration in TS; it is based on the pioneer works of Biswal et al. [14], the Lerner et al. paper [17], the Wang et al. paper [18] and Church et al. [21]. Functional magnetic resonance imaging data were acquired from 18 individuals with Tourette’s syndrome and 11 healthy comparison subjects during a complex motor task of switching on-demand between two different conditions of finger tapping; these two different conditions of the motor task require attention to motor strategy and strength of attention maintenance to the task execution. This task was projected to study by MRI the fine structure in the brain effects of a possible treatment for Tourette [22]. During the fMRI examinations, based on the usual BOLD effect (BOLD, Blood Oxygen Level Dependent), contrast results from changing regional blood concentrations of oxy-hemoglobin and deoxy-hemoglobin, producing alterations in the T2* MRI signals alteration. In particular, using a band-pass filter, we investigated about potential frequency-modulation of fcMRI measures related to differential actions of brain circuitries in motor task-control in a Tourette population [23]. Further notes about this item can be acquired from the paper of Buzsaki [24].
Generally speaking, Tourette syndrome (TS) is characterized by irregular motor and vocal tics, whose onset usually occurs in childhood; further, Attention Deficit Hyperactivity Disorder (ADHD), Obsessive-Compulsive Disorder (OCD) and learning difficulties [9]. TS correlated to various factors including inherited genetic vulnerability, prenatal and perinatal insults, or bacterial and viral infections [25]. The underlying neuropathology TS is unknown [26]. The pathophysiology of TS has been associated with dysfunction of both the basal ganglia and related thalamocortical circuits [27]. Neuroimaging data have shown reduced volumes and abnormal asymmetries in the caudate, putamen and globus pallidus in TS patients [26]. Moreover, studies conducted with Positron Emission Tomography (PET) and Electroencephalography (EEG) suggest that motor function works differently in TS [27]. Further, numerous studies have pointed to dysfunction in TS patients of the Supplementary Motor Area (SMA), which controls all the preparation, coordination and execution of movements [28].
Corticostriatal circuits play vital roles in the complex human network by means the Orbitofrontal Cortex (OFC) conditioning behaviours in such critical situation as evaluation, affect regulation and reward-based decision-making. Foremost, the medial and lateral regions of the OFC (mOFC and lOFC), involving different essential circuits, can exhibit functionally and anatomically distinct connectivity profiles which differentially contribute to the various aspects of goal-directed behaviour [29,30]. Using Brodman’s Atlas (BA) to locate and describe the cerebral areas of interest, we can say that the areas BA 10, 11 and 47 form the OFC, while the medial part of the OFC is delineated by BA 25 and BA 12 [31]; subsequent investigations have further divided the OFC into further sub-regions whose functions are yet to be clarified [31]. The front striatal system includes lateral inferior prefrontal cortex (Brodmann area 44/45), the mesial frontal gyrus (Brodmann area 46), the dorsolateral prefrontal cortex (Brodmann area 9/46), the lenticular nucleus (i.e. Pallido and putamen) and the thalamus. Fronto-striatal systems are implicated in the control and inhibition of movements and behaviours [32].
Materials and Methods
Participants included in this study were 18 (out of 20) adult patients with a mean age of 30 years and 11 (out of 15) healthy patients with a mean age of 38 years. All the selected participants were evaluated ad right-handed as determined by the Edinburgh Handedness Inventory [33]. We applied some tests to evaluate the intensity of obsessive-compulsive and tics. The Yale-Brown Obsessive-Compulsive Scale [34] and the Yale Global Tic Severity Scale (YGTSS) [35] were used to assess OCD and TIC symptom severity in the patient group. Healthy comparison subjects were excluded if they reported any history of psychiatric illness on the SCID-NP (non-patient version). History of substance use disorder, neurologic illness, head injury with loss of consciousness, a medical condition that could impact on cognitive functioning, or factors contraindicating fMRI also served as exclusionary criteria. Participants in the study were required to provide written informed consent. In order to test the ability of participants to control motor activity, we proposed an innovative task for the fMRI experiment, the “TOUR” paradigma. Task proposed was a mix of block and event related designs based on the finger tapping task. We have addressed attentional modulation of functional connectivity using the complex task “TOUR”: subjects completed a modified finger-tapping motor task, with both right and left hand, with ondemand switching between two conditions: usual finger tapping and a finger-tapping without the opposition between thumb and medium fingers. Subjects were not required to perform the task as quickly as possible. Participants completed a brief practice running the task before scanning to familiarize them with the stimuli and task requirements. The vocal command to switch between dual conditions was submit randomly in order to increase the difficulty of the task.
All subjects were scanned under identical stimulus conditions; the hypothesis is that the hemodynamic responses addressed by the attentional component of the task can reveal a corticalstriatal- thalamocortical network alteration. Our work bases on the hypothesis that, as reported in the literature, altered functioning of the network responsible for programming motor in response to a stimulus (frontal-parietal network responsible for executive functions), it may be the best explanation of the clinical manifestations associated with ST [36]. This hypothesis leads to alteration of attentional executive functions. The brain areas involved in attentional executive functions include the frontostriatal and fronto-parietal system. The first one is responsible for the “self-regulatory control”, i.e. self-monitoring cognitive, affective and motor, the second one is held responsible for the so-called “adaptive control” that allows an adjustment in the transition from one event to another [23,37-39]. Using the paradigm illustrated in Figure 1, we measured the bold signal and its alterations with the idea of calculating from them the variation of the connection properties of the hubs contained in the frontostriatal circuit. The proposed paradigm should allow us to study the relation between disease and possibly altered whole-brain topology; it is a combined study of neuro-physio-psychological assessment and graph theoretical network analysis of the fMRI signal. In the design of experiment, we postulate that, in order to reveal neural mechanisms that govern tic generation in Tourette’s syndrome, a motion task, with higher cost function related to the higher attention requested by complicated motion, should be submitted to patients and healthy subjects to examine neural activity and connectivity within cortical-striatal-thalamocortical circuits [40,41]. Neuroimaging studies have shown that “attention (to motion in our case)” task can increase the responsiveness of the several cortical areas, not only the motion-selective ones. The increase or the decrease of the activation in these particular cortical areas are often attributed to the modulation of proprioceptive cortical projections. This leads to the idea that, in Tourette patients, attention is associated with changes in brain connectivity.

Figure 1: Block-Event paradigm for the Tourette fc MRI experiment.
We report some information about data acquisition. All scans were obtained on a single 1.5-Tesla scanner using a gradient echoplanar imaging sequence for fMRI. The fMRI data were acquired using pre-settled sequences (fMRI/SSh/96 with TR/TE 3000/50, FA 90, a DFOV 22.8 cm×22.8 cm on a matrix of 128×128, nex 1, thk 4 mm).
All the aspects of the pre-processing of the fMRI should be carefully considered to obtain a clear and low-noise signal. A robust statistical analysis must address the analysis of noise sources in fMRI in order to avoid possible confounds. This is an essential task for a successful analysis in fc-MRI. We use the functional connectivity toolbox Conn (www.nitrc.org/projects/conn) [42] that implements the component-based noise correction (CompCor) algorithm for physiological and other noise source reduction strategies. These include removal of movement and temporal covariates, and a temporal filtering of the BOLD signal oscillations. Filtering of BOLD Signals is another essential aspect to consider because the information in the BOLD signal is strictly related to the different frequencies embedded [43,44]. The noise reduction strategy in Conn does not rely on global signal regression, and it allows for physiological interpretation of correlation and anticorrelations between voxels activity [21,37,45].
Spatial pre-processing procedures adopted include slicetiming correction, realignment, coregistration, normalization, and spatial smoothing. Further, the toolbox employs segmentation of grey matter, white matter, and Cerebrospinal Fluid (CSF) areas for optional use during removal of temporal confounding factors. Spatial pre-processing is implemented in Conn using SPM software (SPM, Statistical Parametric Mapping. Wellcome Department of Imaging Neuroscience, London, UK; www.fil.ion.ucl.ac.uk/spm) [46]. SPM and Conn run both under MATLAB (The MathWorks, Natick, Massachusetts) calculation environmental. Statistical parametric mapping was carried out in the framework of General Linear Model (GLM) [47] followed by usual random effects procedures, as developed by Holmes and Friston. A random-effects analysis generates the contrast images for single individual “switch motion” task activity. In order to capture, as better as possible, the effects of interest strictly correlated to the switching in the motor task (the motor strategy organization, we could say) we have analyzed a temporal range of only 3 dynamics after the vocal command submission; in this way we aim to produce the contrast maps for the fMRI signal and the connectivity contrasts just for the phoneme of interest. The contrast images for fMRI signal were analyzed using t-tests for the groups (Tourette vs Control) comparisons. Coordinates of significant activations were expressed in Talairach space and location of the local maxima, and the associated function was investigated using the XJVIEW and Sleuth2.0 (http://brainmap. org) software. Relationships between Tourette syndrome symptom severity, as measured using the YBOCS and YGTSS total score, and brain activation during response inhibition were evaluated.
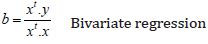
The values of these parameters were introduced in the model as covariates. Due to the expected weakness of the signals, we used a statistical threshold p<0.05 (uncorrected) for the single-subject fMRI activation and a minimum cluster extension of 5 contiguous voxels to improve the significance of the results. Finally, participant characteristic and behavioural data were analyzed using the MATLAB “Statistics” toolbox. Connectivity measure is performed basically at the Voxel to Voxel level and, in order to discuss connectivity properties in connection with spatially segregated brain functions, a Seed to Voxel and ROI to ROI analysis can be carried out. In our experiment, brain areas of interest were spatially labelled as in the Brodmann Areas (BA) in order characterize the sources region for the extraction of the time series of interest; the same areas were subsequently used as labels for the targets in the ROI to ROI and Seed to Voxel analysis. Data presented in this paper focuses on the zero-lagged bivariate-correlation linear measure of functional connectivity between two sources defined as:
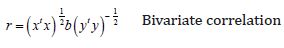
Where
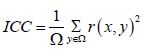
This is the Voxel-Level Functional Connectivity MRI measures derived from the Voxel-to-Voxel Connectivity Matrix r(x, y); in our experiment, we characterize the strength of the global connectivity pattern between each voxel and the rest of the brain with the Intrinsic Connectivity Contrast (ICC) [43].
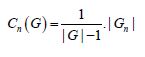
Finally, graph measure at ROI and network level performed are defined by the cost function:
Roi-level measures
Network-level measures
where Cn(G) represents the cost in graph G, and |G| represents the number of nodes in graph G. In addition to these parameters we calculated, for the differential network and each node of the network, the global and the local efficiency, the average path length, the Clustering coefficients, the Betweenness Centrality and the Degree. In fact, by clicking graph-theory, a graphical display is shown, allowing the users to test, for the selected between-subjects and between-condition contrasts, measures of efficiency, centrality, and cost/degree, associated with an ROI-to-ROI connectivity network. Click on ‘Network nodes’ button allows the user to limit the ROI-to-ROI network analyzed to that defined by a subset of ROIs. The ‘Network edges’ option allows the definition of the connectivity threshold above which two ROIs are considered connected, and it can be defined based on correlation scores, z-scores, or cost values. For each ROI the list at the bottom of the window displays the corresponding measure effect size (global efficiency, local efficiency, or cost), as well as T- values, uncorrected p-values, and FDR-corrected p- values for the specified second-level analysis. The graphical display and second-level results can be thresholded using either uncorrected or FDR- corrected p- values, and it can be set to display one-sided or two-sided results. This is an important option, especially for low-intensity perturbation of bold brain signal. Right-clicking on the brain display shows additional display options, including 3d-rendered views of the analyzed network of connectivity. All these settings are critical to select in the better way the effects of interest.
The Connectivity and Graph Theory measures are the strategical approach of network medicine in the Functional Brain Imaging to mining information about the complexity of the interaction of neurons in the brain [16]. Everything, or almost, what surrounds us is “complex”. We carry around, locked in the skull, the most complex system that probably exists: the human brain. However, we still know little about complexity and how to describe it through exact equations. We know little about the anatomy of complex systems that are expressed through hierarchies, feedback mechanisms, attractors, dynamics, catastrophic bifurcations and self-regulation. A property of biological interest is undoubtedly the self-regulation whose network anatomy signature is the property of heterogeneity. The heterogeneous networks are characterized by the presence of Hubs, super-connected nodes scattered throughout the network that exercise specific development properties over the entire network. Real heterogeneous networks are characterized by the decrease of the average connection distance between nodes; this property is called the ultra-small world. We define the critical functions used for our analysis. The clustering coefficient estimates how the adjacent nodes and a node are anchored with each other, the centrality of the degree that provides an estimate of the capacity of the nodes of a direct relationship with the other nodes, the centrality of Betweenness, which provides an estimate of the importance of network nodes. Global efficiency is defined as a measure of the “centrality” of a node, a measure of the relative importance of this node in the network. The Degree and Cost parameters both measure the number of connections from each node. The results that we find, a significant increase in the degree and cost, are consistent with a decrease in centrality for these two nodes; that decrease is also likely mediated by a decreased in the of the centrality of the nodes number of connections (degree/cost) of these population and Tourettic population, and each condition switching from usual finger tapping to the modified one and the switching from the modified finger tapping to the usual one. In this way, we can ascertain whether global efficiency and cost are decreasing when comparing the two conditions.
Two or more groups can be compared with a statistical test comparing the global efficiency of the global network which represent the average of the global efficiency of each node of the network, and the global efficiency of a single node in a graph can be defined as the average inverse shortest-path distance from this node to all other nodes in the graph. So, in addition to comparing between groups the global efficiency of the ‘whole-brain’ network, we can also compare the global efficiency of individual nodes (ROIs) between groups within the network; this is a measure of centrality, of relative importance of a given node within a graph; this represents the “hub” attitude of the nodes. There are represented only those nodes that survive the chosen false positive threshold. In our experiment, it would seem that altered global efficiency, the one calculated for the entire brain network, in controls group could not be different compared to the one for the Tourettic group. There is not a statistically significant difference. The statistic does not prove the increased efficiency and centrality attitude for the global network. So, we have to state that no difference at a global level can be revealed. However, we can test this hypothesis, varying the threshold of the correlation coefficient matrix. The adjacency matrix is defined by thresholding the original ROI-to-ROI correlation coefficient matrix, but the details of this operation can vary in a wide range, and it depends on the options chosen in the network edges graphical user interface [3].
If we choose ‘correlation coefficient’ there, then the adjacency matrix is formed by selecting the edges with correlation coefficient values above the selected threshold value, in other words choosing a value of 0.5 means that two ROIs are considered connected only if their bivariate correlation is above the value of 0.5. Using the ‘z-score’ parameter, then the correlation-coefficient values are first transformed to z-scores; in other words, coefficients are normalized to have zero mean and variance one for each subject, and the edges create the adjacency matrix with z-scores above the selected threshold; for example, choosing a value of 1 for the threshold means that two ROIs are connected if their correlation coefficients are one standard deviation above the mean, calculated for each subject. The last option is to choose ‘cost’ parameter; then the adjacency matrix is formed by selecting a fixed percentile, i.e. the chosen threshold value, of the edges in each network, i.e. those with the most significant correlation coefficient values, separately for each subject. Results of this operation are graphs that have, for each subject, the same ‘cost’; for example, if we choose a value of 0.15 for the cost threshold value, then each subject graph will have a fixed cost of 0.15, meaning that 15% of all possible edges are present. We choose this function to select the threshold of Graph Theory parameters, because it is better correlated to the idea of the cost function of task execution strength. Using these setting parameters [0,1:1] Hz Bandpass filter; First 3 dynamics used we search the alteration in nodes properties between the Tourette population and the healthy controls [24,42].
Results
In our experiment, we focused on the motion-related circuitries alterations. Our particular task was elaborated to select circuitry alterations in control systems. The Brain Control Systems, for the superior attentive functions, are Frontoparietal network (fast) and Cingulo-operculum network (slow) [23]. Frontoparietal Network has essential functions as active and adaptive control; Cingulo-opercular Network is in charge of the stable maintenance of task mode and strategy. Thus, the faster levels systems invent, experiment, and test the functions of the action required, while the slower levels systems stabilize, and conserve the memory of successful “experiments and strategy” for the personal reward. In the Roi to Roi analysis, the networks alterations for the between subjects and between conditions contrast -[1, -1] for both inputsare statistically significant just for the task operated with the left hand (all the people were Right Hand). This is an important finding of our study about TS disease that confirms the robustness and stability of the task: altered global properties of the brain network. It also did locally, affecting some significant ROI classified with the BA atlas. In particular, we found a significant global difference from the parameters: Cost; Global Efficiency, Degree, Average path length, Clustering coefficient, Local efficiency; Betweenness Centrality [3,45,48]. Graphical representation of these alterations is in the following pictures. In the following pictures, we propose the comparison between the differential networks of the two conditions of the motor task performed by Healthy Controls (Figure 2A) and Tourette’s (Figure 2B) [23]. Using CONN, it is possible to perform contemporary the analysis between subjects and condition, but, in our case, due to the noisy signals and to a low number of subjects in the groups, we have no statistically significance for this test. We present the differential network for each group.

Figure 2:
a) Healthy Controls between conditions
b) Tourette between conditions.
In both group difference between the two conditions regards ten Brodmann areas (left and right); ROIs associated with these BA present different properties related to the known physiopathology of the Tourette syndrome. In this network, which are the differences between the two population? Following we report the graph parameters calculated for the BA11 located in the Orbitofrontal cortex (Table 1). A t-test tests the difference with a threshold of 0,05 (uncorrected for multiple comparisons). For this node, we found an increase in the global and local efficiency, an increase in the Betweenness Centrality, that coupled to the substantially unchanged Average Path Length can suggest that the BA11 areas have increased its hub character, the ability to recruit much more node compared to the control network nodes. Projection towards the BA25 means that it is actively involved in the serotoninergic circuit.

Table 1: Network for Healthy Controls vs Tourette parameters in the BA11 Brodman area.
The differences in the Cost function confirm the global stress of this BA area in the network for the planning and control of the motor task. All that graph parameters were registered for all the Brodmann areas involved and reported in the following network. The network is composed by:
a) BA.11(L,R). Orbitofrontal Cortex: It is involved in planning, reasoning, reward, long-term memory and decision making.
b) BA.13(L,R). Insular Cortex: Broadman’s area 13 appears to have the function of bridging the lateral and medial layers of the brain.
c) BA.25(L, R). Subgenual Cortex: it is bordered by Bradman’s area 11 (prefrontal). Region 25 is extremely rich in serotonin transporters and is considered a coordinating region for a vast network
d) BA.29(L,R). Retrosplenial Cingulate Cortex: Retrosplenial Cortex connected to area 30
e) BA.30(L,R). Cingulate Cortex: this is an area connected to BA29, and it has proprioceptive properties.
f) BA.35(L,R). Perirhinal cortex: Perirhinal cortex (Brodmann’s area 35) is a multimodal cortical area that is located in the medial temporal lobe (MTL). A multimodal area receives input from more than one cortical association area, and it is a region where information from different modalities converge [49]. Regarding function, perirhinal Cortex plays a significant role in memory, as has been demonstrated by several lines of evidence. Perirhinal cortex detects novel objects and denotes familiarity.
g) BA.38(L,R). Temporopolar Area: The cytoarchitecture and the chemoarchitectonic studies state that this area contains at least seven sub-areas, one of which, “TG”, is present only in humans [1]. “The functional significance of the TG area is not known but can be associated with the complex perceptual inputs of visceral emotional responses.
h) BA.4 (L, R). Primary Motor Cortex
i) BA.6 (L, R). Premotor Cortex
j) BA.8 (L, R). Dorsal Frontal Cortex: Brodmann area 8 is involved in the planning of complex movements.
This network is robust and stable and associated with the innovative motor task studied for the populations [36].
The main results of the study, associated with this network, are summarized below. In the node of this network we found some of the Graph Theory parameters changed in comparison with the population controls and some others not changed. This fact may be interpreted as that some node change their properties in comparison with Controls population, and for others, this is not. The voluntary movements are the organized behaviour responsible for the performance of a purposeful task. The motor movements reflect the capabilities of the motor systems to plan, coordinate, execute, and inhibit movements assigned to the BA4 and MA6. The motor areas of the cerebral Cortex integrate proprioceptive areas BA29 and BA30, and other areas devoted to producing elaborate or complex voluntary movements strictly related to the Dorsal Frontal Cortex area BA8. Our imaging study implicates structural and functional changes in different parts of Cortical–Striatal– Thalamocortical (CSTC) neural circuitry. Specifically, dysfunctions involving cortical motor areas are connected, in TS, to the activation in premotor Cortex and supplementary motor area, BA4 and BA6 which are the critical regions involved in planning and coordinating temporal sequences of action also revealed by our connectivity and Graph Theory Analysis. Another critical role is played by the proprioception area which represents the ability to perceive and recognize the position of one’s body in space and the state of contraction of one’s muscles, without the support of sight. Described by Charles Scott Sherrington, it is considered a sixth sense in that this specific part of the brain regulates it. The proprioception assumes fundamental importance in the complex mechanism of control of the movement in the TS patients; the sensory feedback neurons serve this area; it is effectively activated in recovery physiotherapy and sports training. This is probably the reasons of the superior ability of Tourettic patients in sports and arts; this work supports the recent papers about the role played by the social behaviour network interdigitates with the basal ganglia to form a more significant network, the social decision-making network connected to the BA11 [50]. Social decision-making network dysfunction can explain significant features of the neurobiology of Tourette syndrome. Tourette syndrome may be a disorder of social communication resulting from developmental abnormalities at several levels of the social decision-making network. The social decision-making network dysfunction hypothesis suggests new avenues for the research in Tourette syndrome and new potential therapeutic targets.
Discussion
In the study proposed we have investigated the possibility that the mechanisms associated with the monitoring and internal control of movements were compromised in individuals with Tourette syndrome, compared to the corresponding group of healthy individuals; the proposed task involved the execution of complex movements. We believe that, in order to accurately perform the requested movements, it would be optimal for subjects with TS to update any model used to plan and control the movement to consider any discrepancies between what is requested as a movement and what has been achieved. We hypothesize that if individuals with Tourette syndrome find challenging to generate accurate patterns of their movements due to the high levels of sensory movement-related noise that accompany tics, then they should have difficulty updating their motor plans successfully. Movement in the complex motor task should show less accuracy at each initiation or movement change required. We can discuss our results. First, from the monitoring in the scanner, individuals with Tourette syndrome did not show greater difficulty in controlling the construction of an appropriate movement plan to reach the target. The lack of difference statistically significant between task executed with the RH and the difference reported for the LH could imply that the hypothesis that the control of the movements on the left side is more complicated than the right side could be valid, and that to maintain the control of the movement at an equal cost for the motor and premotor areas, the subjects with TS exercise greater control from the frontal areas toward the others compared to healthy controls.
This result is consistent with information founded in previous studies, which show how frequently individuals with Tourette syndrome, when compared to the combined controls, are not compromised in performing fast movements, directed towards the target, reaching (pointing) the movements. However, it is possible to demonstrate motor skills superior to the average level of Controls [12]. The problematic control of tics does not invalidate artistic and sporting performances. On the contrary, there are frequently several kinds of abilities contrasting the idea that TS is invaliding at all levels of motor and communication skills. These considerations are supported in this article by the methods used to detect different properties of brain networks by calculating functional connectivity indices using the Software Conn tools. The functional connectivity measures from ROI to ROI show high reliability through the comparison with the results shown in the literature of graph theory measurements characterizing the structural properties of functional connectivity networks.
Conclusion
Control networks Tourette syndrome show anomalous patterns of functional connectivity also in the pediatric population [38]. Repeated synchronized activation during daily activity can lead to greater synaptic efficiency of specific brain regions; such greater efficiency is paid with a higher operating cost of some nodes of the network or the entire network, causing a constant correlation of the spontaneous fluctuations of the BOLD signal, however. It remains to be clarified, however, the reason for these specific contributions of “synapse modifications” and the “connective anatomy” of these modifications relative to the fc-MRI models [23]. According to the flowchart characterizing our network, we could say that information can flow between the frontal area networks in different ways. For example, the stable control network could receive start signals from the performance control network and then from the adaptive control network. It is clear that in addition to being connected in cascade, alternatively, the frontal-parietal and cingulo-opercular control networks can be scab signals even with a parallel organization: both networks could interpret signals, implement control from top to bottom and process the feedback from the bottom up. The frontoparietal network can regulate the control of tasks on a trial basis, while the cingulo-opercular network could influence downstream processing more stably. We have no way of defining the mechanism adopted in the population of Tourette patients for the exchange of useful information. Both mechanisms are consistent with the results found.
The elementary activation model found that the effort related to the task in comparing Tourettic vs Controls mainly concerns the areas of the Gyrus of the Cingulum, the precuneus and the thalamic area of the ventral-lateral nucleus. The BA11 play an essential role in the network and probably with the continue tentative of subjects to correct the TIC they have an increase of the hub character of the BA11 node, a fitted node by that activity. We must remark some critical caveat of this study: heterogeneity of the Tourette population (outliers detected by ICA) and heterogeneity of the control group. For both groups there is a high Standard Deviation for age; the differences of the neuronal circuits with the growth have been tried, and this could be a bias until it is stratified, or the age is introduced as “confounders” in the model (together with the values of YBOCS and YGTSS). However, considering the status of the pilot study of this work, we remark the power of proposed methods to investigate the complex interaction of the brain networks.
Conflict of Interest
Authors have declared that no competing interests exist.
Ethical Approval Statement
All procedures performed in studies involving human participants were in accordance with the ethical standards of the institutional and national research committee and with the 1964 Helsinki declaration and its later amendments or comparable ethical standards.
Informed Consent Statement
Informed consent was obtained from all individual participants included in the study.
References
- AL Barabási, N Gulbahce, J Loscalzo (2011) Network medicine: a network-based approach to human disease. Nat Rev Genet 12(1): 56-68.
- SH Strogatz (2001) Exploring complex networks. Nature 410(6825): 268-276.
- ME J Newman (2010) Networks: An Introduction. Oxford University Press.
- KJ Friston (1994) Functional and Effective Connectivity in Neuroimaging: A Synthesis. Hum Brain Mapp 2(1-2): 56-78.
- MD Greicius, B Krasnow, AL Reiss, V Menon (2003) Functional connectivity in the resting brain: A network analysis of the default mode hypothesis. Proc Natl Acad Sci USA 100(1): 253-258.
- NK Logothetis, M Auguth, A Oeltermann, J Pauls, T Trinath (2001) A neurophysiological investigation of the basis of the BOLD signal in FMRI. Nature 412(6843): 150-157.
- S Corgiolu, Barberini L, Suri JS, Mandas A, Costaggiu D, et al. (2018) Resting-state functional connectivity MRI analysis in Human Immunodeficiency Virus and Hepatitis C Virus co-infected subjects. Eur J Radiol 102: 220-227.
- N Mol Debes, M Preel, L Skov (2017) Functional neuroimaging in Tourette syndrome: recent perspectives. Neurosci Neuroeconomics 6: 1-13.
- JF Leckman, (2002) Tourette’s syndrome. Lancet 360(9345): 1577-1586.
- JC Gore (2003) Principles and practice of functional MRI of the human brain. J Clin Invest 112(1): 4-9.
- M Mody, B Li (2016) Cortico-striato-thalamo-Cortical Circuitry, Working memory, and obsessive–Compulsive Disorder. Front Psychiatry 7(9).
- S Bohlhalter, A Goldfine, S Matteson, G Garraux, T Hanakawa, et al. (2006) Neural correlates of tic generation in Tourette syndrome: an event-related functional MRI study. Brain 129(8): 2029-2037.
- JF Abelson (2005) Sequence variants in SLITRK1 are associated with Tourette’s syndrome. Science 310(5746): 317-320.
- B Biswal, F Zerrin Yetkin, VM Haughton, JS Hyde (1995) Functional Connectivity in the Motor Cortex of Resting Human Brain Using Echo-Planar MRI. Magn Reson Med 34(4): 537-541.
- R Marsh, H Zhu, Z Wang, P Skudlarski, BS Peterson (2007) A Developmental fMRI Study of Self-Regulatory Control in Tourette’s Syndrome. Am J Psychiatry 164(6): 955-966.
- SF Muldoon, EW Bridgeford, DS Bassett (2016) Small-World Propensity and Weighted Brain Networks. Sci Rep 6:
- A Lerner, Bagic A, Boudreau EA, Hanakawa T, Pagan F, et al. (2007) Neuroimaging of neuronal circuits involved in tic generation in patients with Tourette syndrome. Neurology 68(23): 1979-1987.
- Z Wang, TV Maia, R Marsh, T Colibazzi, A Gerber et al. (2011) The neural circuits that generate tics in Tourette’s syndrome. Am J Psychiatry 168(12): 1326-1337.
- RM Roth, AJ Saykin, LA Flashman, HS Pixley, JD West, et al. (2007) Event-Related Functional Magnetic Resonance Imaging of Response Inhibition in Obsessive-Compulsive Disorder. Biol Psychiatry 62(8): 901-909.
- JA Church, Fair DA, Dosenbach NU, Cohen AL, Miezin FM, et al. (2009) Control networks in pediatric Tourette syndrome show immature and anomalous patterns of functional connectivity. Brain 132(1): 225-238.
- M Bortolato, A Muroni, F Marrosu (2007) Treatment of Tourette’s Syndrome with Finasteride. Am J Psychiatry 164(12): 1914-1915.
- NU F Dosenbach, Fair DA, Miezin FM, Cohen AL, Wenger KK, et al. (2007) Distinct brain networks for adaptive and stable task control in humans. Proc Natl Acad Sci USA 104(26): 11073-11078.
- G Buzsáki, A Draguhn (2004) Neuronal oscillations in cortical networks. Science 304(5679): 1926-1929.
- MM Robertson, JS Stern (2000) Gilles de la Tourette syndrome: Symptomatic treatment based on evidence. Eur Child Adolesc Psychiatry 9(1): 160-175.
- J Moriarty, AR Varma, J Stevens, M Fish, MR Trimble, et al. (1997) A volumetric MRI study of Gilles de la Tourette’s syndrome. Neurology 49( 2): 410-415.
- E Stern, Silbersweig DA, Chee KY, Holmes A, Robertson MM, et al. (2000) A Functional Neuroanatomy of Tics in Tourette Syndrome. Arch Gen Psychiatry 57(8): 741-748.
- H Shibasaki, Sadato N, Lyshkow H, Yonekura Y, Honda M, et al. (1993) Both primary motor cortex and supplementary motor area play an important role in complex finger movement. Brain 116(6): 1387-1398.
- S Tekin, JL Cummings (2002) Frontal–subcortical neuronal circuits and clinical neuropsychiatry an update. J Psychosom Res 53(2): 647-654.
- P Fettes, L Schulze, J Downar (2017) Cortico-striatal-thalamic loop circuits of the orbitofrontal cortex: Promising therapeutic targets in psychiatric illness. Front Syst Neurosci 11: 1-23.
- BJ Ciliax, Drash GW, Staley JK, Haber S, Mobley CJ, et al. (1999) Immunocytochemical localization of the dopamine transporter in human brain. J Comp Neurol 409(1): 38-56.
- H Tost, Meyer Lindenberg A, Klein S, Schmitt A, Höhn F, et al. (2006) D2 antidopaminergic modulation of frontal lobe function in healthy human subjects. Biol Psychiatry 60(11): 196-205.
- RC Oldfield (1971) The assessment and analysis of handedness: The Edinburgh inventory. Neuropsychologia 9(1): 97-113.
- Worbe, Marrakchi Kacem L, Lecomte S, Valabregue R, Poupon F, et al. (2015) Altered structural connectivity of cortico-striato-pallido-thalamic networks in Gilles de la Tourette syndrome. Brain 138(2): 472-482.
- L Zapparoli, Porta M, Gandola M, Invernizzi P, Colajanni V, et al. (2016) A functional magnetic resonance imaging investigation of motor control in Gilles de la Tourette syndrome during imagined and executed movements. Eur J Neurosci 43(4): 494-508.
- S Achard, E Bullmore (2007) Efficiency and Cost of Economical Brain Functional Networks. PLoS Comput Biol 3(2): e17.
- DA Fair, Cohen AL, Power JD, Dosenbach NU, Church JA, et al. (2009) Functional Brain Networks Develop from a Local to Distributed Organization. PLoS Comput Biol 5(5): e1000381.
- JA Church, Fair DA, Dosenbach NU, Cohen AL, Miezin FM, et al. (2009) Control networks in pediatric Tourette syndrome show immature and anomalous patterns of functional connectivity Brain. 132(1): 225-238.
- JH Holland (2006) Studying Complex Adaptive Systems. Jrl Syst Sci Complex 19: 1-8.
- CS Ray Li, HL Chang, YP Hsu, HS Wang, NC Ko (2006) Motor Response Inhibition in Children with Tourette’s Disorder. J Neuropsychiatry Clin Neurosci 18(3): 417-419.
- S Cutini, Chang HL, Hsu YP, Wang HS, Ko NC (2008) Selective activation of the superior frontal gyrus in task-switching: an event-related fNIRS study. Neuroimage 42(2): 945-955.
- R Martuzzi, R Ramani, M Qiu, X Shen, X Papademetris (2011) A whole-brain voxel-based measure of intrinsic connectivity contrast reveals local changes in tissue connectivity with anesthetic without a priori assumptions on thresholds or regions of interest. Neuroimage 58(4): 1044-1050.
- V Kiviniemi, JH Kantola, J Jauhiainen, O Tervonen (2004) Comparison of methods for detecting nondeterministic BOLD fluctuation in Fmri. Magn Reson Imaging 22(2): 197-203.
- JD Power, Alexander L Cohen, Steven M Nelson, Gagan S Wig, Kelly Anne Barnes, et al. (2011)
Functional network organization of the human brain. Neuron 72(4): 665-678. - KJ Friston (2011) Functional and Effective Connectivity: A Review. Brain Connect 1(1): 13-36.
- KJ Friston, AP Holmes, KJ Worsley, JP Poline, CD Frith, et al. (1994) Statistical Parametric Maps in Functional Imaging: A General Linear Approach. Hum Brain Map 2(4): 189-210.
- S Kintali (2008) Betweenness centrality: Algorithms and lower bounds.
- JC Augustinack, Huber KE, Stevens AA, Roy M, Frosch MP, et al. (2013) Predicting the location of human perirhinal cortex, Brodmann’s area 35, from MRI. Neuroimage 64: 32-42.
- RL Albin (2018) Tourette syndrome: a disorder of the social decision-making network. Brain 141(2):332-347.
- S Kim, GM Jackson, K Dyke, SR Jackson (2019) Impaired forward model updating in young adults with Tourette syndrome. Brain 142(1): 209-219.
- SA Julious (2005) Sample size of 12 per group rule of thumb for a pilot study. Pharm Stat 4(4): 287-291.
