 Research Article
Abstract
Quantification neutralizing antibodies methods are crucial in the development and evaluation of new antiviral vaccines effectiveness and the assay most commonly used is the Plaque-Reduction Neutralization Test (PRNT). However, PRNT and its variations like FRNT (or microPRN) are time-consuming, not amenable to a large number of samples and difficult to adapt to a high throughput routine. Furthermore, the assay tends to have large variations among different analysts due to visual plaque recognition and manual counting errors. Therefore, providing a faster and more accurate counting for the neutralizing antibodies assays would minimize human inherent variations. Thus, innovations such as the automation at critical steps can increase throughput, reduce rework and generate more accurate results for vaccines developing and diagnosis. Companies specialized in microscopy, robotics and information technology developed robust systems able to standardize the image acquisition and processing for neutralization assays, which could aid the public health response to emerging viral diseases. In this context, automated systems have been used to obtain images and to identify morphological patterns setting the best ranges for the structures of interest, such as circularity, size, color intensity and other attributes.
Here we investigate the use of automated image acquisition and quantification systems on increasing microPRN assays throughput and improving their results accuracy. MicroPRN assays are performed on 96-well microplates, and a plate picture is taken for virus identification, quantification and further calculation of neutralizing antibodies titer in non-clinical samples. To validate the automated methods, their results must be compared to manual counting method and there may be maximum of 5% in R-square coefficient. The automated systems showed efficiency on acquiring highresolution images from DENV microPRN assays. It generated a 3-fold increasing in results generation (450/month to around 1200/month) and helped reducing the assay retest rate from 50% to around 15%. Furthermore, these systems demonstrated efficient time consuming on acquiring images, good correlation with FFU manual counting and a much faster time on quantifying these viral structures. Comparing both automated systems to each other, it was observed a proper equivalence on FFU absolute counting and among other parameters. These data demonstrate that the automated high-resolution imaging platform, engineered to meet the quality requirements for image-based testing, saves time using robotics and microscopy automation and provides more accurate and reliable results.
Introduction
Neutralization assays remains the gold standard method for measuring neutralizing antibodies against many pathogens [1], including several viruses [2,3,4]. Some of these assays reveal the virus plaques by applying a vital stain to cells, such as PRNT (Plaque Reduction Neutralization Test), and other identify virus immunofocus using virus-specific monoclonal antibodies, case of FRNT (Focus Reduction Neutralization Test) or microPRN. To quantify antibodies against Dengue virus, for example, WHO recommends using 96-well plates, observing them with naked eyes or under the microscope [1] and counting plaques manually [5]. However, to achieve the target number of PFU/well, virus plaques must be smaller to prevent overlap, which turns more difficult the manual counting [1]. Besides the plaque overlap issue, most of these neutralization assays have other bottlenecks that make it difficult to obtain the measure output, such as the generation of numerical results (counting) from the visual results (images). In many cases, these tests are performed in replicates and / or different conditions, originating a large amount of data, which, if analyzed manually, are compounded by potential human errors. This is one of the reasons why elevated time and resources (material and human) need to be directed towards the performance of serum neutralization tests, including the stages of image acquisition and quantification.
Manual image acquisition and quantification processes for serum neutralization assays can be standardized in order to meet limited demands. However, besides showing to be extremely expensive in terms of time and resources spent, these manual processes are not feasible when demands are increased [6]. At such times, results and reports may not be released in a timely manner or, in the worst cases, the standardization and traceability of processes may be compromised, which may generate unreliable data. In a scenario of constant increases in demands, there is a need for a suitability of the processes of image acquisition and quantification, including the routine of neutralization tests, in order to convert visual results into final data in a timely manner and with available resources. To this end, companies specialized in microscopy, robotics and information technology have joined forces with large research and development institutes in the health field to develop customizable systems - capable of being configured to meet specific demands - and, at the same time, generic – ready to be adapted for different contexts [1,6,7].
Automated counters for immunostained plaques are available, some of them free, other requiring considerable investments, but all still demonstrate multiple challenges at the moment1. CTL Analyzers (Cellular Technology Ltd.) presents the commercial plaque counting software ImmunoSpot and Biospot, in which researchers optimize ranges of values for objects intensity and size and develop methods to count virus structures for each object of study [8,9]. However, for researchers working with diverse strains with varied plaque phenotypes, such programs are often difficult to optimize and standardize1. Additionally, commercial counters are often proprietary and expensive. Another option, ImageJ® is a free, open-source general image-processing tool that allows for plaque counting on a personal computer [10]. Although the application has multiple tools for different needs, it is configured in JavaScript, which obligates the users having at least a basic knowledge in that language. The American National Institute of Health (NIH), in partnership with several universities and medical research centers, developed the Viridot, an open-source automated package in R (free software environment) [11] for immunostained viral plaque counting and neutralizing antibody titer estimation [1].
Despite being relatively simple, it has limitations regarding to record activities (audit trails), especially when we consider the growing quality requirements of many regulatory agencies about the equipment and software use and validation processes [12-17]. In this context, the automation team of Laboratory of Virological Technology (LATEV) from Bio-Manguinhos/Fiocruz, in partnership with other companies, tests and have introduced automated systems to provide solutions on image acquisition and processing. These systems are running inside a service platform at our facilities, and this model was customized to attend the demands of neutralization assays, that come from LATEV projects and from external clients as well. In this work, it is assessed the equivalence between the automated systems and the human operators on generating precise results, as well as the improvement in throughput and accuracy of these results generation.
Materials and Methods
Hardware components
The automated image acquisition and analysis systems used in LATEV are composed of (1) an optical microscope with motorized stage, (2) a high-performance CCD camera (3) a robotic arm attached to a base, in which there are also (4) stackers, in which the plates are pilled and (5) a high-capacity workstation, all of these elements delimited by (6) a closed optical cabin and supported on (7) a base anti-movements. These systems also have other important elements, such as magnetic locks on the cabin doors, security locks for the operation of the robotic arm and an emergency button to interrupt the image acquisition process at any of its stages. Associated with the physical systems, there are software used for the configuration and execution of the equipment’s actions.
General Configurations
The configurations executed in the associated software are based on the interaction between the image acquisition / manual quantification operator - the key user of the system - and the software tools developed with specific artificial intelligence. The settings made during this interaction are designated as teaching processes, since the operator’s background guides fine adjustments in order to teach the types and intensities of actions that will be performed by the equipment. For the initial system configuration, several parameters – such as circularity, diameter, color intensity and other - must be defined in order to achieve the best conditions for acquiring the images and, subsequently, to ensure that these same conditions are reproduced before each new image acquisition. To accomplish this step and generate clear images, the appropriate balance for the signal-to-noise ratio, good brightness-contrast ratio and the proper balance of the primary colors of the microscope light beam are configured. This color balance is based on the RGB system defined in the microscope software [18,19].
Image Acquisition Settings
During this configuration, when the RGB balance is considered ideal by the image acquisition operator (visual analysis), a reference image with these values is saved. This reference image is then allocated to a specific virtual folder, located on the same server as the automation system’s computer. Before starting each new image acquisition, the responsible software searches the saved image as a reference of the RGB system, interprets that and configures the camera and microscope so that they have values varying through a delimited range. After configuring the color balance of the RGB system, it is necessary to configure spatial coordinates for the motorized stage of the equipment and the position of the holes in the well plates whose images will be acquired. In this step known generically as Mark and Find, the operator teaches the correct positions of the wells, as well as the distance between a well and the adjacent one, the so that, after the plate is placed on the stage by the robotic arm, the microscope objective starts the acquisition of images by the first well of the plate (A01 position) and that the motorized stage moves the plate respecting (1) the distance and (2) the correct sequence of the well [18,19].
Robotic Arm Movement Sequence
Once configured the stage and well plates spatial coordinates, the operator moves on to teach the coordinates and kinetic parameters of the robotic arm movement sequence. This step has the general objectives (1) to define which movements will be responsible for removing each plate from the stackers and placing it on the microscope stage and (2) to develop a fine adjustment to define how these movements will be carried out. All configured movements define the final sequence, which is saved in a specific virtual folder located in the same domain as the equipment’s computer [20]. Before starting each new image acquisition, the software responsible for the acquisition searches for the saved settings related to the robot sequence, and after the system has its RGB parameters calibrated, the robot’s movement sequence is performed to remove the plates from the stackers and place them on the microscope stage.
Teaching the Counting Process
The image quantification is performed when the operator teaches the system which value ranges should be considered correct for the parameters that will be used in the quantification of the images (teaching of quantification). The parameters considered in this step consist of characteristics related to viral lysis plaques (PFU) or viral foci (FFU) capable of differentiating those specific structures that must be counted from other non-specific structures that should not be included in the count. In this case, parameters such as roundness, size (diameter) and color intensity are configured by defining an interval, with maximum and minimum values. At the end of the quantification teaching process, the settings developed for a set of parameters are saved in a database, present on the server where the system’s computer is also located [21].
Reading Process
After teaching the quantification, the next step is reading the images, which is in fact their quantification. The reading process is based on the application of the parameters, and their respective value ranges, to the images acquired on the equipment. Using the reading tool, a particular teaching method is selected, as well as the images to be quantified [21]. The reading process is started and automatically applies the settings developed for that particular virus, studied by a specific assay, to quantify the virus structures present in the images. At the end of this step, the quantified images are saved in a specific virtual folder. In another folder, files are saved in .xls format, in which, for each acquired image, there is a table with the counting of all the wells in the photographed plate. In this way, automatic quantification, using Teaching & Reading tools, is able to convert acquired images (qualitative results) into data tables (quantitative results) in much less time than used in nonautomated quantifications.
Conclusion
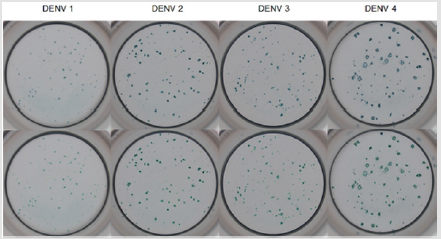
Figure 1: Example well images showing DENV FFUs with different phenotype, according to each virus strain. These assays were conducted in 96-well plates seeded with Vero cells (NIBSC), immunostained with 4G2, a peroxidase-labeled neutralizing antibody against flavivirus, with TrueBlue (KPL Sera Care, USA) as the peroxidase substrate. Plates were imaged with an optical microscope coupled to motorized stage and photographed by a high-resolution CCD camera.
The acquisition and quantification (counting) methods were developed using microPRN data of four strains of Dengue virus (DENV). Images acquired, demonstrating the different phenotypes among the four Dengue strains, are shown in Figure 1.
Automated Systems Qualification
Although the manual counting has the disadvantages mentioned previously, this approach is a proper reference to validate new techniques, such as the automated counting. Aiming at this validation, the automated counting performed by these systems were compared to the manual counting performed by two human operators in different days. The FFU counting comparison is represented in Figure 2. Coupled to the FFU counting comparison, the automated systems qualification also considered the time efficiency of each approach – automated system and human operator – in counting virus structures. Besides the time during which the counting were performed, this analysis also highlights the time required by the automated systems to acquire images from an entire 96-well plate. These data are illustrated in the Table 1.
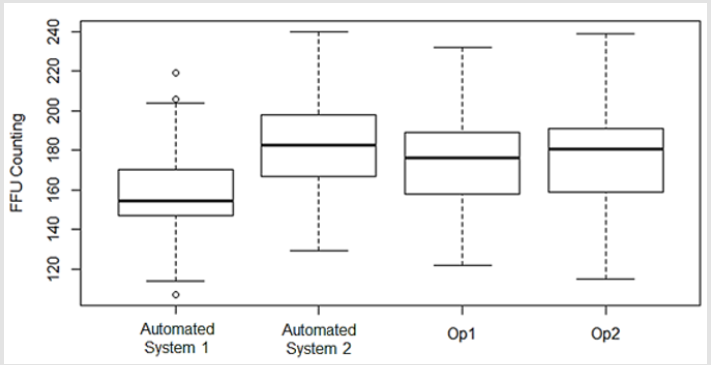
Figure 2: FFU counting comparing automated systems and two operators (manual counting). This comparison aims to qualify the automated systems, and do use software R.
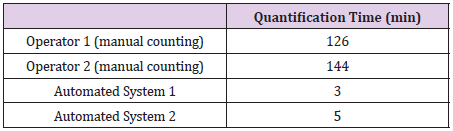
Table 1: Comparison of quantification time (in minutes) spent by the two reference operators (manual counting) and the automated systems.
Equivalence in The Automated Quantifications
In order to analyze the equivalence in FFU counting between two different operators (manual counting) and the automated systems, several 96-well plates were photographed, and the data were saved as square .JPG images of more than 2000 x 2000 pixels. Performing three independent runs, the viral structures were counted by the human operators and by the automated systems. The counting from one 96-well plate is represented in the Figure 3. In addition to the FFU raw values, other FFU counting indicators were used in this analysis, such as average, standard deviation, Coefficient of Variation (CV), maximum and minimum counting values, in order to compare both automated systems during the counting of the runs mentioned previously. Table 2 shows the comparisons of these indicators.
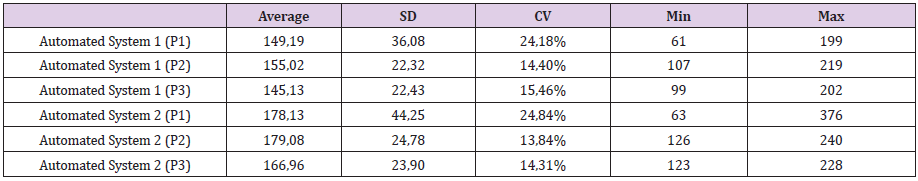
Table 2: Indicators from the plates counting performed at both automated systems. Three independent running (P1, P2 and P3) had their counting average, standard deviation (SD), coefficient of variation (CV) and minimum and maximum values calculated, and these values are listed in the table. Data analyzed in R free software.
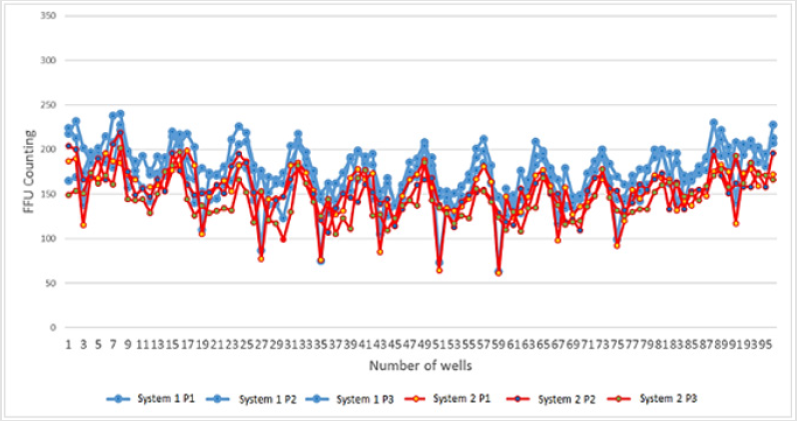
Figure 3: FFU counting from three independent running (P1, P2 and P3), quantified at Automated System 1 (blue spots) and Automated System 2 (red spots), are plotted in the graph. Each point represents one of the 96 wells in each well plate.
Discussion
In this study, we have presented evidences of how automated systems, applied to the neutralization assays’ routine, are able to increase the throughput and lend accuracy to the results generation. These systems are developed and introduced to the neutralization routine by LATEV’s team, in partnership with other companies, in order to create an automation platform, which offers services of acquiring and processing images to internal projects and to external clients as well. Unlike other solutions like CTL software, that could offer a fast image acquisition but fails in the generation of high-resolution pictures, our data clearly show the quality of neutralizing assays images generated by our automated platform. This high-resolution factor, in our understanding, plays a major role in the FFU counting step, once each pixel of the captured images will be analyzed by the configured parameters. This way, the more details the images have, more accurate will be their quantification. As already pointed out previously, even though it’s the gold standard tool for neutralizing assays, the manual counting has several disadvantages that carry the researchers and operator to look for a more effective approach [22].
However, the manual counting is still the best reference to validate new methods. The data collected in this work show a good correlation between the manual counting – performed by human operators – and the automated counting – provided by our systems after the proper parameters configuration. Besides this equivalence, the time consumed by the systems to perform the counting is hugely smaller than that done by the human operators. This way, the potential errors from manual counting are mitigated and the human labor could be allocated to other key activities [23]. Introduced the automated systems with the purpose of acquiring and quantifying images from neutralization assays, it is crucial to assure that these systems are equivalent to each other. The FFU absolute values and other parameters measured in the results generated at these systems demonstrated that they can be used together or one functioning like a backup for the other. Taken as a whole, these data indicate that the automated systems, developed and introduced by the automation team and partners in the neutralization assays routine of LATEV, are capable to generate high-quality images and they have the necessary reliability when their FFU counting are compared to manual counting. The devices have been shown an important ability to increase the amount of analyzed assays in short periods, as well as the improvement of the data generation throughput with much less rework [24-25].
References
- Katzelnick LC, Coello Escoto A, McElvany BD, Chávez C, Salje H, et al. (2018) Viridot: An automated virus plaque (immunofocus) counter for the measurement of serological neutralizing responses with application to dengue virus. Plos Negl Trop Dis 12(10).
- Russell PK, Nisalak A, Sukhavachana P, Vivona S (1967) A plaque reduction test for dengue virus neutralizing antibodies. I Immunol 99(2): 285-290.
- Roehrig JT, Hombach J, Barret AD (2008) Guidelines for plaque reduction neutralization testing of human antibodies to dengue viruses. Viral Immunol 21(2): 123-132.
- Morens DM, Halstead SB, Repik PM, Putvatana R, Raybourne N (1985) Simplifies Plaque reduction neutralization assay for dengue viruses by semimicro methods in BHK-21 cells: comparison of BHK suspension test with standard plaque reduction neutralization. J Clin Microbiol 22(2): 250-254.
- (2007) Guidelines for plaque reduction neutralization testing of human antibodies to dengue virus. World Health Organization.
- Koishi AC, Suzukawa AA, Zanluca C, Camacho DE, Comach G, et al. (2018) Development and evaluation of a novel high-throughput image-based fluorescent neutralization test for detection of Zika virus infection. PloS Negl Trop Dis 12(3): 37-45.
- Timiryasova TM, Bonaparte MI, Luo P, Zedar R, Hu Tb, et al. (2013) Optimization and Validation of a Plaque Reduction Neutralization Test for the Detection of Neutralizing Antibodies to Four Serotypes of Dengue Virus Used in Support of Dengue Vaccine Development. Am J Trop Med Hyg 88(5): 962-970.
- Thomas SJ, Nisalak A, Anderson KB, Libraty DH, Kalayanarooj S, et al. (2009) Dengue Plaque Reduction Neutralization Test (PRNT) in Primary and Secondary Dengue Virus Infections: How Alterations in Assay Conditions Impact Performance. Am J Trop Med Hyg 81(5): 825-833.
- Huang ML, Chiang PS, Luo ST, Liou GY, Lee MS (2010) Development of a high-throughput assay for measuring serum neutralizing antibody against enterovirus 71. Journal of Virology Methods 165: 42-45.
- Eschbaumer M, Law S, Solis C, Chernick A, van der Meer F, et al. (2014) Rapid detection of neutralizing antibodies against bovine viral diarrhoea virus using quantitative high-content screening. Journal of Virology Methods 198: 56-63.
- Smith SA, de Alwis R, Kose N, Durbin AP, Whitehead SS, et al. (2013) Human monoclonal antibodies derived from memory B cells following live attenuated dengue virus vaccination or natural infection exhibit similar characteristics. J Infect Dis 207(12): 1898-1908.
- Sukupolvi Petty S, Brien JD, Austin SK, Shrestha B, Swayne S, et al. (2013) Functional Analysis of Antibodies against Dengue Virus Type 4 Reveals Strain-Dependent Epitope Exposure That Impacts Neutralization and Protection. J Virol 87(16): 8826-8842.
- Rasband WS ImageJ In National Institutes of Health Bethesda Maryland USA.
- (2015) R: A language and environment for statistical computing. R Foundation for Statistical Computing.
- (2001) The Good Automated Manufacturing Practice (GAMP) Guide for Validation of 344 Automated Systems.
- (2000) ISO/IEC 17799: 2000 (BS 7799:2000) Information technology – Code of practice for information security management. ISO.
- (2007) ISO 14971: 2002 Medical Devices- Application of risk management to medical devices. ISO.
- (2002) Pharmaceutical CGMPs for the 21st Century: A Risk-Based Approach. Pharmaceutical online.
- (2010) National Health Surveillance Agency (ANVISA). Guia de Validação de Sistemas Computadorizados de Abril de.
- (2008) GAMP 5 A Risk-Based Approach to Compliant GxP Computerized Systems. ISPE.
- Salje H, Rodriguez Barraquer I, Rainwater-Lovett K, Nisalak A, Thaisomboonsuk B, et al. (2014) Variability in dengue titer estimates from plaque reduction neutralization tests poses a challenge to epidemiological studies and vaccine development. PLoS Negl Trop Dis 8(6).
- EasyLab (GSK) Rixensart Belgium 2009 Teaching AxioVision Dengue for Image Analysis in Automated Systems.
- Carl Zeiss MicroImaging GmbH, Jena (2009) AxioVision - Perform to perfection: The microscope software for industrial application - from image acquisition through to image analysis, It’s in a dimension of its own.
- Carl Zeiss Microscopy GmbH, Jena (2014) ZEN 2 (blue edition) Software guide.
- Peak Robots (2008) KiNEDx Robot California USA. User-s Manual.
