 Research Article
Abstract
Tumor is an abnormal mass of tissue, which could be solid, or fluid filled. Migration Inhibitory Factor (MIF) is a ubiquitously expressed cytokine in tumor. High levels of MIF expression have been observed in several human cancers and expression correlates with tumor grading and clinical prognosis. This experiment was designed to see the size of tumor, cell population, arginase and nitric oxide activity and production and presence of pro and anti-inflammatory cytokine in cell and serum of MIF wild type and MIF- /- mouse injected of colon carcinoma tumor cell line. Bacterial LPS is used to stimulate cells for nitric oxide and cytokine assay. The average size of the tumor in eight mice and the cell count was larger in wild type mice. Up on FACS analysis Live gate percentage of cell population of MIF -/- mouse seem to have a bit higher MHCII High (TAMS) and MHCII low (TAMS) than the WT mouse. Median Fluorescence Intensity measured shifts mainly to the left indicating lower or less CD74 expression as compared to the isotype. NO production is higher in tumor cell supernatant stimulated by LPS as compared to the non-stimulated ones but negative for arginase activity. The result of serum cytokine IL-6 and IL-10 concentration is negative. The IL-6 and IL-10 concentration is higher in both wild type and MIF-/- mouse tumor cell supernatant stimulated with LPS as compared to the non-stimulated ones but with no cytokine production in non-stimulated. All the results except the tumor size and the manual cell count are statistically in significant, which might require further study, especially for this particular model.
Introduction
Cancer is known medically as a malignant neoplasm, which is a broad group of various diseases that involve unregulated cell growth. The cancer cells can grow and divide without control and are able to invade tissues. Tumor is an abnormal mass of tissue, which could be solid or fluid-field. Tumors can be Benign (not cancerous), pre-malignant (pre-cancerous), or Malignant (cancerous). Unlike Benign tumors, Malignant (cancerous) tumors tend to grow fast; they are ambitious and spread (metastasize). This kind of tumors potentially results in death [1]. Macrophage Migration Inhibitory Factor (MIF) was originally identified in 1966 by Bloom and Bennett as a pro-inflammatory cytokine involved in the inhibition of macrophage motility. Since then, studies have investigated the functional contribution of this pro-inflammatory cytokine in several immune diseases. In addition to inflammatory diseases, MIF has also been demonstrated to be overexpressed in solid tumors, such as lung, colorectal, breast, cervical, prostate, and head and neck cancer, where it may exhibit a crucial function in tumor progression (cell proliferation and invasiveness) and tumor induced angiogenesis.
Macrophage-Migration Inhibitory Factor (MIF) is a ubiquitously expressed cytokine with a variety of mitogenic and pro-inflammatory functions [2] and released by macrophages, T cells, and the pituitary gland during inflammatory responses. There are at least two distinct pro-inflammatory effects of MIF. First, MIF can “override” or counter-regulate the immuno-suppressive effects of steroids [3]. Second, the addition of MIF enhances Tumor Necrosis Factor (TNF) and nitric oxide production by Lipopolysaccharide (LPS)-stimulated macrophages. Conversely, MIF- deficient peritoneal macrophages express less of these inflammatory mediators than wild-type macrophages [4]. Studies [5] have indicated MIF as a regulator of cell growth and apoptosis. MIF expression patterns change during organogenesis and tissue specification and they are influenced by growth inhibition in vivo [6]. High levels of MIF expression have been observed in several human cancers and expression correlates with tumor grading and clinical prognosis [7]. Kleemann et al. [8] have provided evidence for an intracellular function of MIF in the regulation of cell growth. Cell- based genetic screens [9], have demonstrated that MIF interacts with the p53 tumor suppressor by inhibiting p53- responsive gene activation and apoptosis. The high frequencies of mutations in the p53 gene that are found in human tumors [10], and the apparent correlation of p53 loss with tumor aggressiveness [11] emphasize the importance of p53 as a ‘‘gatekeeper’’ in the development of neoplastic disease. Accordingly, it has been hypothesized that the bypass of p53 regulatory functions by MIF at sites of chronic inflammation might impair the normal response to genetic damage, enhance cell proliferation, and promote the accumulation of oncogenic mutations [12].
There for, the purpose of this experiment was:
a) To see the size of tumor mass between wild type and MIF- /- mice
b) To quantify the population of cells in neoplastic growth of MIF wild type and MIF- /- mice
c) To detect the activity of Arginase and production of nitric oxide by cell population harvested from both MIF wild type and MIF- /- mouse
d) To detect the production of pro inflammatory (IL- 6,INFgamma) and anti-inflammatory (IL-10) cytokines from cell population collected from tumor suspension from both MIF wild type and MIF- /- mouse and serum collected from both MIF wild type and MIF- /- mouse and in the presence or absence of bacterial membrane LPS.
Materials and Methods
Tissue and Serum Sample Preparation
Two weeks before the experiment eight mice of which four of them are wild type and the other four MIF-/- were subcutaneously injected with MC38 colon carcinoma cells. The subcutaneous solid tumors are measured after it is removed from the mouse for both MIF wild type and MIF- /- mouse. These tissue samples were prepared according to the protocol and pooled together from eight samples to four samples of which two for wild type and two for MIF deficient mouse. Blood was also collected from eight (four wild type and four MIF deficient) mouse and serum was collected according to the protocol for further analysis.
Cell Count
Manual Cell Count: Cells were harvested, centrifuged and resuspended in PBS. The numbers of viable cells were assessed by Trypan blue (Sigma) staining and counted by using a Neubauer haemocytometer.
FACS Analysis: For the FACS analysis, tumor single cell suspensions of wild type and MIF deficient cells were stained with Abs for CD8-PerCP5.5(cytotoxic T-cell marker), MHCIIper CP(macrophage marker), CD11b-PECY7( all myeloid cells marker),CD4-APC(T-helper cell marker), LY6C-APC(monocyte marker) Cells were gated then forward and side scatter and all myeloid cells (CD11b) were identified then going to the sub population MHCII high TAMS, MHCII low TAMS, immature macrophages, granulocytes and monocytes were the one identified. The three-color samples were acquired using a FACS Canto (BD Biosciences, San Jose, CA) equipped with Diva software. Data were analyzed with Flowjo (Tree Star, Ashland, OR) software. Additionally, to determine the change in median fluorescent intensity the OD value of Isotype minus the CD 74 expressing cells was also calculated.
Arginase Activity
To determine the arginase activity of the tumor cell, cells were collected from both wild type and MIF deficient mice and prepared according to the protocol and the optical density was measured and compared to the standard. Arginase activity was quantified in cell lysates by measuring the production of urea using the Quanti Chrom Arginase Assay Kit (DARG-200; Bioassays Systems).
Nitric Oxide Activity
To determine the nitric oxide production of the tumor cell, cells were collected from both wild type and MIF deficient mice and prepared according to the protocol and the optical density was measured and compared to the standard. Nitrite concentrations in culture supernatants were determined using Griess reagent (Sigma-Aldrich).
Cytokines Assay Using Elisa
Cytokine concentration was determined in the culture supernatants and in the sera by ELISA. Tumor-bearing MIF−/− and MIF+/+ mice cells were plated in flat bottom 96-well plates, and then two MIF−/− , two MIF+/+ mice and one tumor cell line MC38 stimulated with bacterial Lipopolysaccharide (LPS) and two MIF−/− , two MIF+/+ mice and one tumor cell line MC38 with no stimulation of bacterial LPS was incubated for 48 hours. Levels of IL-6, IFN-γ and IL-10 in the culture supernatants and Serum cytokine of four MIF−/− and four MIF+/+ mice were also determined according to manufacturers’ instructions.
Statistical Analysis
GraphPad Prism 6.0 software (GraphPad Prism Software, La Jolla, CA) was used for all statistical analyses. Comparisons between groups were done by multiple Student t- tests. For all tests, statistical significance was assumed where p<0.05.
Results
Tumor Size
The average size of the tumor in eight mice was calculated by the formula (Dxd2) x3 .14/6 where it is larger in wild type mice than MIF-/- ones (Figure 1). However, the size difference is statistically insignificant at p<0.005.
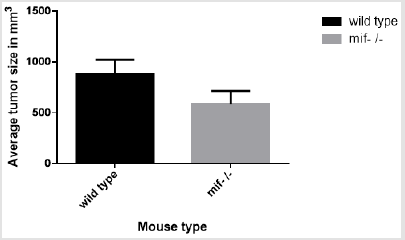
figure 1: Comparison of Tumor size between wild type and MIF-/- mouse.
Cell Count
Manual Cell Count: Cell were counted from two wild type and two MIF-/- mouse in neubarcytometer and calculated by the formula nx104 x dilution factor(10 in this case)x1. The computed average number of cells in wild type mouse is higher than MIF-/- mouse (Figure 2).This result is statistically significant with P=0,015 at 5% significant level.
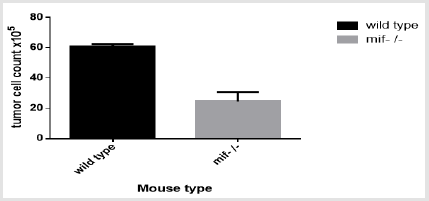
figure 2: Average number of cells for wild type and MIF- /- mouse injected with colon carcinoma
FACS analysis
A. Getting Strategy: The FACS analysis was done to compare the expression of macrophages, monocytes, and Tumor Associated Macrophage (TAMs) population between MIF deficient and wild type mouse injected of colon carcinoma tumor cell line. It uses SSC/FSC scatters for the selection of a live get in the selected population (52.3%) (Figure3A). Within this population there were two sub population of CD11b which gives positive fluorescence Signal for PE CY7 fluorescence and negative signal for PE CY7 fluorescence which are classified to be CD11b+ve(46.0% )and CD11b-ve(44.9%). Within the CD11b+ve the myeloid cell population which express both LY6C /MHCII scatters but with different strength. In this sub population monocytes shares (1.41%) (High LY6C /low MHCII expression), MHCII High (TAMS) (56.8%) (Low LY6C /high MHCII expression), MHCII low (19.6%) (TAMS) (Low LY6C /low MHCII expression) where as immature macrophages shares (7.84%) (High LY6C expression) (Figure 3B & 3C). The second sub population (CD11b negative) comprises 44.9% of the live gate and consists of CD4Tcell (5.2%) (High APC expression) and CD8 Tcell (2.41%) (high PERCP5.5 expression) (Figure 3D & 3E).
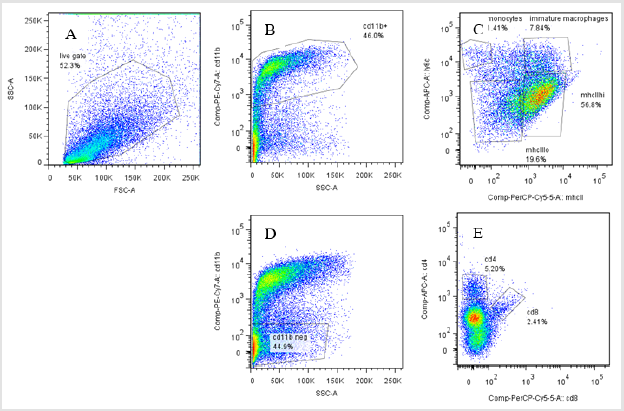
figure 3: FACS analysis cell population from MIF deficient and wild type mice, different population and sub populations are indicated starting from the live get to the final individual cells with different marker expression ability.
B. Live Gate Population of FACS Analysis: The result in the graph below indicates that live gate percentage of cell population of MIF -/- mouse seem to have a bit higher (MHCII Hi(TAMS) and MHCII low (TAMS)) than the WT mouse. The other percentage cell populations within the live gate are of higher in the wild type mouse (Figure 4). This difference is not statistically significant with a significance level of alpha 0.05 between MIF-/- and WT mouse cell population.
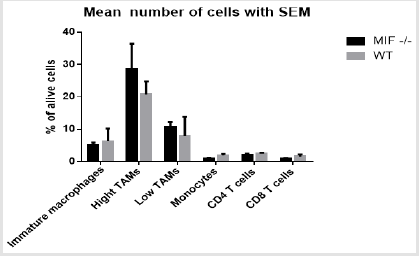
figure 4: The mean live cells percentage of MIF deficient and wild type mouse injected of colon carcinoma.
C. The Median fluorescence intensity: The delta median fluorescent intensity of the myeloid cells was obtained by subtracting the fluorescent intensity of both MIF-/- and wild type myeloid subpopulation from the isotype flourcent intensity. In this experiment, the median fluorescent intensity of cell population from wild type mice is higher than the MIF deficient mouse in all cell types (Figure 5). Although there is increment in the delta MFI, it is not statistically significant at alpha 0.05 significance level. Basically what the MFI is supposed to measure is the shift in fluorescence intensity of a population of cells. In this cases where the entire population stained with different levels of an antibody and the control isotype. The histogram below demonstrates a shift mainly to the left indicating lower or less CD74 expression (blue curve) as compared to the isotype (red curve) (Figure 6).
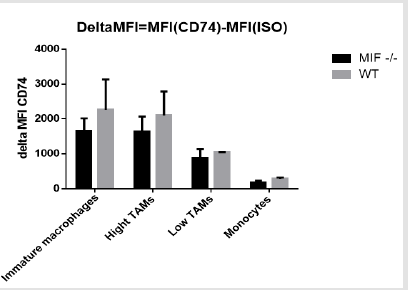
figure 5: The change in median fluorescent intensity of cells in both MIF deficient and wild type mouse.
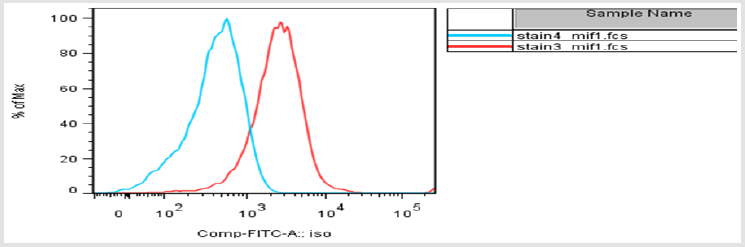
figure 6: Histogram showing a change in MFI of CD74 expressing cells compared to the isotype. CD74 Expression- Blue; Isotype- Red.
Arginase Assay
We performed Arginase assay for all (wild type, MIF-/- and MC38 tumor cell line) samples but all samples were negative for the assay. This might be related with our tumor microenvironment which donot have enough mature myeloid cell which are responsible for the production of arginase.
Nitric Oxide Assay
The assay was performed on tumor cell supernatant and MC38 tumor cell line both with and without stimulation of bacterial lipopolysaccharide. The result obtained from the assay indicates that the average NO production is higher in tumor cell supernatant stimulated by LPS as compared to the non stimulated ones. Within the stimulated one the production is higher in MIF-/- mice. The result of the MC38 tumor cell line indicates similarly a bit higher NO production in the stimulated than the non-stimulated ones (Figure 7). Although the result shows difference between the stimulated and the non-stimulated one, statistically it is not significant where p>0.05 at 5% significance level.
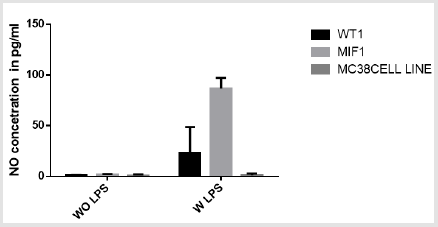
figure 7: The graph shows the concentration of nitric oxide production in cell from wild type mice, MIF-/- and tumor cell line MC 38 with and without stimulation of lipopolysaccharide. WOLPS- without lipopolysaccharide stimulation, WLPS-with lipopolysaccharide stimulation.
Sandwich ELISA Assay
Sandwich ELISA was used to determine the concentration of pro and anti-inflammatory cytokines in serum, stimulated and non-stimulated tumor cell and MC38 tumor cell line with LPS. The specific cytokines tested were IL6, IL10 and interferon gamma of which all our samples seem to be negative for interferon gamma and not included in this result.
IL-6 Concentration: ELISA assay was performed to detect the serum and tumor cell supernatant IL6 cytokine concentration of wild type and MIF-/- mouse and MC38 tumor cell line. One group of the tumor cell supernatant and MC38 tumor cell lines are subjected for LPS stimulation and the other replica without stimulation. The result of serum cytokine (IL6) concentration is negative. The IL 6 concentration is higher in wild type and MIF-/- mouse tumor cell supernatant stimulated with LPS as compared to the non-stimulated ones. Within the stimulated one the production is higher in MIF- /- than the wild type mouse. Those mouse groups who were not stimulated with LPS had low concentration where only the MIF-/- mouse shows positive result but completely negative for wild type mouse (Figure 8). Although the result indicates a difference in the stimulated and the non-stimulated one, statistically the difference is not significant where p>0.05 at 5%significance level.
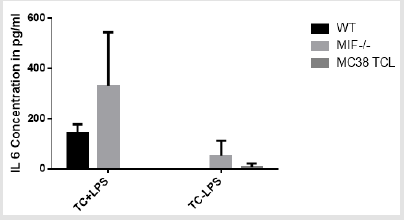
figure 8: Bar graph showing IL 6 concentration in cells (tumor supernatant, ) and serum of wild type and MIF- /- mouse and MC 38 tumor cell line with or without LPS stimulation. Tumor cell +LPS = cells stimulated by lipopolysaccharide; Tumor cell - LPS= cells not stimulated by lipopolysaccharide.
IL-10 Concentration: ELISA assay was performed to detect the serum and tumor cell supernatant IL10 cytokine concentration of wild type and MIF-/- mouse and MC38 tumor cell line. One group of the tumor cell supernatant and MC38 tumor cell lines are subjected for LPS stimulation and the other replica without stimulation. The result of serum cytokine (IL10) concentration in all MIF-/- and in most wild type mouse is negative but with negligible concentration in only one of the wild type. The IL 10 concentration is higher in wild type and MIF-/- mouse tumor cell supernatant stimulated with LPS as compared to the non-stimulated ones. Within the stimulated one, the production is much higher in MIF-/- than the wild type mouse. Those mouse groups who were not stimulated with LPS were negative in all wild type and MIF-/- mouse where only one of the MIF-/- has positive result (Figure 9). Although the result indicates a difference in the stimulated and the non-stimulated one, statistically the difference is not significant where p>0.05 at 5%significance level.
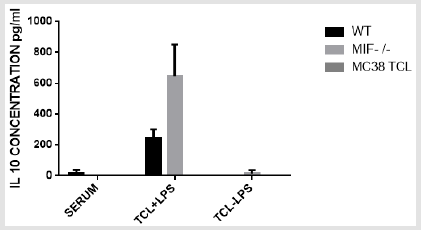
figure 9: Bar graph showing IL 10 concentration in cells (tumor supernatant) and serum of wild type and MIF- /- mouse and MC 38 tumor cell line with or without LPS stimulation. TCL +LPS = Tumor Cells Stimulated with Lipopolysaccharide TCL - LPS= Tumor Cells Not Stimulated with Lipopolysaccharide
Discussions
It is clearly seen that the size of solid tumor in wild type mouse is much greater than those of MIF deficient one. This might be due to MIFs role suppressing P53 which is involved in apoptosis and result in tumor development or any other factor involved in the tumor micro environment. The MIF-dependent increase in cell count of colon carcinoma might result from either increased recruitment of these cells into the tumor or differentiation of the myeloid cells toward the monocytic phenotype, perhaps within the tumor. The basis of a FACS analysis is a labelled (colored) suspension of individual cells which passes a focused laser beam. Capillary forces cause the cells to pass the flow cell, where the labels are stimulated by the laser light. The emitted fluorescent light from the fluorophores (coupled to the antibodies) and the scattered-light are detected separately. The gating strategy comprises of all the population from which the live gate population were identified as CD11b+ve and CD11b-ve.Furher specific marker analysis revealed that there are immature macrophages, Monocytes, MHCIIh (TAMS) and MHCII l (TAMS) in the CD11b+ve subpopulation and CD4+Tcells and CD8+Tcells in the CD11b-ve sub population. In this experiment, it was observed that MIF-dependent differences in the population of cell in the tumor microenvironment. Probably some myeloid cells to have a higher capacity to suppress host anti-tumor response and ultimately supporting increased tumor growth and metastasis in wild type. Therefore, MIF contributes to the prevalence of these cells within the tumor suggests a possible mechanism through which MIF promotes tumor progression by influencing the tumor microenvironment whereas the higher values of High and low TAMS in MIF-/- may be influenced by MIF of tumor cell origin. But the increase in cell population is not statistically significant which might be good if the sample size will be increased.
The higher median fluorescent intensity of cell population from wild type (MIF+/+) mice probably indicates these cells are expressing the CD74 than the MIF deficient mouse. The unexpected CD74 expression of MIF-/- mouse is probably due MIF acquired from colon carcinoma tumor cells lines that are injected to them. The high level of NO in tumor cells stimulated by LPS might be related to the absence of arginase which has a down regulation effect on its production. The pro-inflammatory cytokine IL-6 is another proinflammatory cytokine which has been described to participate in tumorigenic processes, contributing both to tumor progression, as well as to anti-tumor immune responses. Its presence might activate different major pathways of cell proliferation participating in the induction of tumor growth, metastasis, and resistance to chemotherapy in a variety of wild type tumor cells where as in MIF-/- mouse it might suppress the pro-inflammatory activity. The higher concentration of anti-inflammatory cytokine IL-10 produced in stimulated tumor cell supernatant of MIF-/- and wild type mouse might probably describe that the cells started to react and act on the colon carcinoma cell line injected.
Conclusions
Understanding the role of MIF in neoplastic development and progression is complicated by the pleiotropic influences that MIF plays in many tumorigenic processes. This experiment was conducted to understand the contribution of MIF in tumor development, its effect in tumor micro environment as well as the systemic involvement. Knowledge and detailed investigation of this cytokine might help to design one possible and probably effective target to treat cancer. There for, further study should be performed in detail to unreveal the secrete and to help and combat related issues.
References
- Nordqvist C (2012) What Is A Tumor? Medical News Today.
- Metz C N, Bucala R (1997) Role of macrophage migration inhibitory factor in the regulation of the immune response. Adv Immunol 66: 197-223.
- Calandra T, Bernhagen J, Metz CN, Spiegel LA, Bacher M, et al. (1995) MIF as a glucocorticoid-induced modulator of cytokine production. Nature 377(6544): 68-71.
- Bozza M, Satoskar AR, Lin G, Lu B, Humbles AA, et al. (1999) Targeted disruption of migration inhibitory factor gene reveals its critical role in sepsis. J Exp Med 189(2): 341-346.
- Kobayashi S, Satomura K, Levsky J M, Sreenath T, Wistow G J, et al. (1999) Expression pattern of macrophage migration inhibitory factor during embryogenesis. Mech Dev 84(1-2) 153-156.
- Fingerle Rowson G, Koch P, Bikoff R, Lin X, Metz C N, et al. (2003) Regulation of Macrophage Migration Inhibitory Factor Expression by Glucocorticoids in Vivo. Am J Pathol 162(1): 47-56.
- Markert J M, Fuller C M, Gillespie G Y, Bubien J K, McLean L A, et al. (2001) Differential gene expression profiling in human brain tumors. Physiol Genomics 5(1): 21-33.
- Kleemann R, Hausser A, Geiger G, Mischke R, Burger Kentischer A, et al. (2000) Intracellular action of the cytokine MIF to modulate AP-1 activity and the cell cycle through Jab1. Nature 408(6809): 211-216.
- Hudson J D, Shoaibi M A, Maestro R, Carnero A, Hannon, G J, et al. (1999) A proinflammatory cytokine inhibits p53 tumor suppressor activity. J Exp Med 190(10): 1375-1382.
- Vogelstein B, Lane D, Levine A J (2000) Surfing the p53 network. Nature 408(6810): 307-310.
- Levine A J (1997) p53, the cellular gatekeeper for growth and division. Cell 88(3): 323-331.
- Cordon Cardo C, Prives C (1999) At the crossroads of inflammation and tumorigenesis. J Exp Med 190(10): 1367-1370.
