 Short Communication
Abstract
This study examined the effects of obesity on dynamic plantar pressure distributions in children. Experimental data on body mass index (BMI) and plantar pressures were collected for 15 obese children and 15 non-obese children. 15 obese (age 9.8±2.0 y, BMI 25.8±3.8 kg/m2) children matched to 15 non-obese children (age 9.9±2.1 y, BMI 16.8±2.0 kg/m2), for age, weight, and height. Right, and left foot plantar pressures were obtained using a Foot scan platform, and foot scan software is used for plantar pressure measurements to calculate the peak force and pressure experienced under the area of each child’s feet during dynamic conditions. These variables were measured under ten regions of interest in each footprint: Lateral heel, Medial heel, Mid-foot, Metatarsal 5, Metatarsal 4, Metatarsal 3, Metatarsal 2, Metatarsal 1, Toes 2-5, Toe1. Descriptive statistics and one-way analysis with stepwise were used to analyze the data. While walking, the obese children generated significantly higher forces over all areas of their feet, except the toes. Despite distributing these higher forces over a significantly larger foot area when walking, the obese children experienced significantly higher plantar pressures in the mid-foot and under the second to fifth metatarsal heads compared to the non-obese children. The greatest effect of body weight on higher peak pressure in the obese children was found under the longitudinal arch of the foot and the metatarsal. Further studies are needed to investigate the structural and functional characteristics of children’s feet.
Keywords: Obesity; Foot scan; Platform; Plantar Pressure
Short Communication
Obesity is defined as the excess of body fat. This definition may vary depending on the region however in Western countries such as U.S and in many European countries it is defined by body mass index (BMI). The BMI is calculated by dividing the weight over the square of height. If the BMI is higher than 30 kg/m2 that indicates the obesity. Under that range is classified as overweight, average weight and underweight depending on values. During the walking, foot contacts the ground and produce vertical ground reaction force that can reach 120% of body weight [1]. An individual that is 67kg, walking 1.6km, would absorb 64.5 tones on each foot [2,3]. Because of this forces that is being absorbed by each foot, discomfort, pain, and pathologies might occur. The pain and pathologies that individual faces might aggravate due to additional mechanical loading caused by their mass [4-7]. Each obese individual’s gait clinically assessed based on the detection of their performance of daily life routines especially locomotor movement [8]. The plantar pressure distribution is a clinical tool to understand physical and functional implications of obesity. The effect of body weight on the plantar pressure is not yet clear. So, biomechanical analysis of gait is necessary to recognize how obesity influences weight-support activities. Consequently, the aim of this study was to compare dynamic plantar distribution between obese and non-obese children.
Material and Methods
In this study, 30 healthy male subjects were enrolled: 15 obese children, 15 non-obese children (Table 1). The mean age of the obese group was 9,8 years, and that of the non-obese group was 9,9 years. The obese group BMI was bigger than non-obese BMI. (Table 1) Obese children was significant than non-obese children in BMI. Plantar pressure data were collected from all subjects. A footscan® plate system (RsScan nv., 2m x 0.4m, 16384 sensors, 500 Hz, dynamic calibration with footscan® plate system) was mounted in the middle of an 8 m long track. The subjects walked barefoot at their own pace. All measurements were taken with the subjects walking barefoot over the plate. Three walks for each foot (three walks for each subject) were recorded and printed. Each print consisted of a time peak-pressure curve for ten regions of interest on the foot. The regions of interest, which were analyzed automatically by the system software, were lateral heel, medial heel, mid-foot, lateral (Metatarsal 5, Metatarsal 4), central (Metatarsal 3, Metatarsal 2, Metatarsal 1) and the toes 2-5, the toe 1(Figure1). The time variables were calculated as the ratio of time from the start of the stance to peak pressure under the region of interest and the total stance time. The pressure variables were calculated as the ratio of the peak pressure under the region of interest to the body weight (Figure 2). The parents signed a written informed consent, agreeing with their children’s participation in the study.
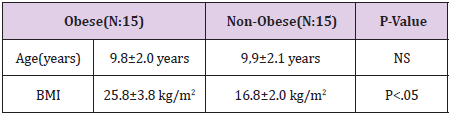
Table 1: Demographics of obese and non-obese children.
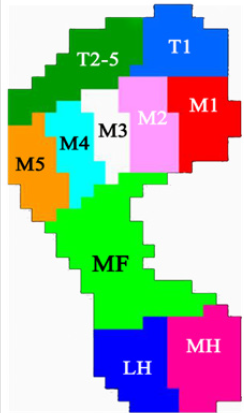
Figure 1: Representation of ten anatomical areas.
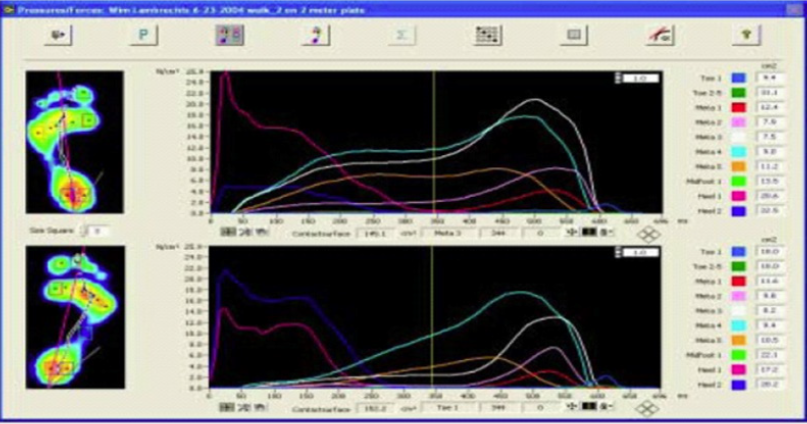
Figure 2: Graphical presentation of plantar pressure of foot regions by RS scan foot scan® systems.
Statistical Analysis
Means (SD) were calculated for different time and force variables. The differences within the groups and between the groups were compared using a one-way analysis of variance. Differences of p<0.05 were considered significant.
Result
There was a significant delay to the time of peak Pressure under lateral forefoot (Meta5, Meta4, Meta3), and toes in the obese children (Table 2). There was significantly longer contact time of the lateral heel in obese children. The BMI value obtained for obese children (25.8 ± 3.8 kg/m2) was significantly higher (p<0.01) than non-obese children (16.8±2.0 kg/m2). During walking, the obese children showed higher contact areas than the non-obese children with significant differences in all areas of the foot (p < 0.01). As for peak pressure, the obese children showed higher values, being statistically different from the non-obese children in all areas of the foot (p < 0.05). For maximum mean pressure, there were differences in the Metatarsal 3, Metatarsal 4, Metatarsal 5 forefoot areas, with higher values for the obese children. Table 2 represents the comparison between the two groups during gait.
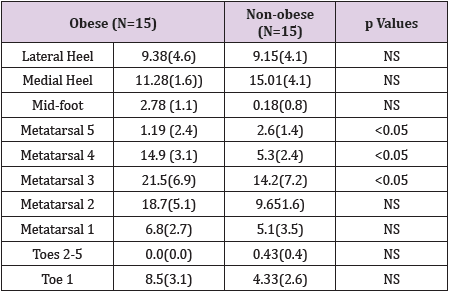
Table 2: Plantar Peak Pressure distribution of obese and nonobese children.
Note: Mean (SD); Newton/cm2; NS: No Significance P<0,05.
Discussion
The increased dynamic forces that generated from heel to forefoot were as expected in obese children. But the increased body mass did not affect the toes region (Toe1-5). The obese children show a significant increased foot contact area during gait, relative to the non-obese children. These results are compatible with Riddiford- Harland et al.’s studies about characteristics of prepubescent obese children’s feet, that is flatter and broader [9]. This increased midfoot contact area may cause by the difference between healthy mass children and obese children because of the fat pad obese children have under their feet. This pad may be to cushion the higher forces or might just has little functional significance. On the other hand, increased mid-foot area show deformity of obese children’s feet, which indicates collapsed arch and lead to future pathologies caused by greater mass.
Obese children in the present study generated significantly higher mean peak pressures under the mid-foot and third to fifth metatarsal heads, compared to their non-obese counterparts. Because obese children have flatter feet this cause increasing in the mid-foot pressure. The mid-foot region contacts the pressure platform, generating pressure data on this foot area. The peak pressures generated by the obese children for Metatarsal 3, Metatarsal 4, and Metatarsal 5 were high relative to other foot regions, as well as being significantly higher than the plantar pressures generated by the non-obese children. As these higher pressures are being experienced on smaller bony and ligamentous structures surrounding the second to fifth metatarsal heads, this may have negative consequences for the feet of obese child in terms of an increased risk of forefoot pathologies.
Conclusion
Based on the findings of the present study, it is postulated that obese children might be at an increased risk of developing foot discomfort and/or foot pathologies, such as stress fractures in the forefoot. It is recommended that the effects of obesity on the structural and functional characteristics of children’s feet be further investigated.
Declaration of Conflicting Interests
The authors declared no potential conflicts of interest to this study.
References
- Novelgmbh (1998) Novel-win (Version 08.7). Novel gmbh: Munich, Germany.
- Mann RA (1982) Biomechanics of running. American Academy of Orthopaedic Surgeons Symposium on the foot and leg in running sports. CV Mosby Company, St Louis, USA, p. 30-44.
- Cavanagh PR, Rodgers MM, Iiboshi A (1987) Pressure distribution under symptom-free feet during barefoot standing. Foot Ankle 7: 262-276.
- Gehlsen GM, Seger A (1980) Selected measures of angular displacement, strength, and flexibility in subjects with and without shin splints. Res Q Exerc Sport 51: 478-485.
- Messier SP, Pittala KA (1988) Etiologic factors associated with selected running injuries. Med Sci Sports Exerc 20: 501-505.
- Messier SP, Davies AB, Moore DT, Davis SE, Pack RJ, et al. (1994) Severe obesity: effects on foot mechanics during walking. Foot Ankle Int 15: 29-34.
- Viitasalo JT, Kvist M (1983) Some biomechanical aspects of the foot and ankle in athletes with and without shin splints. Am J Sports Med 11: 125-130.
- Hills AP, Hennig EM, Byrne NM, Steele JR (2002) The biomechanics of adiposity – structural and functional limitations of obesity and implications for movement. Obes Rev 3(1): 35-45.
- Riddiford Harland DL, Steele JR, Storlien LH (2000) Does obesity influence foot structure in prepubescent children? Int J Obes Relat Metab Disord 24: 541-544.
