 Research Article
Abstract
One of the main objectives of a clinical laboratory is getting accurate values. To quantify the hemolysis, the study of hemolytic index is a widespread practice. Due to a change of analyzers, the present hemolysis interference study is aiming to quantify the possible change in 73 tests performed by different techniques in such equipment: spectrophotometry, indirect potentiometric and immunological techniques. The tests were performed in Roche Diagnostics Cobas 8000 equipment following the protocol of the Spanish Society of Laboratory Medicine (SEQCml). The results were compared with those reported in the inserts provided by Roche Diagnostics of the different techniques. Interference was obtained for the following compounds: amylase, aspartate aminotransferase (AST), direct bilirubin (DBil), creatinine kinase (CK), alkaline phosphatase (ALP), iron, lactate dehydrogenase (LDH), lipase, phosphorus, potassium, triglycerides, folate, ultrasensitive troponin T (hs-cTnT), insulin and parathyroid hormone (PTH). Working with new analyzers, it is important to study the interference of the hemolysis on different analytical techniques, as it has an impact on the medical decision making. In clinical practice, it is recommended to determine the hemolytic index, to detect and quantify the interference by hemolysis, assessing the possible rejection of samples and providing reliable reports helping clinicians to interpret the results.
Keywords: Interference; Hemolysis; Biochemical; Immunochemistry
Abbreviations: AST: Aspartate Aminotransferase; DBil: Direct Bilirubin; CK: Creatinine Kinase; ALP: Alkaline Phosphatase; LDH: Lactate Dehydrogenase; PTH: Parathyroid Hormone; HI: Hemolytic Index; Alb: Albumin; ALT: Alanine Aminotransferase; AST: Aspartate Aminotransferase ALP: Amylase, Alkaline Phosphatase; GGT: Gamma Glutamyl Transferase; PAPPA: Pregnancy-Associated Plasma Protein A; TSH: Thyroid Stimulating Hormone; FT3: Free Triiodothyronine; FT4: free thyroxine; LH: Luteinizing Hormone; SHBG: Sex Hormone Binding Globulin; RCV: Reference Change Values, RF: Rheumatoid Factor
Introduction
One of the main objectives of a clinical laboratory is to inform exact and accurate values, since the results of the tests requested to the laboratory influence between 60-70% of medical decisions [1]. The presence of interferences, whether endogenous or exogenous, may produce erroneous results in a laboratory report that lead to a wrong diagnosis and even harmful clinical decisions. Among the possible endogenous interferences that may exist, hemolysis is one of the most important and in the main cause of preanalytical rejection of samples. The prevalence in our hospital (Getafe University Hospital, Madrid, Spain) in 2018 was 2.63% considering as hemolyzed serum those with hemolytic index ≥30mg/dL [2-4]. Hemolysis is a phenomenon that can take place both in vitro and in vivo [5]. In vitro hemolysis occurs when the red blood cells breaks in the blood sample, releasing its content to the blood. This process is called interference, and it could appear in every stage of the preanalytical process (from a wrong extraction to a wrong transport [2]). It is calculated that 97% of the samples that are received hemolyzed in the laboratory are due to and in vitro cause that could be avoidable [2,6].
The interference produced by hemolysis could be because of different mechanisms [2,5]:
1. Overlap in the measurement of the absorption spectrum (the released hemoglobin has high absorbance between 400- 600nm).
2. Chemical interferences by released of intracellular compounds (adenylate kinase) [7].
3. By released of intracellular compounds of the erythrocyte (aspartate aminotransferase, potassium) [6,7].
4. By dilution of the sample components (albumin) [6].
When a new analyzer arrives into a laboratory is especially important to determine which analytical tests are affected by hemolysis, in what quantity and at what concentration of hemoglobin. In this way clinically reliable results could be provided, while samples that are not going to report results according to the pathophysiological state of the patient could be rejected. In addition, it is recommended that each lab verify the information that suppliers provide about the interference by hemolysis in real work conditions [2]. The new equipment that arrives to our laboratory, Cobas® 8000 (Roche Diagnostics S.L.), provides serum index measuring the absorbance of the sample at multiple wavelengths (408, 588, 625 and 800nm) and performing different mathematical algorithms to provide the hemolytic, icteric and lipid index [8]. In interpreting the results of an analytical report, the distinction between analytically significant interference and clinically significant interference must always be established. “Clinically significant interference” is defined as those interferences that generally lead to significant errors in the interpretation of laboratory results [9,10]. The objective of this study is to establish the limits in which hemolysis produces a clinically significant interference and can lead to confusion in the interpretation of results as well as fails in patient safety.
Material and Methods
The analytical procedure was performed based on the protocol published by the Spanish Society of Laboratory Medicine (SEQCml): “Procedure for the study of interference by hemolysis, bilirubin and turbidity and for the verification of hemolysis, jaundice and lipemia indices”[11]. To carry out the interfering hemolysate, blood samples were obtained from healthy individuals in Vacutest® tubes with lithium heparin in which, after prior treatment according to the protocol, a hemoglobin concentration of 10 g/L was reached measured with a SYSMEX XN-10 analyzer (Sysmex S.L.).
Additionally, a pool of serum was obtained after centrifugation in Vacutest® tubes with separator gel and clot activator. The concentration obtained in this pool of serum without interference was attempted to be close to the clinical decision points for each of the analytical tests, and the results of the serum indices were observed to verify that both the hemolytic index, such as lipemic and icteric, were between 0 and 5 mg/dL. Then, and following the procedure, two mixtures were prepared: base serum with interfering (mixture 1) and base serum with sterile water (Versylene®Fresenius) (mixture 2) in a 19: 1 ratio for each of them. The interference curve was performed by adding increasing amounts of mixture 1 to mixture 2 to achieve hemolytic indices from 0 to 500 mg/dl, in 8 serial dilutions. Subsequently, the study was extended to an interference of 1000 mg/dl in those tests in which either the interferogram or the Roche® insert, reported possible interference at higher hemoglobin concentrations.
Once the interference was made, the concentrations of each analytical test to be studied were measured by duplicate. The hemolytic index (HI) was analyzed (measurement interval 5-1200 mg/dl) [12]. The study is performed in a Cobas® 8000 series modular autoanalyzer (Roche Diagnostics S.L.), consisting of c701 and c502 modules of photometric techniques, ISE modules of indirect potentiometry and e801 modules of immunochemical techniques. All analyzers had every necessary calibrations and internal controls according to the manufacturer. In addition, the monthly external quality assurance control provided by the SEQCml met the quality specifications required for all analytical techniques, including serum indexes.
The techniques analyzed were:
1. In the ISE modules the ions are analyzed: chlorine, sodium and potassium (K).
2. Through photometric techniques were analyzed: Albumin (Alb), alanine aminotransferase (ALT), aspartate aminotransferase (AST), amylase, alkaline phosphatase (ALP), total and direct bilirubin, calcium, cholinesterase, cholesterol, creatin kinase (CK) , creatinine, ferritin, gamma glutamyl transferase (GGT), glucose, HDL cholesterol, iron, lactate dehydrogenase (LDH), LDL cholesterol, lipase, magnesium, phosphorus, proteins, triglycerides, transferrin, uric acid, urea, alpha-1 antitrypsin, C3 , C4, ceruloplasmin, IgA, IgM, IgG, Kappa and Lambda light chains, C-reactive protein (PCR) and prealbumin.
3. Through immunochemical techniques were analyzed: pregnancy-associated plasma protein A(PAPPA), human chorionic gonadotropin beta-subunit (BHCG), antithyroglobulin antibodies (ATG), ant peroxidase antibodies (ATPO), TSH receptor antibodies (ATSHR), thyroid stimulating hormone (TSH), free triiodothyronine (FT3), free thyroxine (FT4), vitamin B12, folic acid, CA125, CA15.3, CA19.9, CEA, total and free prostate specific antigen (TPSA, FPSA), ultrasensitive troponin T (Tn-Ths), rheumatoid factor (RF), alpha-fetoprotein, C-peptide, insulin, N-terminal part of the propertied of BNP (NT-proBNP), parathyroid hormone (PTH), thyroglobulin, luteinizing hormone (LH), follicle stimulating hormone (FSH), estradiol, progesterone, testosterone, prolactin, sex hormone binding globulin (SHBG).
To determine how hemolysis affects each analytical test, we followed a serial of steps. First, the results were expressed as a percentage, according to the Glick et al method [13]. Then the percentage of interference was plotted against the hemolytic index for each analyte studied (interferogram) [10].
The percentage of interference was calculated using the formula:
% Int = 100 x (Cd - C1) / C1
Cd: average of the values of each test for each dilution of the interference.
C1: average of the concentration obtained for dilution without interference.
Next, and taking into account the coefficient of analytical variation (Cva) obtained by the analyzer used, as well as the desirable intra-individual biological variation coefficient (Cvi) provided by the SEQCml [14], the hemolytic index that caused significant clinical interference for each test analyzed was calculated. We defined clinically significant interference (Reference Change Values (RCV)) when the result with interfering differs more than √1.96 * (CVa2 + Cvi2) of the result without interference
Results
With all the results obtained, an interferogram of each of the analytes was performed representing the percentage of interference produced against the hemolytic index, and based on this, it was calculated:
1. Analytically significant interference: the hemoglobin concentration that causes 10% of the change in the technique analyzed [15].
2. Clinically significant interference: based on the formula described above. It could be above or below 10%.
Analytically significant interference was obtained for the following 18 magnitudes: ATPO, amylase, AST, DBil, CK, folate, ALP, phosphorus, iron, PTH, insulin, LDH, lipase, magnesium, potassium, progesterone, triglycerides and Tenths. This interference can originate both infra and overestimated results, as represented in (Figures 1 & 2). Considering these data, two new comments were generated for the laboratory report: “ Hemolysis interference, overvalued result “ and “ Hemolysis interference, underestimated result “. In addition, considering the HI that produced clinically significant interference, the comment “Hemolyzed, not analyzable” was generated (Table 1). With these three types of comments, both the sign of interference and concentration are considered, differentiating when the result of the determination can be provided, and when not, since providing it would lead to errors in clinical interpretation. Likewise, the use of clinically significant interference improves the interpretation that hemolysis produces on laboratory tests, since it is calculated individually for each analyte and not applied in general as in analytical interference (10%) [2]. This study allowed us to compare the results obtained with the information provided by the inserts, founding differences in several of the techniques analyzed (Table 2).
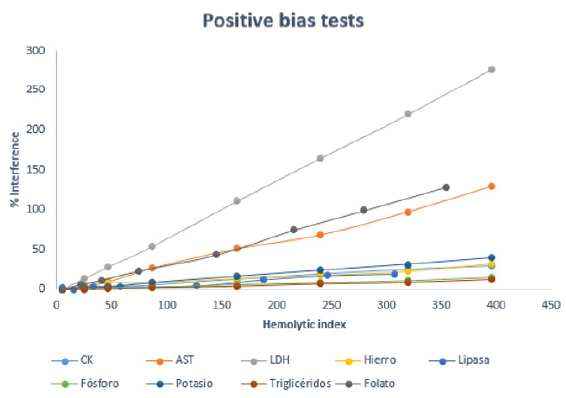
Figure 1: Variation of the percentage of interference with the hemolysis index for tests with positive bias.
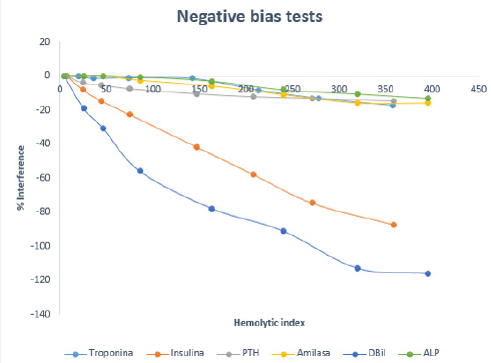
Figure 2: Variation of the percentage of interference with the hemolysis index for tests with negative bias.
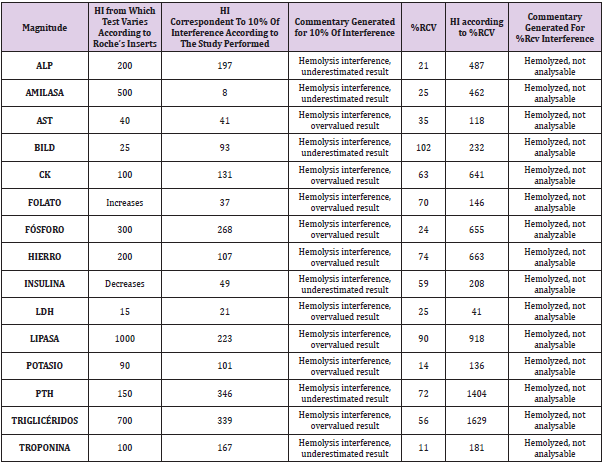
Table 1: Comparison of the hemolysis index that produces changes according to Roche Diagnostics® insert, analytically significant (10%) and clinically significant (%RCV) changes. In those tests that %RCV>50%, HI was calculated for 50%.
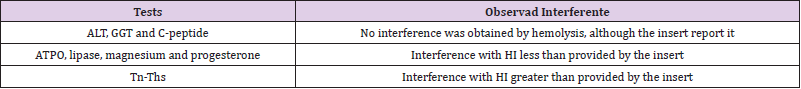
Table 2: Comparison between the interference observed in the insert and the study performed
Discussion
The interference by hemolysis varies according to the method, substance analyzed and working conditions. Therefore, it is recommended that each laboratory verify the information that suppliers provide in real working conditions [7,11]. There are numerous studies performed in biochemical techniques. The results obtained in our study are mostly consistent with others already made (either because hemolytic interference occurs or not): uric acid, creatinine, GGT, LDL, LDH [5,7], ALP, calcium, HDL [5,7,16], total bilirubin, lipase [4,5], phosphorus, urea [5,16], glucose, magnesium, CK [4,16], potassium, transferrin [10]. Although it is true that in some tests there is controversy between the different studies consulted, this may be due to the fact that the interference produced by hemolysis in the different determinations is influenced both by the analyzer and by the technique used.
For example, for GGT our study determines that there is no interference by hemolysis as reported by two other studies [5,7]. However, in three other studies [4,10,16], they conclude that interference to an HI 130-260 does occur. In the case of ALT, it can be observed that although the same analytical technique is used as in other studies [5,7,16], the same results regarding interference are not obtained. Therefore, it is very important to emphasize that each laboratory has to carry out its own study to determine what type of interference and at what concentration of hemolysis occurs, since the results of each laboratory cannot be generalized with others instruments or reagents [5,7,10,16]. As we have said at the beginning, there are different mechanisms that produce hemolysis. For example, for K, LDH and AST, the increase in their value as a result of hemolysis is due to the release of these constituents from the inside of the red blood cell [4,6]. Another example would be the decrease in the direct bilirubin value due to analytical interference in the technique [6], which is consistent with our study.
Magnesium is another test that also increases due to analytical interference [6]. In our study it increases from 500 mg/dL, while in other studies this increase occurs from a hemolysis index of 130 mg/dL [10]. Despite of other authors determine that there is no interference for magnesium [17]. For immunochemistry techniques there is not enough available literature of interference by hemolysis. Therefore, our results cannot be compared in that sense. However, we consider highly recommended to perform an interference study, especially for certain immunochemical techniques on which our study concludes that there is interference with low hemolysis rates. For example, it is observed that there is interference for the determination of Tn-This, insulin, and folic acid too. As seen in Figure 1, there is a positive interference for folic acid due to the outflow of the red blood cell contents, while the decrease observed in insulin is caused by proteolysis [6]. Hemoglobin can produce chemical or spectrophotometric interference in many determinations, such as in the case of Tn-Ths which generates an undervaluation of its value with the consequent danger of underestimation of acute myocardial infarction in the case of not considering this possible interference [6].
Having performed the hemolysis study in the same equipment where it will be applied, puts at our disposal the information of the equations we have obtained (percentage of interference versus the hemolytic index), and therefore we have the regression lines from our laboratory for each of the techniques analyzed. In this way, this degree of correction could be reported in cases in which the physician considers it. There is controversy regarding the use or not of the correction equations. If used, it is recommended to do it only when the degree of interference exceeds the reference change values, that is, when the interference proves to be clinically significant [6]. Nowadays analyzers include the measurement of serum index, so it is important that each clinical laboratory use them as much as possible to assess when interference occurs and how to face it.
It is also important to use these indexes in terms of quality management. There must be a quality indicator for the hemolytic index that tells us how many samples arrive hemolyzed at the laboratory and what is their origin. In that way, we can keep an adequate record throughout the year and establish a monthly quality limit that must not be exceeded. In case of being overcome, we can establish quality meetings with the phlebotomists, raising awareness about the importance of good laboratory practices to avoid hemolyzed samples as much as possible. In our study, we have introduced several levels of interference for all tests (hemoglobin concentration from 0 to 1000 mg/dL), but it would also be interesting to carry out the study on two levels of concentration, one of them close to the clinical decision value due to some times the interference may depend on the concentration of the analyte [15,18].
It is very necessary the existence of a standardization between clinical laboratories that homogenize the degree of hemolysis from which it is considered clinically significant, and what is the degree of hemolysis considered for the rejection of the samples if appropriate, due to the level of clinical significance may vary depending on the article you consult. In our case, thanks to the realization of this work, important differences were discovered with the inserts provided by the commercial house, as well as differences respecting the indexes established for the previously used equipment, probably due to the change of techniques of some analyzers to others. In addition, improvements were made to the laboratory report adding whether hemolysis causes an underestimation or overvaluation, information that is necessary for clinicians.
Conclusion
In conclusion, when a laboratory introduces new equipment for the majority of biochemical and immunochemical tests in its catalog, different studies are needed to adapt to the possible differences that may arise. Among these studies one of the most important, due to its high prevalence, is the study of interference by hemolysis.
References
- Torrado Carrión RA, Rivas Chacón L del M, Cámara Hernández V, De Paula Ruiz M, Pascual Durán T, et al. (2019) Valoración del uso del índice ictérico como parámetro para la gestión de la determinación de la bilirrubina total. Revista del Laboratorio Clínico 12(2): 64-68.
- Gómez Rioja R, Alsina Kirchner MJ, Álvarez Funes V, Barba Meseguer N, Cortés Rius M, et al. (2009) Hemólisis en las muestras para diagnó Revista del Laboratorio Clínico 2(4): 185-195.
- Lippi G, Banfi G, Buttarello M, Ceriotti F, Daves M, et al. (2007) Recommendations for detection and management of unsuitable samples in clinical laboratories. Clinical Chemical Laboratory Medicine 45(6): 728-736.
- Lippi G, Luca Salvagno G, Montagnana M, Brocco G, Cesare Guidi G, et al. (2006) Influence of hemolysis on routine clinical chemistry testing. Clinical Chemistry and Laboratory Medicine 44(3): 311-316.
- Saldana O ÍM (2015) Hemolysis interference in the determination of 25 biochemical constituents using ADVIA 1800 autoanalyzer. An Fac med 76(4): 377-384.
- Pineda Tenor D, Prada de Medio E, Belinchón Torres PM, Gascón Luna F, Morales García LJ, et al. (2016) Recomendación del uso de ecuaciones de corrección de valores de potasio en presencia de interferencia por hemó Revista del Laboratorio Clínico 9(4): 177-183.
- Garcia Aguilar GD, Picos Picos MÁ, Quintana Hidalgo L, Cabrera Argany Á, Lorenzo Medina M, et al. (2007) Utilidad de los índices séricos para la valoración de las interferencias causadas por la hemólisis y la bilirrubina en la medición de distintos constituyentes bioquí Química Clínica 26(4): 196-201.
- (2017) Roche Diagnostics®. HIL test. Insert Roche Diagnostics®.
- Castaño Vidriales JL (1995) Criterios para la valoración de la significación analítica y clínica de las interferencias en bioquímica clí Química Clínica 14(3): 107-109.
- Steen G, Vermeer HJ, Naus AJM, Goevaerts B, Agricola PT, et al. (2006) Multicenter evaluation of the interference of hemoglobin, bilirubin and lipids on Synchron LX-20 assays. Clinical Chemistry and Laboratory Medicine 44(4): 413-419.
- López Martínez R, Alonso Nieva N, Serrat Orús N, Gella Tomás FJ, Boned Juliani B, et al. (2013) Procedimiento para el estudio de la interferencia por hemólisis, bilirrubina y turbidez y para la verificación de los índices de hemólisis, ictericia y lipemia.
- (2019) Roche Diagnostics®. SI2. Insert Roche Diagnostics®.
- Glick MR, Ryder KW, Jackson SA (1986) Graphical comparisons of interferences in clinical chemistry instrumentation. Clin Chem 32(3): 470-475.
- Minchinela J, Ricós C, Perich C, Fernández Calle P, Alvarez V, et al. (2014) Base de datos de los componentes de Variación Biológica, con las especificaciones de la calidad analítica (deseable, mínima y óptima).
- López Martínez RM, Rigo Bonnin R, Andrés Otero MJ, Canalias Reverter F, Cano Corres R, et al. (2018) Procedimiento para el estudio de interferencias exógenas en la medición de magnitudes bioló Documento técnico (2017). Revista del Laboratorio Clínico 11(3): 147-152.
- Caballero Sarmiento R (2007) Estudio de las interferencias producidas por la hemólisis en la medición de 18 constituyentes séricos en un ADVIA 2400. Química Clínica 26(1): 20-22.
- Yücel D, Dalva K (1992) Effect of in vitro hemolysis on 25 common biochemical tests. Clin Chem 38(4): 575-577.
- Steen G, Klerk A, Laan Kvd, Eppens EF (2011) Evaluation of the interference due to haemoglobin, bilirubin and lipids on Immulite 2500 assays: A practical approach. Annals of Clinical Biochemistry 48(2): 170-175.
