 Research Article
Abstract
The purpose of this study is to investigate effect of the pedestrian’s height and
weight, and its position during a traffic accident. An initial literature review was
conducted to gather accident data in the UK involving pedestrians and a thorough
research on pedestrian’s kinematics and injury severity that may arise during an
accident. A 2010 model Toyota Yaris was the vehicle of choice for this study which was
initially meshed using the 5mm element crash criteria found in the Altair Hypermesh
library. Additionally, hybrid III dummy was utilised which was scaled to heights of
170cm, 185cm, and 200cm with respective weights of 75kg, 82kg, and 90kg to evaluate
the effects of the pedestrian’s height and weight to the severity of the injuries. LS Dyna,
along with Hypergraph 2D was used in order to conduct an explicit analysis which is
suitable to computing rigid bodies and large displacements which were present within
the crash simulation.
The simulation process was carried out to give results on 3 different dummies in
a stationary and walking stance impacting the front end of the vehicle at 25mph in 3
different positions (total of 18 simulations). The 3 positions the dummy was placed
along the front of the vehicle are Position 1 (P1) which is at the centreline of the vehicle,
Position 2 (P2) is 466mm on the left-hand side of the vehicle, and Position 3 (P3) is
728mm on the left-hand corner of the vehicle. The data acquired for this thesis are the
pedestrian head acceleration in order to evaluate head injuries and lower extremity
loads to find out the severity of the lower leg injuries sustained during an accident.
From the results, it can be clearly seen that the height, position and the stance of the
pedestrian played an important role to the severity level of injuries during an accident.
At a stationary position, the pedestrian at all 3 heights shown to sustain greater
lower extremity injuries in comparison to when the pedestrian is at a walking stance.
Additionally, when the collision occurs at the corner of the vehicle, the data shown
that taller pedestrians (185cm and 200cm) while walking were observed to have a
lower probability of sustaining severe head injuries as the HIC values were within the
acceptable threshold of 1000.
Keywords:Traffic Accident; Crash; Injury Severity; Ls Dyna
Introduction
In today’s age, with the advancement of automobile and its increase of production, the amount of traffic accidents also increased with pedestrian fatalities being the 2nd largest category of automobile deaths (Li, 2016). While it is important to ensure safety for vehicle occupants, it is equally significant to ensure that vulnerable road users like bicyclists and pedestrians are protected from vehicle collisions. Due to the rise of pedestrian accidents, pedestrian safety is now considered one of the most important concerns and challenges in the automotive industry everywhere in the world with more detailed attention to the safety features involving the front of the vehicle which is the most common area of collision involving a pedestrian. Not having the protective facilities during the accident makes the pedestrians more vulnerable to injury compared to other crash victims. Detailed understanding of the kinematics of the pedestrian and injury risk are important as this can be useful in developing safer protective facilities for vulnerable road users like pedestrians and bicyclists.
In 2017, around 26% traffic accidents in Great Britain involve vehicle-to-pedestrian collisions (Department for Transport, 2018). According to Eurostat (Eurostat, 2017) for each one million population in Great Britain 7.0 pedestrians were killed during accidents involving a vehicle collision. A pedestrian accident usually involves the pedestrian getting struck at the front of the vehicle while running, walking, or standing still and commonly sustain injuries to the head and the lower leg. The severity of the injuries seemed to be a function of impact location, vehicle velocity and vehicle height (TRA, 2016). This dissertation is based on evaluating the accident data, trends and human kinematics of a pedestrian accident in order to reconstruct and further understand how injuries arise involving different variables such as pedestrian height, position, stance and vehicle speed.
Accident Data
The Department for Transport publishes annual and quarterly data on reported road accident casualties and the data from the report was acquired using the STATS19 reporting system where the information was given by the police that was on the scene of the accidents and the reports from the members of the public. However, the data/statistics obtained using this system do not represent the full accident/casualties occurring as people does not often report all personal injury accidents to the police. Road accidents in 2017, 24,831 in which have serious injuries, 144,369 with minor injuries, and 1,793 reported road deaths. Figure 1 shows the data of casualties in Great Britain in 2017 due to traffic accidents. In 2017, pedestrians accounted for 26% of road deaths with a total of 470 deaths which was 5% more than the recorded pedestrian deaths in 2016. Table 1 shows a more detailed figures on the number of recorded pedestrian casualties with the type of severity i.e. killed, seriously injured, slightly injured, and so on. There was a total of 23,805 pedestrians of all casualties, 5,594 being seriously injured, and 17,741 slightly injured. Furthermore, between 2010 and 2016 the number of recorded pedestrian casualties has remained in the same constant trend, but it had a 5% increase in 2017 compared to 2016 [1-10].
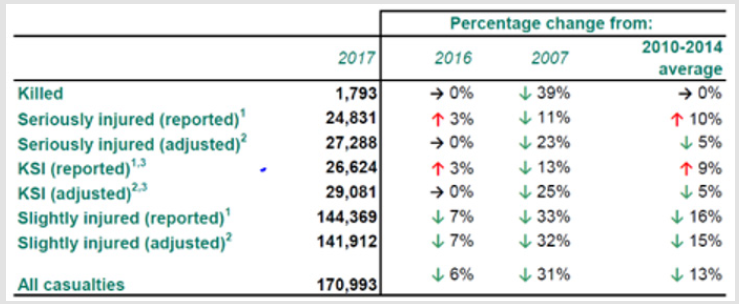
Figure 1: Summary of Trends (Department for Transport, 2018).
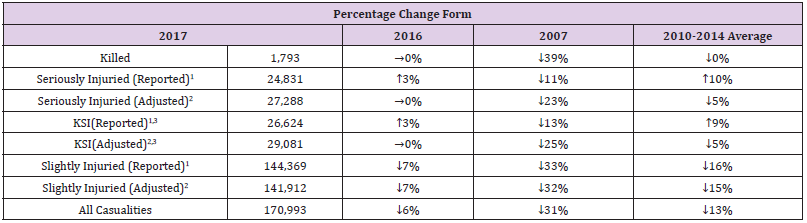
Table 1: Summary of Trends (Department for Transport, 2018).
Pedestrian Safety
For the longest time, automotive manufacturers focused solely on increasing the safety of the occupants and paying less attention to the safety of the pedestrians, however, due to the increased in number of reported casualties, attempts at reducing pedestrian deaths were introduced which focused on education, traffic regulations and automotive regulations. For example, WHO introduced a road safety manual which focuses increasing the safety of pedestrians by introducing new enforcement laws and education (WHO, 2019). Regulation such as the Pedestrian Protection Regulation 78/2009 was also introduced to ensure all cars offer a level protection for pedestrians (ETSC, 2017). A few examples of increasing pedestrian safety are:
a. Introducing new and existing laws to reduce mobile phone use, speeding, drinking and driving while driving.
b. Creating an infrastructure which separates pedestrians from other traffic i.e. pedestrian/zebra crossing, overpasses, and underpasses.
c. Lowers vehicle speeds such as speed bumps and improve roadway lighting.
Pedestrian protection is also achieved by designing the frontend of a vehicle so that pedestrians or any other vulnerable road users such as cyclists are less likely to be severely injured during collision. These involved looking for different ways to re-design front-end components such as the bumper, bonnet, and windshield to absorb more energy from the crash without decreasing the structural integrity of the vehicle.
Pedestrian Injury
In most cases, during a road traffic accident, the injury to the pedestrian are caused by being impacted by the vehicle and the pedestrian hitting the ground. Figure 2 shows the distribution of injuries to the pedestrian that are caused by various vehicle regions. The head, the pelvic area, and the legs of the pedestrians are the body regions that are most likely to be injured with the head trauma being the main cause of most serious injuries and even death to the pedestrians. The initial contact between the pedestrian and the vehicle occurs at the bumper which can lead damage to the knee ligaments bending at the joint and fractures to the shin/tibia. The bumper is the part of the vehicle where its kinetic energy is initially transferred to the pedestrian during the crash which causes the injuries, and this is the reason that the bumper is an important safety feature in vehicles. The bumper, if designed properly, is capable absorbing some of the kinetic energy through deformation which reduces the damage to the pedestrian. Looking at the sources of injuries (right), Figure 2 indicates that the bumper and the windscreen are the two main areas of the vehicle that are responsible for pedestrian injuries, however, 31.9% of injuries are due to the secondary impact to the ground In order to classify and investigate the severity of injuries, the AIS system (Abbreviated Injury Scale) was introduced (NSW, 2019) and is a system that classifies the relative risk of ‘threat to life’ in a person who was injured in an accident. AIS divides these risks into severity levels [11-20]:
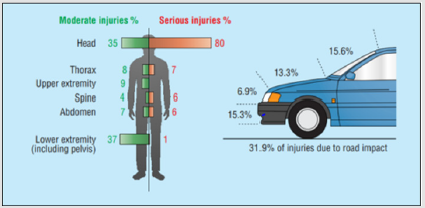
Figure 2: Distribution of pedestrian injuries caused by different vehicle regions (Crandall, 2008).
a) AIS 1- Minor
b) AIS 2- Moderate
c) AIS 3- Serious
d) AIS 4- Severe
e) AIS 5- Critical
f) AIS 6- Maximal
Head Injury Criteria
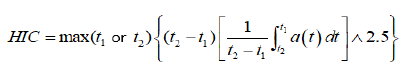
HIC (Head Injury Criteria) was used in order to assess the possibility and severity of head injury from a collision to the vehicle using a mathematic formula. It is calculated using the equation below which considers the scalar values of the head accelerations of the dummy which includes the duration of the head acceleration. The interval that the collision last (t1 and t2) is from 15ms to 36ms which produced the maximal HIC and a(t) is the resultant linear acceleration of time history (in g) of the centre of gravity of the head.
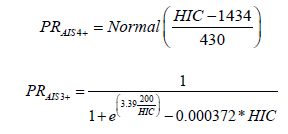
The assessment of the HIC is important to the highway and airline safety community as both industry standards will need HIC evaluation for certification (SAE, 1966 and NHTSA, 1971). According to the Federal Motor Vehicle Safety Standard (FMVSS) 208 and FMVSS 213 for occupant crash protection and child restraint systems respectively, specify that the HIC value must be less than 1000 which there is an 18% chance of a severe injury, 55% of a serious injury and a 90% chance of a moderate injury. Furthermore, HIC is related to the AIS injury criteria which assess the probability of skull fracture using the calculated HIC value. Equation (2) is the formula calculating the risk of AIS 4+ injury (Mertz, 1996) and Equation (3) is the risk of AIS 3+ injury (NHTSA, 1995).
Lower Extremity Injury
a) Femur Load
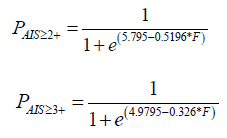
The femur load criterion is a measure of injury to the femur. It is the compression force acting axially on each femur and the threshold limit according to FMVSSS 208 and NCAP (New Car Assessment Programme) is 10kN for the 50th percentile male which corresponds to a 35% probability of AIS 2+ injury occurring. The AIS formula involving the femur are shown below:
b) Tibia Load
The tibia index is an injury criterion formerly introduced by Mertz (Mertz, 1993) for the lower extremity which involves the bending moment and axial compressive loads on the leg. According to the research by Begeman (1997) and Yoganandan (1996), the average failure tibial axial force was 7590N and forces of 5200N and 6800N corresponds to 25% and 50% probability of AIS 2+ ankle/talar and midfoot fractures respectively. The tibia index (TI) is given by the following formula:
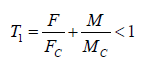
Where,
F= Compressive Axial Force (kN)
M= Bending Moment (Nm)
Mc and Fc = Critical values of bending moment and compressive
force in the tibia.
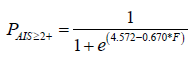
The probability of an AIS 2+ injury is calculated by:
Methodology
The primary requirement for this research was to conduct a pedestrian crash analysis using software simulations to identify the injuries made on the pedestrian during a collision. This section of the thesis will explain the methodology used to conduct this research which consists of the simulation set-up, process of gathering injury data, and analysis and evaluation of the results.
Vehicle Model
The initial phase of this work was to generate a complete finite element model (FEM) of a small utility car which was used alongside the dummy to conduct a car to pedestrian crash analysis. For this research a Toyota Yaris (2010) was used. The vehicle model was initially meshed at approximately 5mm using Altair Hyperworks and since only a frontal collision test will be conducted, the back end of the vehicle was removed leaving the front section of the car as shown in Figure 3 below. This was done in order to reduce the duration of the simulation. To be able to get a more ‘realistic’ representation of a collision between a pedestrian and a car, the underlying components at the front end of the car was included such as the bumper beam, engine, radiator, and support frames. It was identified that as the pedestrian collides with the vehicle, the outer parts such as the hood and the bumper also have contact with the inner components (Ashton, n.d).
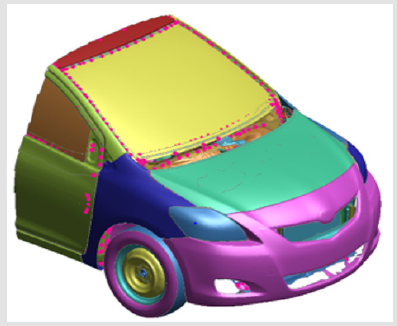
Figure 3: Toyota Yaris 2010 (Oasys, 2018).
Dummy
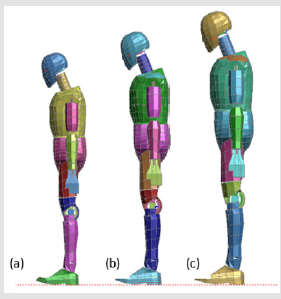
Figure 4: Dummies with different height and weight; (a) 170 cm, 75kg; (b) 185cm, 82kg; (c) 200cm, 90kg (Oasys, 2018).
The dummy used in this project is a Hybrid III 50th percentile dummy. The hybrid III dummy is the most widely used dummy for both frontal crash and automotive safety testing. It is used by engineers in order to observe the human kinematics during a collision and to gather injury data which will allow an accurate prediction of the severity of potential injuries. For this project, a total of 3 dummies at heights of 170cm, 185cm, and 200cm with respective weights of 75kg, 82kg, and 90kg were used to evaluate the effects of the pedestrian’s height and weight to the severity of the injuries (Figures 4-9). The 3 dummies are:
a. 170cm, 75kg
b. 185cm, 82kg
c. 200cm, 90kg
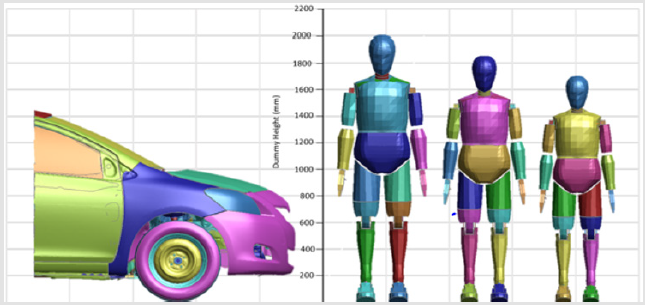
Figure 5: Dummy heights.
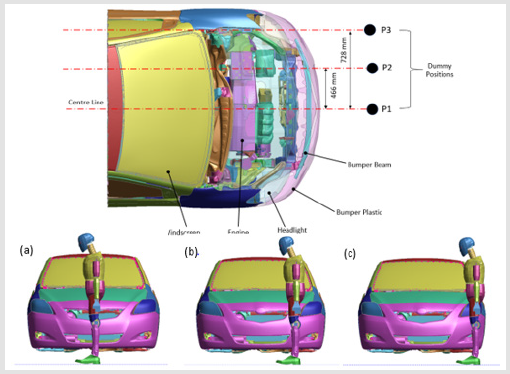
Figure 6: Dummy positions (Stationary); (a) P1; (b) P2; (c) P3.
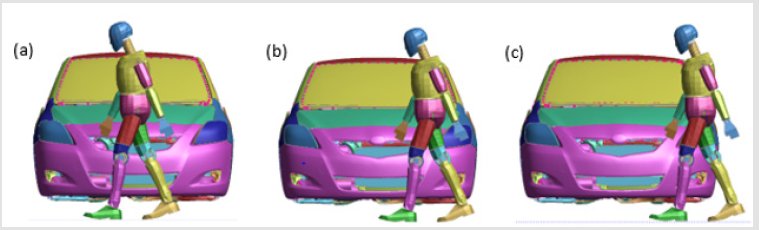
Figure 7: Dummy positions (Walking); (a) P1; (b) P2; (c) P3.
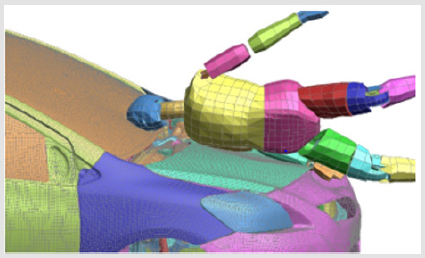
Figure 8: Pedestrian Head Collision at position P1- Stationary; T=0.12s (Oasys, 2018).
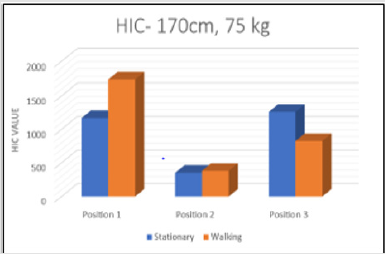
Figure 9: HIC value for 170cm, 75kg dummy (Hypergraph 2D, 2018).
Design of Experiment
LS Dyna, a finite element software was used to carry out the simulations as it incorporates the used of either explicit, or implicit analysis to simulate complex real-life problems. For this project, the explicit analysis was used because an explicit computation has the capability to compute rigid bodies and large displacements which are likely to be present within a crash simulation, while implicit analysis is limited to handle these different variables. The simulation process was carried out to give results on 3 different dummies in a stationary and walking stance impacting the front end of the vehicle at 25mph in 3 different positions. Figure 6 shows the height of the dummies used for this study relative to the vehicle’s bumper height which is around 200mm from the ground and was not changed all throughout the investigation.
In real-life situations, traffic accidents involving pedestrians usually occurs when the vehicle is making a turn. In this study, the dummy was positioned accordingly into 3 different places along the front of the car model. Figure 6 shows the positions of pedestrian impact and also the main components like the bumper beam and engine which the pedestrian might make contact with during the duration of the simulation. Position 1 (P1) is at the centreline of the vehicle, Position 2 (P2) is 466mm on the left-hand side of the vehicle, and Position 3 (P3) is 728mm on the left-hand corner of the vehicle.
The dummies are positioned in reference to the vehicle’s centerline Once the dummy was in position, a velocity of 25mph (11176mm/s) was applied to all parts of the vehicle. According to prior research, most accidents usually occurs at 25, 30, 40 mph but this study will only consider accidents occurring at 25mph (40km/h). The defined contact in simulation of this study is ‘AUTOMATIC SURFACE TO SURFACE’ contact which was the contact defined for the vehicle and the dummy. Additionally, an ‘AUTOMATIC SINGLE SURFACE’ contact was applied to all parts of the vehicle which applies ‘selfcontact’ on each part. Both contact definitions are some of the most widely used contact option in the industry especially involving crashworthiness applications. A high-performance computer server (HPC) was used to run all the simulations as it provides enough memory space and processing capability to run the tests almost 5x faster than when using the local machines to conduct the simulations. The results were then generated and analysed on Hypergraph 2D which is a post processing platform provided by Altair Hyperworks that allows users to attain the resulted data. The data acquired for this thesis are:
a) HIC
b) Lower Extremity
c) Femur Load
d) Axial Load
A critical evaluation of the results was then conducted where each result was divided into ‘severity’ category characterised by different colours for easier evaluation. This method of assessment process is implemented by the Euro NCAP (Euro NCAP, 2017) and will be further discussed in section 3.0.
Results
The results presented in this study have been referred in this section. The process of acquiring and evaluating the injury data are as follows
Head Injury Criteria
The value of the HIC had been acquired by generating the head acceleration graph which was obtained through an accelerometer inside the dummy’s head. The accelerometer is located at the head’s centre of gravity and is labelled as node 1. The output (binout) file from the simulation was then utilised in Hypergraph 2D to generate an acceleration vs time graph, and then a data filtering method CFC180 SAE was applied in order to reduce any unwanted ‘noise’ in the data. Using the equation explained in section 5.2.1 and the injury tool from Hypergraph 2D, the HIC value was obtained and evaluated using the criteria shown in Table 2. The assessment process consists of colour-coding each HIC value in terms of its injury level, for example, if the HIC value was more than 1000 but less than 1700, the value in the results table will be highlighted in yellow indicating that the pedestrian will suffer severe head injuries [21-34].
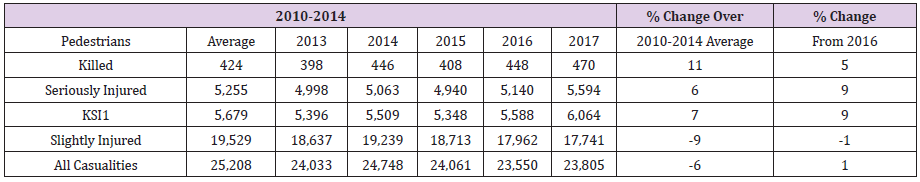
Table 2: Reported road casualties by severity, Great Britain: Table RAS30001 (Department for Transport, 2018).
Lower Extremity Injuries
For extracting the femur load data, the load cells located in the left and right femur are used to calculate the force output which acts on them upon impact. The femurs are characterised by joints 24 (left) and 25 (right). The load which acts on the tibia was acquired using the same process as the femur load. The load cell in joints 42 (left) and 44 (right) was used to determine the tibia axial load which acts on the pedestrian during the collision. A force against time graph for both the femur and tibia load was generated through Hypergraph 2D using the binout file from the simulation. CFC180 SAE filter was then utilised. Using the equations in section 1.3.2 for calculating the probability of femur and tibia injuries, the results are evaluated using the criteria in (Tables 3 & 4) in which each value is highlighted into different colours indicating its severity level. For instance, when the femur load acting on the pedestrian was found to be more than 25kN, the value will be highlighted in red which indicates that fatal injuries will occur. Additionally, if the tibia load was found to be less than 5 kN, the value will be highlighted in green which signifies that the pedestrian will only suffer moderate injuries.
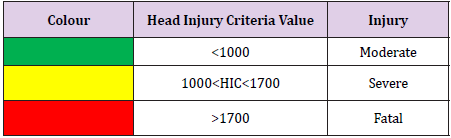
Table 3: Assessment Criteria for HIC.
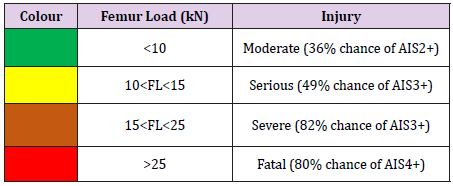
Table 4: Assessment Criteria for HIC.
Dummy (170cm, 75kg)
Head Injury
Figure 9 shows the graph of the HIC values acting on the head during the accident for the first dummy at 170cm in 3 different positions centre (P1), quarter (P2) and corner (P3) position along the front of the car. When the dummy is stationary at position P1 and P3, the HIC values are above 1000 (1168 at P1 and 1260 at P2) due to the impact between the head and the windscreen whilst the HIC at P2 has a considerably smaller value (HIC= 352.8) compared to the other dummy positions. Furthermore, at a walking stance, the HIC values at all 3 positions followed a similar trend where there’s high HIC values at P1 and P3, and low HIC at P2. The only difference is that HIC at P3 is below 1000. Figures 10-17 below shows the collision of the dummy’s head to the windscreen at P1 when the dummy is stationary and in a walking stance. The initial head impact for both scenarios occur t=0.12s and it can be observed that windscreen deforms as the head hits the windscreen but there’s more deformation occurring for the dummy that is in a walking stance compared to when it was stationary. This results in a high HIC value as there’s an increase in head acceleration therefore greater impact force which is shown in the data acquired in Table 5 above.
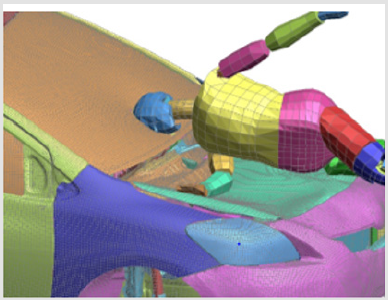
Figure 10: Pedestrian Head Collision at position P1- Walking; T=0.12s (Oasys, 2018).
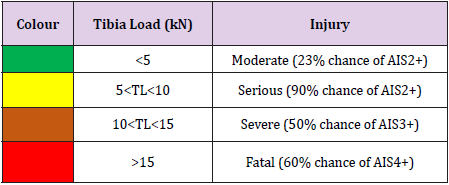
Table 5: Assessment Criteria for Tibia Load.
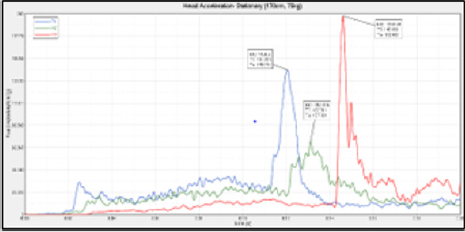
Figure 11: Head Acceleration: Stationary- 170cm, 75kg (Hypergraph 2D, 2018).
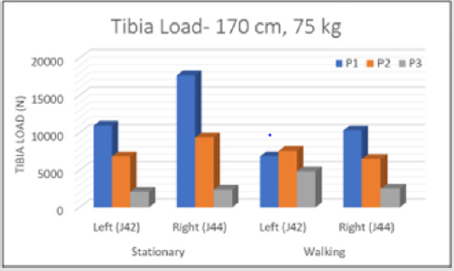
Figure 12: Tibia Load for 170cm, 75kg dummy (Hypergraph 2D, 2018).
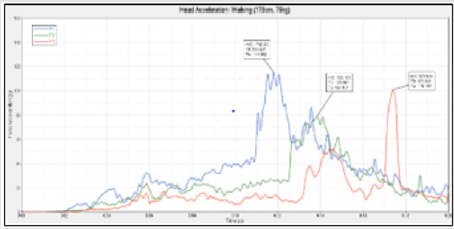
Figure 13: Head Acceleration: Walking- 170cm, 75kg (Hypergraph 2D, 2018).
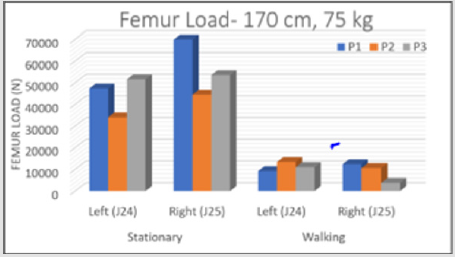
Figure 14: Femur Load for 170cm, 75kg dummy (Hypergraph 2D, 2018).
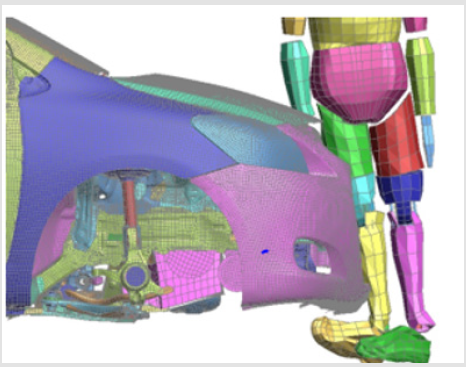
Figure 15: 170cm Pedestrian Collision at position P1- Stationary; T= 0.03s (Oasys, 2018).
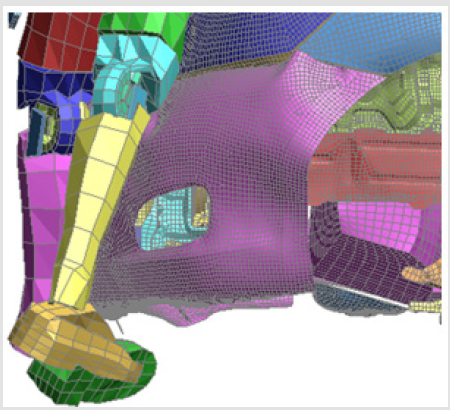
Figure 16: 170cm Pedestrian Collision at position P2- Walking; T=0.04 and T=0.05s (Oasys, 2018).
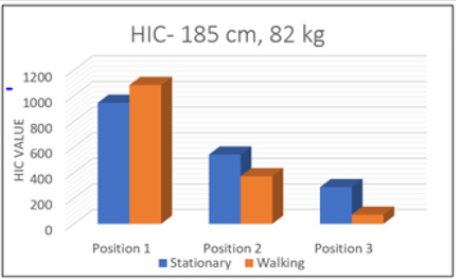
Figure 17: HIC value for 185cm, 82kg dummy (Hypergraph 2D, 2018).
By using the assessment method mentioned earlier in this section, the HIC values shown in Table 6 were evaluated and colourcoded in terms of its severity level. From the table, it shows that at P2 for both stationary and walking scenarios the dummy suffers moderate head injuries (green), at P1 and P3 for stationary the dummy experiences severe head injury (yellow), and fatal head injury occurs to the dummy when walking at P1 (red). Figures 12 & 13 shows the head acceleration graph of the dummy during the accident for both stationary and walking scenarios which was used to calculate the HIC values. From observing the simulations with the graphs, the sudden increase of the head acceleration correlates to the head making an impact to the windscreen.

Table 6: HIC15 Table for 170cm, 75kg dummy.
Lower Extremity Injury-170cm, 75kg
From the data acquired (Figures 14 & 15), it can be observed that when the dummy is standing still (stationary), the right femur and tibia loads are higher compared to the loads on the left side (at all dummy positions). This is because the vehicle collision occurs at the right-hand side of the pedestrian which means the vehicle will initially hit the right leg resulting to the pedestrian experiencing higher loads. The maximum femur and tibia load (69kN and 17kN respectively) occur in the right leg when the dummy was in P1. The minimum femur load (33kN) acting on the pedestrian happens at P2 in the left leg and the minimum tibia load (2.1kN) occurs in the left at position P3. During the 2nd scenario (dummy walking) the femur loads for both right and left legs are considerably lower in comparison to the 1st scenario. The maximum femur load when the dummy is walking is 13.8 kN which occurs at position P1 in the right leg and minimum load (3.8kN) occurs at P3. The tibia loads are also lower compared to when the dummy was stationary where the maximum value is 10 kN and the minimum value is 2.5kN which happens at positions P1 and P3 respectively.
Figure 16 shows the initial contact between the vehicle and the stationary dummy when the collision occurs at the centre of the vehicle front. The dummy’s right leg was hit initially (at t=0.03s) which immediately makes contact with the left leg and this results in higher forces acting on the lower right side of the dummy which was proven in the data acquired. Figure 17 shows the simulation of the dummy walking at position P2. It can be clearly seen that there’s two points of contact occurring in the lower leg during the collision with the vehicle in which the right leg was initially hit at t=0.04s followed by an impact to the left leg at t=0.05s. (Table 6) is the assessment of the probability of injury severity for the femur for both stationary and walking scenarios. The values are colour-coded in relation to its severity level as explained earlier in this section. When the dummy is stationary, fatal (red) lower leg injuries will occur as the left and right femur loads were more than 25kN. Moreover, when the dummy is walking, at P2 it experiences serious injuries (yellow) in both right and left leg, at P1 it will suffer both moderate (green) and serious injuries in the left and right leg respectively, and finally at P3 similar to P1 the dummy will experience both moderate and serious injuries. (Table 7) below shows the probability of injury severity for the tibia for the stationary and walking scenarios. When the dummy was in position P3, only moderate injuries will occur as highlighted in green. At position P2 serious injuries (yellow) occur, but at P1 fatal (red) injuries occur in the right leg as the tibia load was more than 15kN.
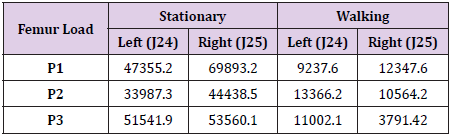
Table 7: Assessment of Femur Loads.
Dummy (185cm, 82kg)
Head Injury
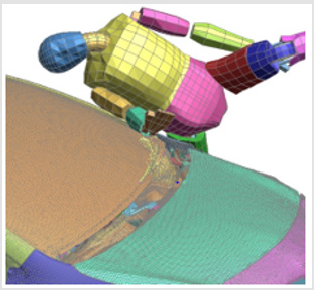
Figure 18: 185cm Pedestrian Head Collision at position P3- Walking; T=0.2s (Oasys, 2018).
The graph below Figure 18 shows the Head Injury Criteria value on the head during the accident for the second dummy at 185cm in 3 different positions; centre (P1), quarter (P2) and corner (P3) position along the front of the car. At the scenario when the dummy is stationary, the HIC values for all 3 positions were below 1000 in which the maximum value of 945 occurs at P2 and the minimum value of 286.9 occurs at P3. The same trend can be observed during the second scenario when the dummy is walking, however, at P1 the HIC value exceeded 1000. Both the minimum value for the stationary and walking simulations occurs at P3 and this is because the collision happens at the corner of the vehicle and due to the shape of the bonnet’s leading edge and the height of the dummy there’s no contact between the head and the car which results in lower HIC values.
(Figures 19 & 20) are an example of two different simulations, stationary dummy colliding at the centre of the vehicle front (P1) and walking dummy hitting the corner of the vehicle front. At P1, the head makes contact initially with the windscreen at t=0.13s resulting in HIC value of 945.8 which is the maximum value that the dummy experience when it is standing still. On the other hand, Figures 21-27 shows that at the end of the simulation, there’s no contact between the head and the vehicle and only lower body was affected during the crash. By using the assessment method mentioned earlier in this section, the HIC values shown in Tables 8 & 9 were evaluated and colour-coded in terms of its severity level. At P2 for both stationary and walking scenarios, the dummy suffers moderate head injury, P1 and P3 for stationary the dummy experiences severe head injury, and a fatal injury occurs to the dummy when walking at P1. (Figures 21 & 22) shows the head acceleration graph of the dummy during the accident for both stationary and walking simulations which was used to calculate the HIC values.
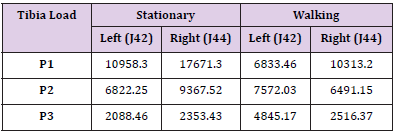
Table 8: Assessment for Tibia Loads.
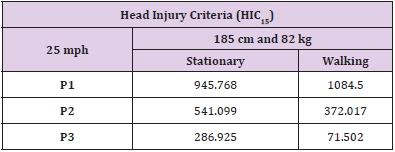
Table 9: HIC15 Table for 185cm, 82kg dummy.
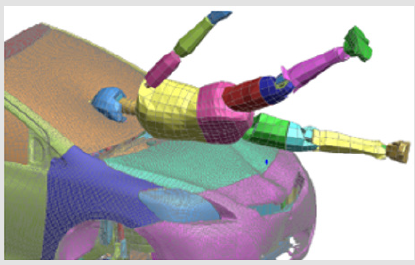
Figure 19: 185cm Pedestrian Head Collision at position P1- Stationary; T=0.13s (Oasys, 2018).
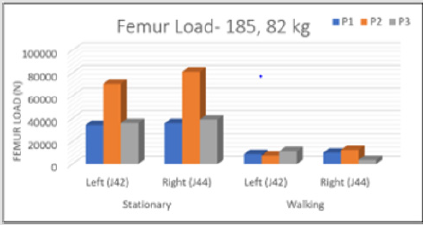
Figure 20: Femur Load 185cm, 82kg dummy (Hypergraph 2D, 2018).
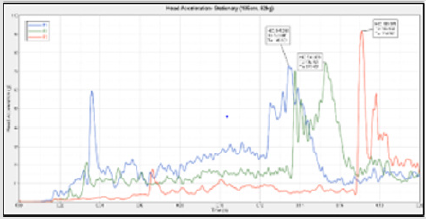
Figure 21: Head Acceleration: Stationary- 185cm, 82kg (Hypergraph 2D, 2018).
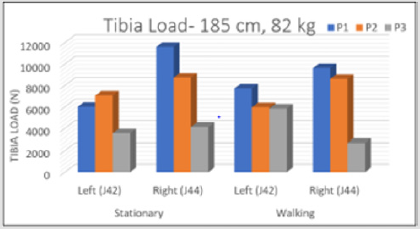
Figure 22: Tibia Load for 185cm, 82kg dummy (Hypergraph 2D, 2018).
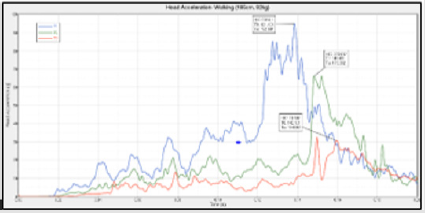
Figure 23: Head Acceleration: Walking- 185cm, 82kg (Hypergraph 2D, 2018).
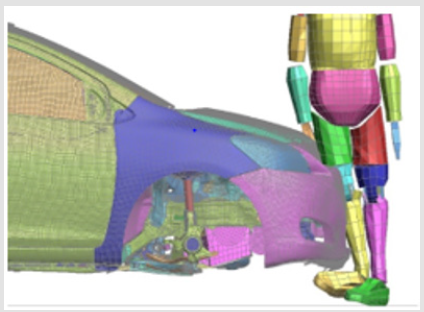
Figure 24: 185cm Pedestrian Collision at position P1- Stationary; T= 0.03s (Oasys, 2018).
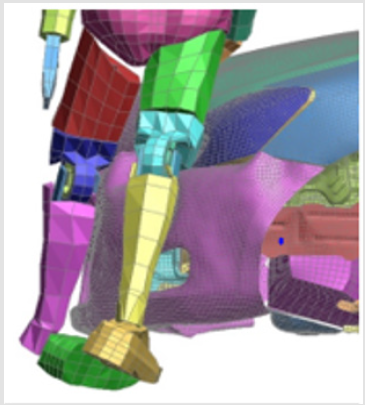
Figure 25: 185cm Pedestrian Collision at position P2- Walking; T=0.04 and T=0.05s (Oasys, 2018).
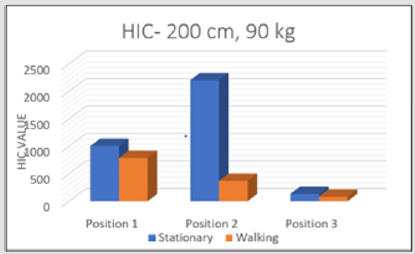
Figure 26: HIC value for 200cm, 90kg dummy (Hypergraph 2D, 2018).
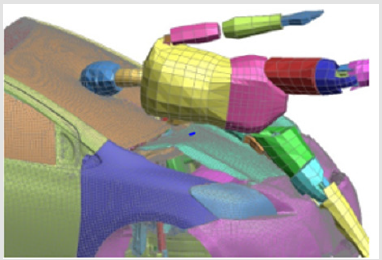
Figure 27: Pedestrian Head Collision at position P1- Stationary; T=0.14s (Oasys, 2018).
Lower Extremity Injuries- 185cm, 82kg
The results when the dummy is stationary were similar to the first dummy (170cm) where the right femur and tibia loads are higher compared to the loads on the left side as shown in Figures 23 & 24 below. The maximum femur load of 81kN acts on the right leg when the dummy is in position P2 and the maximum tibia load of 11kN acts on the right leg when the dummy is in position P1. The minimum tibia load (3.5kN) occurs in the left at position P3 and the minimum femur load (34kN) acting on the pedestrian happens at P1 in the left leg. Furthermore, when the dummy is in a walking stance the femur loads for both right and left legs are considerably lower in comparison to when the dummy is stationary. The maximum femur load when the dummy is walking is 12kN which occurs at position P2 in the right leg and minimum load of 3.6kN acts on the dummy at P3. The maximum tibia load of 9.6kN acts on dummy at P1 and minimum (2.5kN) occurs at P3. An example of the lower leg collision during the crash is shown in the figures below. Figure 25 shows the initial contact between the vehicle and the stationary dummy when the collision occurs at the centre of the vehicle front. Just like the short dummy (170cm), the right leg was hit first (at t=0.03s) which immediately makes contact with the left leg. This results in higher forces acting on the lower right side of the dummy which proven the plausibility of the data acquired. Figure 26 shows the simulation of the dummy walking at position P2. It can be clearly seen that there’s two points of contact occurring in the lower leg during the collision with the vehicle in which the right leg was initially hit at t=0.04s followed by an impact to the left leg at t=0.05s. A probability table to investigate the severity of injuries was created as shown in Table 9 for the femur. When the dummy is stationary, it will suffer fatal injuries (red) as the left and right femur loads were more than 25kN. However, when the dummy is walking, there’s chance of moderate and serious injuries in the left and right leg at all positions. Table 10 below shows the probability of injury severity for the tibia for the stationary and walking scenarios. When the dummy was in position P3, there will be moderate injuries when the dummy is stationary and a chance of serious injuries when the dummy is walking, at position P2. At P1 fatal injuries will occur in the right leg as the tibia load was more than 10kN.
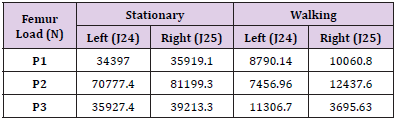
Table 10: Assessment for Femur Loads.
Dummy (200cm, 90kg)
Head Injury
Figure 27 shows the Head Injury Criteria value on the head during the accident for the second dummy at 200 cm in 3 different positions; centre (P1), quarter (P2) and corner (P3) position along the front of the car. Looking at the scenario when the dummy is walking, the HIC values for all 3 positions were below 1000 in which the maximum value of 788 occurs at P1 and the minimum value of 84 occurs at P3. When the dummy is stationary, the HIC value exceeded 1000 at P1 and P2 with the values of 10007 and 2206 respectively. Both the minimum value for the stationary and walking simulations occurs at P3 and this is because the collision happens at the corner of the vehicle and due to the shape of the front and the height of the dummy, it can be observed that there’s no contact between the head and the car which results in lower HIC values (Figure 28). This can be proven by looking at Figures 29 below which shows the dummy (walking) hitting the corner of the vehicle front and at the end of the simulation, there’s no visible contact between the head and the vehicle and only lower body was affected during the crash.
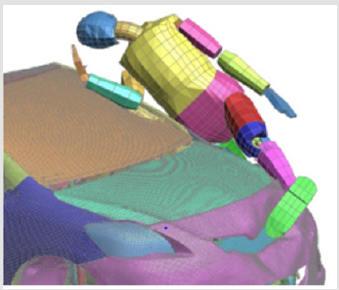
Figure 28: Pedestrian Head Collision at position P3- Walking; T=0.2s (Oasys, 2018).
Figures 28 & 29 is the simulation of the stationary dummy at P1. Using the head acceleration graphs and the pedestrian’s response to the crash, it can be observed the head makes contact initially with the windscreen at t=0.14s resulting in HIC value of 1007.9. Utilising the injury criteria assessment method mentioned earlier in this section, Table 11 shows that at all the scenarios that the dummy is at a walking stance, only moderate injuries occur to the dummy as the HIC values are under 1000. On the other hand, at a stationary position, the dummy suffers severe injuries in P1 and fatal injuries in P2 while at P3 only moderate injuries will occur. Figures 30 & 31 below is the head acceleration graphs of the dummy head at all the given scenarios (stationary and walking) which were used in order to calculate the HIC values. The graph shows that in comparison to the other dummies (170cm and 185cm dummies) all the head impact occurs later in the simulation and this is reasonable because the height of the dummy being 200cm, there’s greater distance travelled between the head and the car.
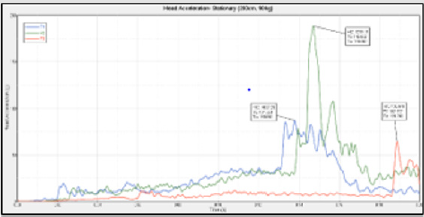
Figure 29: Pedestrian Head Collision at position P3- Walking; T=0.2s (Oasys, 2018).
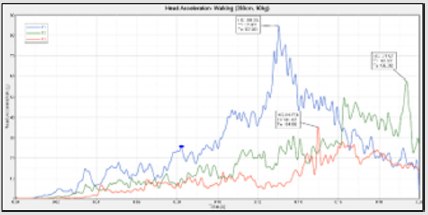
Figure 30: Head Acceleration: Walking- 200cm, 90kg (Hypergraph 2D, 2018).
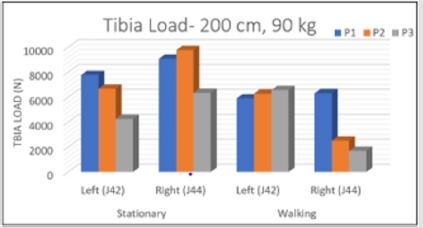
Figure 31: Femur Load 200cm, 90kg dummy (Hypergraph 2D, 2018).
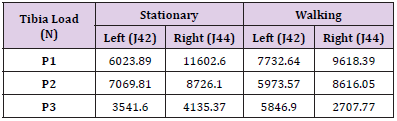
Table 11: Assessment for Tibia Loads.
Lower Extremity Injuries- 200cm, 90kg
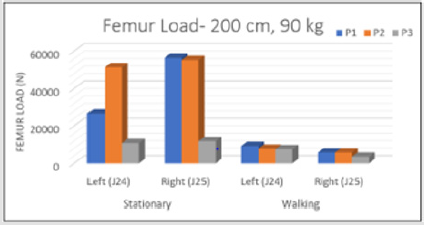
Figure 32: Femur Load 200cm, 90kg dummy (Hypergraph 2D, 2018).
Figures 32 & 33 shows the femur and tibia loads for the 200cm tall dummy. The results illustrate that the values of the right femur and tibia loads are higher compared to the loads on the left side (at all dummy positions) due to the collision happening at the right side of the dummy. In a stationary position, the maximum femur load of 56kN acts on the right leg when the dummy is in position P1 and the maximum tibia load of 9.7kN acts on the right leg when the dummy is in position P2. Additionally, the minimum tibia load (4.2kN) occurs on the left leg at position P3 and the minimum femur load (10.8kN) acting on the pedestrian happens at P3 in the left leg. In the simulations involving the dummy in a walking position, the femur loads for both right and left legs are considerably lower in comparison to when the dummy is stationary. The maximum femur load when the dummy is walking is 9.2kN which occurs at position P1 in the right leg and minimum load of 3.5kN acts on the right leg of the dummy at P3. The maximum tibia load of 6.5kN acts on dummy at P3 and minimum (1.6kN) occurs at P3.
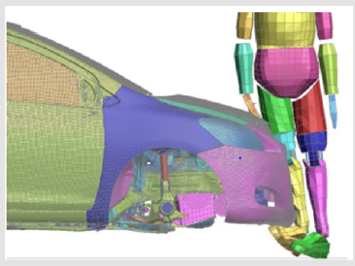
Figure 33: Pedestrian Collision at position P1- Stationary; T= 0.03s (Oasys, 2018).
Figure 34 shows the initial contact between the vehicle and the stationary dummy when the collision occurs at the centre of the vehicle front. An initial contact was made to the right leg, at t=0.03s, which immediately makes contact with the left leg resulting in higher load acting on the lower right side of the dummy which is shown in the data acquired. Figure 34 shows the simulation of the dummy walking at position P2. There’s two points of contact occurring in the lower leg during the collision with the vehicle in which the right leg was initially hit at t=0.03s followed by an impact to the left leg at t=0.04s. (Table 12) depicts the injury severity of the femur for both stationary and walking simulations. When the dummy is stationary, it will suffer fatal injuries when placed in positions P1 and P2 as the left and right femur loads were more than 25kN but severe injuries will occur when the dummy is in P3. However, in all the collision positions when the dummy is in a walking stance only moderate injuries will occur as the loads are below 10Kn (Table 13) shows the probability of injury severity for the tibia for the stationary and walking scenarios. Overall, when the dummy is in a stationary or walking stance, mostly severe injuries will occur for both walking and stationary simulations. However, moderate injuries can be observed occurring in the right leg when the dummy is walking at positions P2 and P3 as the values are below 5kN.
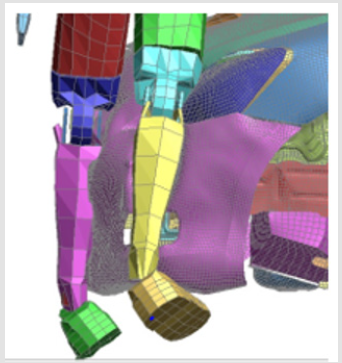
Figure 34: Pedestrian Collision at position P2- Walking; T=0.03 and T=0.04s (Oasys, 2018).
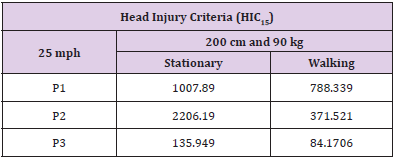
Table 12: HIC15 Table for 200cm, 90kg dummy.
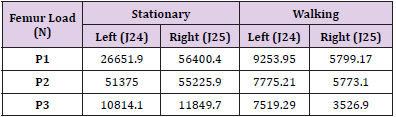
Table 13: Assessment for Femur Loads.
Discussion
The main purpose of this research is to conduct a series of simulations in order to evaluate the pedestrian injuries at different height and weight, and in different positions along the front end of the vehicle. From the simulations conducted for this study, it can be observed that an accident involving a vehicle and a pedestrian consists of 3 main stages which are the pedestrian’s impact to the bumper, the vehicle bonnet, and the collision to the windscreen. Even if the pedestrian is stationary or in a walking stance, the primary impact always occur to the legs which are mostly to the femur and the tibia, the secondary stage involves impact to the bonnet’s edge which causes injuries to the pelvic and upper leg area, and finally, the pedestrian’s head impact to the windscreen (Appendix Tables A & B).
The height, position and the stance of the pedestrian played an important part to the severity level of injuries during an accident. Pedestrians at 170cm and 185cm in position P2, stationary and walking, experiences moderate head injuries as the HIC values were lower than 1000. Normally, the dummy initially hits the bumper cover and immediately followed by a contact with the bumper beam, however, due to the vehicle’s front configuration (can be seen in Figure 11) there’s a longer duration between the bumper cover colliding with the bumper beam. This results in more bumper deformation therefore more energy is absorbed compared to the collisions occurring at position 1. A reduction in the pedestrian’s kinetic energy decreases the overall impact force which in turn reduces the severity of injury i.e. HIC. The bumper’s capability of absorbing energy plays a big role in causing the severity of injuries and therefore, this is the main reason that collisions occurring at the centre of the vehicle (P1) the pedestrians have a higher probability to suffer from severe to fatal head injuries (HIC>1000) due to the area of the front bumper’s inability to absorb kinetic energy. In a further critical examination for the pedestrians that are 185cm and 200cm in height, as the pedestrian collides at the corner of the vehicle (P3), it can be observed that there are low values of HIC for both scenarios especially when the pedestrian is in a walking stance and this is due to the head not having any contact with the vehicle during the crash. The height and stance of the pedestrian and the hitting position had a major influence on the pedestrian’s kinematics which results in generating the low HIC values (Tables 14 & 15).
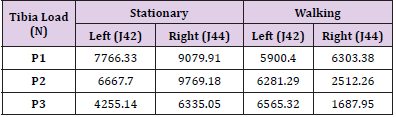
Table 14: Assessment for Tibia Load.
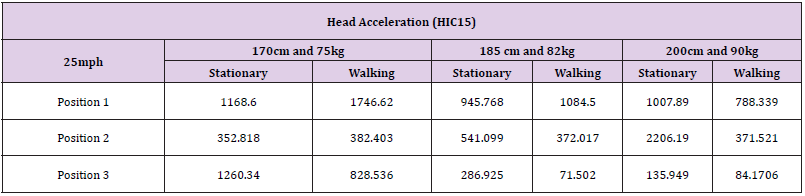
Table 15: HIC values for all simulations.
The lower extremity loads acting on the pedestrian during an accident were also generated for this study. By examining the results, it can be clearly seen that there’s a noticeable high femur loads acting on the pedestrians (at all height and weight) when stationary (Tables 16 & 17). The values of the femur loads are above 25kN which means the pedestrian has an 80% chance of AIS4+ injury occurring which have been reported to be fatal and can lead to permanent medical impairment. However, the femur loads acting on the pedestrian in a walking stance are considerably lower compared to when the pedestrian is stationary. Since the pedestrian is in a walking position (with left foot leading), both legs were not hit simultaneously but instead hitting the right leg first followed by the left leg which results in a higher femur load on the right side compared to the left side. Due to the femur loads being lower than 15kN, the pedestrian has only a probability of suffering from moderate (36% chance of AIS2+) to serious (49% chance of AIS3+) injuries which will not cause any permanent damage. Additionally, the results shown that for taller walking pedestrians especially at 200cm only moderate injuries will be arising when colliding with vehicle at all 3 positions ( Appendix Figures a-e).
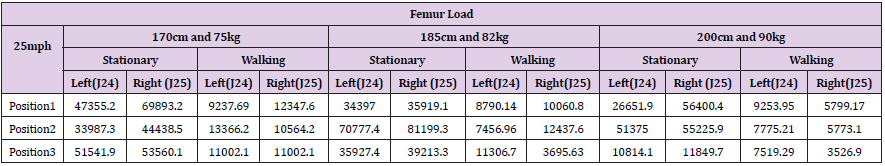
Table 16: Femur Load results for all simulations.
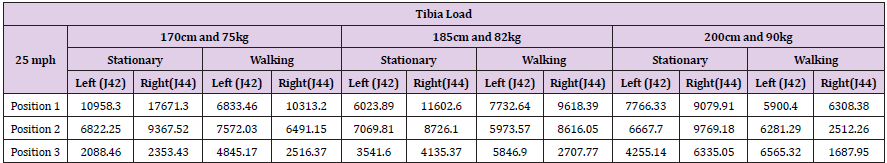
Table 17: Tibia Load results for all simulations.
The results for the tibia loads were also evaluated. Overall from the data acquired, the pedestrian at all 3 heights and positions has a chance of suffering moderate and serious injuries as the values of the tibia loads were observed to be below 10kN. Moreover, the collisions happening at the corner of the vehicle shows to not cause any severe injuries to the pedestrians. However, when the pedestrian collides at the centre of the vehicle it shows that there are chances of severe and fatal injuries developing and this observation is prominent when looking at the pedestrian at 170cm. It shows that the pedestrian experiences tibia loads greater than 10 and 15kN which results in 50% chance of AIS3+ and 60% chance of AIS4+ injury from occurring. This could lead to malleolar fractures and ankle ligament injuries. It is important to state that the data acquired is only a rough approximation of reallife situations and not the real outcome of what might happen in a traffic accident involving a car to pedestrian collision. There are still a lot of variables that needs to be considered such as the walking or running speed of the dummy, the speed of the vehicle and any other variables that might happen in real-life accidents.
Conclusion
To conclude, a total of 18 simulations were completed for this study which involves simulating car to pedestrian collisions at 3 different pedestrian heights and 3 different positions. The methodology for this research was conveyed which consists of the simulation set-up, process of gathering injury data, and analysis and the evaluation of the results using the injury severity probability assessment process shown in the results section of this thesis. From the data acquired it has been proven that the pedestrian’s, height, weight and stance by played a big role to the outcome of an accident. It can be clearly seen that the pedestrian suffers minor injuries while walking in comparison to when the pedestrian is at a stationary position. Problems that were raised during the generation of the results were the fact that the data on the neck injuries were not generated due to insufficient information to calculate the neck injuries. Additionally, running the simulations using local server was found not ideal for this study due to the long duration in order to run the simulation. Instead a High-Performance Computer (HPC) was used to run all the simulations as provides the processing power to finish the simulations as quick as possible.
Future Scope
After the conclusion of this report, more research could be
undertaken to extend the scope of the project:
a) Performing simulations at different vehicle speeds i.e.
30mph and 40mph.
b) Velocity can be applied to the dummy to simulate walking
and running scenarios and evaluate its effect on injury severity.
c) Examination of other damage criterion in car to pedestrian
collisions that has not been referred in this dissertation such as
the neck and thoracic injury criterion.
d) Utilising THUMS model to conduct the accident
simulations as it can simulate many aspects of the human form,
from skin and bone to muscle tissue and internal organs, which
will allow a better understanding of the real injuries people
might suffer in a traffic accident.
Utilising THUMS model to conduct the accident simulations as it can simulate many aspects of the human form, from skin and bone to muscle tissue and internal organs, which will allow a better understanding of the real injuries people might suffer in a traffic accident.
References
- (1966) Aerospace Standard, Performance standard for seats in civil rotor and transport airplanes, SAE AS 8049.
- (2017) Auto Express, What is Euro NCAP? Car safety, star ratings and dual rating crash test scores.
- (2018) Chalmers University of Technology. Human Body Modelling.
- Crandall (2008) Designing road vehicles for pedestrian protection.
- Department of Transport (2018) Reported road casualties in Great Britain: 2017 annual report.
- (1971) Department of Transportation NHTSA Docket 69-7, Notice 9, Occupant crash protection, $6.2 of MVSS 208.
- EEVC (1996) EEVC test methods to evaluate pedestrian protection afforded by passenger cars.
- (2013) Engineers Journal, Pedestrian injury biomechanics, crash safety and device design.
- Euro NCAP (2012) Assessment Protocol- Pedestrian Protection.
- Euro NCAP (2013) Head Impact.
- Euro NCAP (2014) Lower Leg Impact.
- Euro NCAP (2015) Upper Leg Impact.
- Euro NCAP (2017) Assessment Protocol- Adult Occupant Protection.
- Euro NCAP (2018) AEB Pedestrian.
- Euro NCAP (2019) Vulnerable Road User (VRU) Protection.
- (2019) European Commission (n.d.) Pedestrians.
- (2017) Eurostat, Persons killed in road accidents by type of vehicle (CARE data).
- UK (2018) Road Accidents and safety: Tables Index.
- Ruan JS, Khalil TB, King AL (1993) Finite element modeling of direct head impact, Proc. 37th Stapp Car Crash Conference, SAE Paper 933114.
- Mertz H, Prasad P, Nusholtz G (1996) Head injury risk assessment for forehead impacts.
- (1999) National Highway Traffic Safety Administration. Final economic assessment; FMVSS No. 201 Upper interior head protection. Washington.
- (1999) NHTSA, Development of Improved Injury Criteria for the Assessment of Advanced Automotive Restraint Systems.
- NHTSA (2009) Lower Extremity Injuries and Associated Injury Criteria.
- NHTSA (2016) Traffic Safety Facts: Pedestrians.
- NHTSA (n.d.) comparison of hic and bric head injury risk in iihs frontal crash tests to real-world head injuries.
- (2019) NSW, Abbreviated Injury Scale.
- Yutaka O, Tomiji S,Koji E, Junichi K (2010) Pedestrian Head Impact Conditions Depending on the Vehicle Front Shape and Its Construction-Full Model Simulation.
- (2017) ROSPA, Road Safety Information: Pedestrian Protection.
- Ash SJ ton, Pedder JB, Mackay GM (n.d.) Pedestrian Leg Injuries, The Bumper and Other Front Structure.
- (2009) Simms and Wood, Pedestrian and Cyclists Impact a Biomechanical Perspective.
- Statista (2019) Road accidents in Europe - Statistics & Facts.
- (2013) WHO, More than 270000 pedestrians killed on roads each year.
- (2016) WHO, Reported distribution of road traffic deaths by type of road user: Data by country.
- (2015) WHOGlobal Health Observatory (GHO).
