 Research Article
Abstract
Background: Hip fractures configure an important public health issue, most commonly, serious muscular-skeletal injuries which affect the elderly population. The annual burden of hip fractures is anticipated to increase over the next few years as the age demographic of the UK changes. There is considerable mortality and morbidity associated with these injuries. Therefore, conduction of research to help prevent these of fractures is of great magnitude. Computed tomographic (CT) scan-based finite element (FE) modelling is a tool which can predict proximal femoral fracture loads in vitro. In this regard, the aim of the present study is to examine whether FE models created from CT scans in situ and in vitro yield comparable predictions of proximal femoral fracture load. CT scans of the left proximal femur of two human cadavers were gained in situ and in vitro: three-dimensional FE models employing non-linear mechanical properties were generated from each CT scan. The models were gauged under single-limb stance-type loading by incremental application of displacements to the femoral head. The result showed that the fracture load for the in situ model was 7.3 % greater than as in vitro derived model. Therefore, these results exhibit that using CT scan data obtained in vitro used to generate FE models has a better fracture loads predication compared to using CT scan data obtained in situ. This approach must be considered when using Computed Tomographic (CT) scan-based Finite Element (FE) modelling to predict proximal femoral fracture load in vivo.
Keywords: Biomechanics; Computed Tomography; Finite Element; Fracture Load; Proximal Femoral
Introduction
Hip fracture is regarded as the most significant osteoporotic fracture in terms of health consequences, quality of life, and cost. Owing to the aging population, it has been estimated that the total number of hip fractures worldwide will increase from 1.3 million in 1990 to 2.6 million by the year 2025 and to 4.5 million by the year 2050 [1]. Approximately one-third of the population over the age of 65 suffer a fall each year, rising to over 50% by the age of 80 [1]. In the UK, 75,000 patients suffer hip fractures each year at an annual cost of approximately £2 billion [2]. The lifetime risk of sustaining a hip fracture in the United Kingdom from age 50 is around 11% for women and 3% for men [3]. Hip fractures have a devastating impact on patients including death, depression, disability, institutionalization, fear of falling, and social isolation [4,5]. Older patients presenting with hip fractures encompass some of the frailest and sickest patients, with complex medical difficulties and comorbidities, who have to surmount the additional physiological challenges posed by trauma and surgery [6]. Consequently, hip fractures related to morbidity and mortality remains high, with approximately 10% of patients dying within 1 month, 30% at 1 year and 80% at 8 years following hip fracture. Death tends to be associated with a patient's comorbidities, rather than the hip fracture itself.
In addition, nearly 40% of patients will not return to their preinjury residence [7]. For these reasons, research to help prevent hip fracture is essential. Finite element (FE) models are useful tools in helping to understand the underlying causes and mechanisms of hip fracture [4-8]. Recently, calculated tomographic (CT) scan-based FE models utilizing non-linear mechanical properties have been shown to predict proximal femoral fracture loads in vitro with a relatively high level of precision (r = 0.96 for measured vs. predicted fracture load) [9]. In the future, this modelling technique might be used in vivo for research or for clinical purposes. With this motivation, the present study scrutinizes whether FE models generated from CT scans of proximal femora in situ and in vitro in vitro produce comparable predictions of proximal femoral fracture load.
Methods
For the current study, one human cadaver was selected from a 65-year-old male with the stature and weight of 180 cm and 84.5 kg respectively. This subject has the characteristic mass and stature close to the average adult male and cause of dearth was carcinoma of the heart. In the current study geometry of the left proximal femur complex has been scanned by CT scanner, with examination showing no signs of metastases or other abnormalities such as previous fractures present in the femur. Following initial examination, the left proximal femoral specimen was removed from the cadaver for in vitro CT scan. The in vivo and in vitro data was collected by the department of Radiology, Milad hospital, Tehran, Iran. From the CT scan, shown in Figure 1, cortical and cancellous bone can be distinguished, alongside soft tissue such as muscle. The CT scan also provided data in terms of bone density shown in Figure 2. The initial data was collected using the following parameters: Siemens, 110 kVp, 105 mAs, 5 mm thick slices at 2.5 mm interval, total of 255 slices, with an in-plane resolution of 0.7mmx0.7mm (pixel size). For in vitro CT scan of the of femur specimen the soft tissue was removed and immersed in water to maintain the properties of the femur as close to that of the femur in vivo, this will also reduce and cut down artefacts', see Figure 2. The in vitro CT scan in vitro used the same parameters as the in-situ scan, except that a pixel size of 0.75mm×0.75mm was used. This method has been used in previous studies, Keyak [10]. The different pixel sizes will not have influenced the study results because the image quality varies depending on the pixel spacing. The resolution is determined by the slice thickness and the finite elements, which are larger than the pixel size and therefore determined the overall model resolution. The 235 slices of the CT scan data of each femur is collected in the DICOM format (Digital Imaging and Communications in Medicine), which is then uploaded to, SIMPLEWARE (version 3.1Simpleware, UK), to produce the solid model, see (Figures 3 & 4). The output of the Simple ware software was converted into the DXF format and transferred to the IGS format by using FEA software, in this case ANSYS. Then, the IGS data of each solid model, both in situ and in vitro, was translated to generate a 3D- FE model of the human pelvis-femur complex. The FE modelling was conducted using finite element software LS-DYNA. LS PREPOST 3.1 was used to analyze the results and also to create the models in the pre/post-processor. The method of producing each of the FE models from CT scans, and mechanical testing procedures used in this study have been described in detail in a previous study, Razmkhah[11].
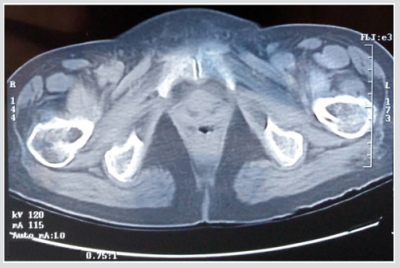
Figure 1: CT scan in situ.
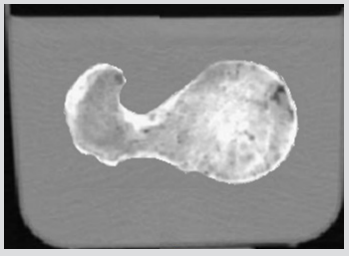
Figure 2: CT scan in situ.
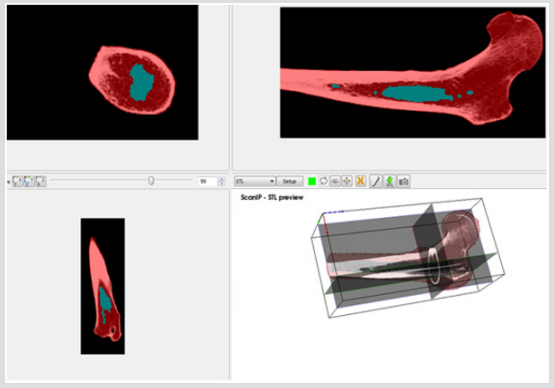
Figure 3: Active slices in 2D and 3D views.
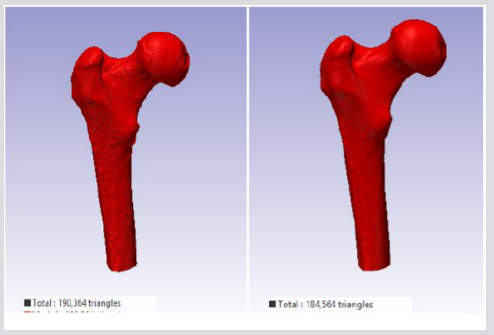
Figure 4: 3D views
a) Before and
b) After applying the Recursive Gaussian smoothing filter.
Explicit Finite Element Analysis
Material Properties of Cortical and Cancellous Bone for Each Model: Cortical, The classical bilinear isotropic roughening model requires an elastic and plastic slope to represent the stress-strain behaviour of a cortical bone material, the Piecewise linear plasticity material was chosen for each simulation (in situ and in vitro) for this study in this Piecewise, the linear plasticity material, can be defined as an elasto-plastic material with an arbitrary stress versus strain curve and arbitrary strain rate dependency (Table1), [12]. The stress-strain behaviour can be treated by a bilinear stress-strain curve by defining the tangent modulus. This material includes two responsibilities; strain charge per unit effects, and failure touchstones. In LS-DYNA the cortical bone was modelled by using type 24 which is defined as MATERIAL_PIECEWISE_LINEAR_PLASTICITY, pertaining to von misses yielding conditions with isotropic strain hardening, and strain rate-dependent dynamic yielding stress based on Cowper and Symonds model. The development of stress beyond yield (according to scaling algorithm) for this model is:
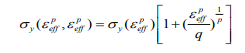
where  ,are the effective plastic strain and strain rate, p and q are strain rate parameters.
Cancellous, Ascertaining the elastic constants of cancellous bone by conventional mechanical run procedures leads to issues due to the small sample size of specimens of human cancellous bone. The data analysis methods countenance the identification of the elastic constants of trabecular bone as function of the volume fraction (BV/TV) [13-15]. The final consequences are that the solid volume fraction is dependent on orthotropic Hooke's law for cancellous bone with correlation coefficient of 0.934 as follow: Therefore, in this study, the cancellous bone was treated as an anisotropic material, using the following equations:
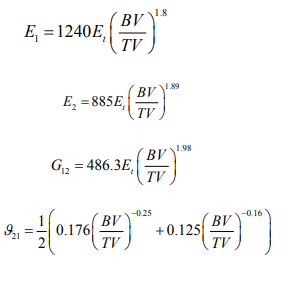
Therefore, for cancellous bone, the Material model 54 of LS-DYNA was selected to model the damage of cancellous bone and The Chang- Chang failure criterion, which is a modification of the Hashin's failure criterion, was chosen for appraising the failure in each computer simulation (Table 1).
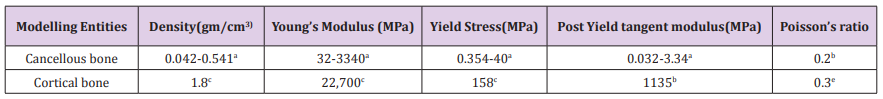
Table 1: Details of material properties for the 3D FE model of the pelvis-femur complex [13].
Mesh Sensitivity Analysis and Contact Constraint
The accuracy of the model as to the porosity and void inner parts is really important because this will determine the mechanical toughness of the femur and consequently, the future precision of the results obtained from impact simulations of different load cases. Figure 5 depicts the rendering of a translucent modelled femur obtained from ScanIP software with opacity of the external part at 0.2 and the cavity with no opacity to observe the structure. Figure 6 shows the distribution of mass density along the bone (a) and cross section of mass-density rendering (b) whilst Figure 7 shows the distribution of Young’s modulus. Although each of these two images is represented in different orientation, it is well worth noting that the distribution of both parameters in the meshed elements of bone is the same. It is also remarkable, in Figure 6, there is less mass density in the head of the femur where the bone is trabecular, the porosity is higher and therefore the mass density of the tissue is lower. The head of femur, which part is almost a sphere, is directly in contact with the hip. The cortical bone in each simulation has been done in LS-DYNA with Piecewise linear plasticity material type under the integrated shell elements (integration with four points). Contacts between separate Mashhad objects have to be laid as a permutation for boundary conditions. Between the boundaries of side by side objects, constraints are necessary to foreclose penetration during motion as gaps initially exist. Good contacts are essential to confirm that the model follows the correct geometry with the gaps in question. Two contacts are created between the thighbone structures and the rigid structures using tied contact surfaces.
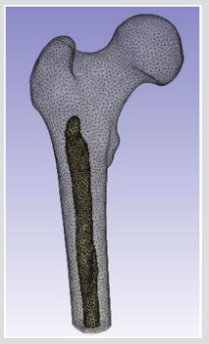
Figure 5: Rendering of a translucent modelled femur in Scan IP.
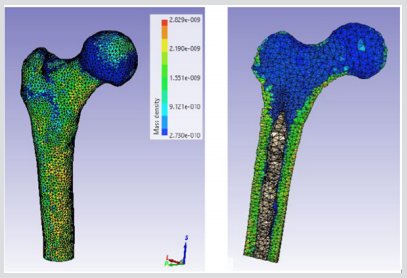
Figure 6:
a) Distribution of Mass density
b) Cross section of mass-density rendering
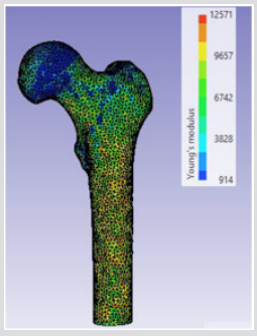
Figure 7: Distribution of Young’s modulus along the femur in Scan IP.
Finite Element Modelling (FEM)
The numerical example presented here follows closely the experimental investigation discussed by Keyak, 2001 and Razmkhah, 2014, where a left proximal femur of a male (age 61) was loaded until failure under one-leg stance. Both of the models were evaluated under the single limb stance type load condition used previously to validate this FE modelling method [10,11]. The 3D geometry of the femur from different CT scans (in situ and in vitro) was modelled using SHELL 163 which is a 4-node element with both bending and membrane capabilities (the model in situ contain 27,128 nodes, 52,875 elements and the model in vitro contains 26,016 nodes and 50,654 elements). For the element the Belytschko-Lin-Tsay quadrilateral element formulation was used as it is the fastest of the explicit dynamics shells. This element formulation is based on the Mindlin- Reissner assumption to include the transverse shear [16].
Force Application
The striker for each computer simulation was modelled as a rigid block, applying solid element and a node impacting surface with a friction coefficient of 0.35, which is measured experimentally to avoid lateral movements between the contact and rigid plate, Figure 8. In order for penetration of the boundary to occur by its own nodes, a single surface contact algorithm without friction was used for each computer simulation to foreclose. To imitate the quasi static condition for each subject, a load speed of 1 m/s was applied to the rigid striker for each simulation. The models were loaded by applying displacements incrementally with an orientation of 20◦ from the vertical to the top surface of the acetabulum. The explicit time desegregation method is only conditionally stable, and therefore, by applying real crushing speed, very small time increment is required. In this case, the reaction of the internal energy is very similar to one another and the kinetic energy is negligible in comparison to the internal energy of the femur. For quasi static conditions, the total kinetic energy has to be very small compared to the total internal energy over the period of the quasi static process and the force displacement reaction must be independent from the applied speed. In Figure 8, the force-crush distance of all off-axis loading angles extracted from FEA model are compared with experimental results in conjunction with previous study model presented by Keyak, 2001 [10]. The difference in maximum force and energy absorption between the FEA model and experiment in situ is less than 35% and in vitro is less than 28%. These results were also compared with the previous study by Razmkhah, 2014, which shows that, the difference in maximum force and energy absorption between the FEA model in situ is less than 22% and in vitro is less than 7.5%, shown in Figure 9.
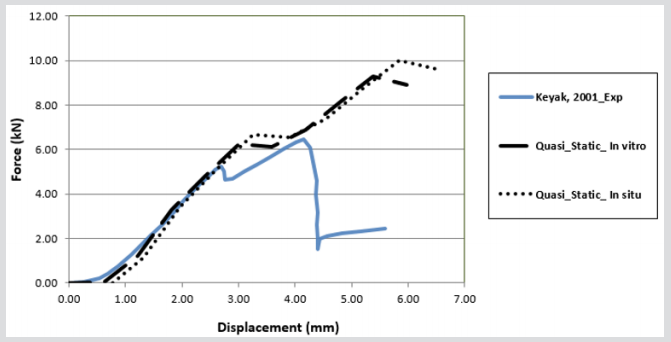
Figure 8: Comparison of Experimental data (Keyak, 2001) and FE in vitro and situ modelling
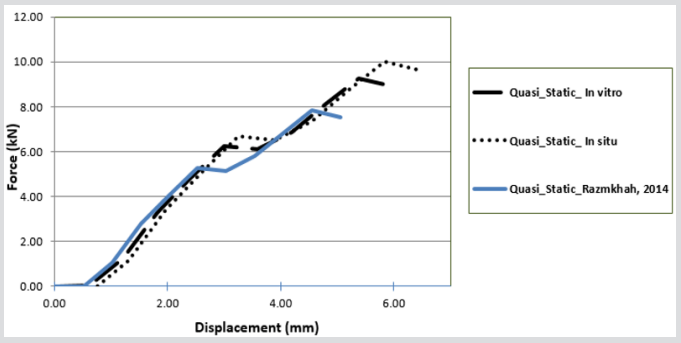
Figure 9: Comparison of Experimental data (Razmkhah, 2014) and FE in vitro and situ modelling
Effect of Various Impact Velocities
After comparison of the previously validated models, the process of hip fracture was investigated in LSDYNA® with respect to the effects of hip impact speed, V, to the variations of damage likely to occur. In this study various impact speeds of 1.9, 2.3 and 3 m/s as well as the cortical thickness of 3.4, 3.7 and 4 mm were chosen [11,13,17-18]. The body weight of this model was set at 84.5 kg, and in this case, the applied kinetic energy during the sideways fall was quantified according to various impact velocities. The solver was set for a 70 mms fall duration, see Figure 10 & 11. In the second part of this study, the absorbed impact energy for various cortical thicknesses with various impact speeds have been compared, (Figure 12). As it can be seen in Figure 12, an increase of cortical thickness causes higher energy absorption capability within bone structure and also changing the impact velocity (1.9, 2.3, 2.6, 3.1, 4, and 4.5 m/s) with a constant cortical thickness of 3.4mm, 3.7mm and 4mm. Due to an increase of impact velocity, the experienced acceleration by the bone increased to higher values which causes raising the acceleration-time curve. Therefore, these results shows that the impact energy at different cortical thicknesses (3.4mm, 3.7mm and 4mm) increases the energy absorption capability of bone structures by increasing the impact velocity.
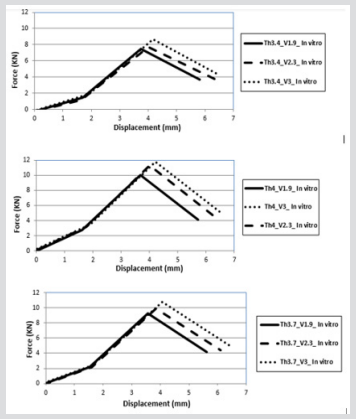
Figure 10: Force-displacement results for various cortical thicknesses in vitro FEA model
a) 3.4 mm
b) 3.7 mm
c) 4mm and impact velocities.
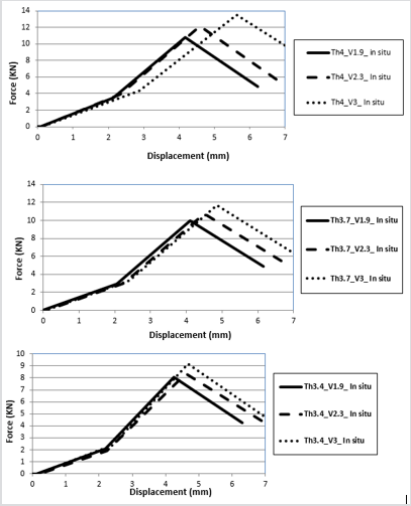
Figure 11: Force-displacement results for various cortical thicknesses in situ FEA model
a) 3.4 mm
b) 3.7 mm
c) 4mm and impact velocities.
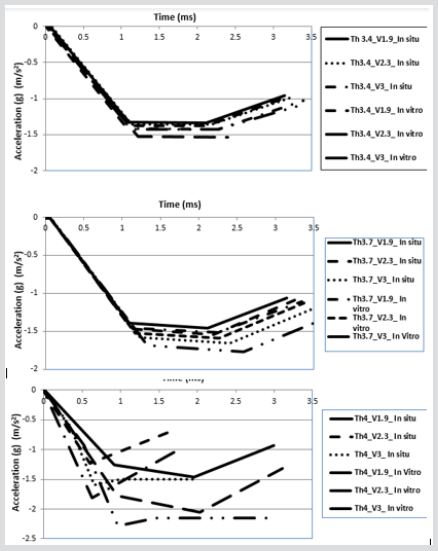
Figure 12: Acceleration-time histories for variation of cortical thickness.
Effect of Intertrochanteric Crack in Sideways Falls on Different Cortical Thicknesses and Impact Velocities
This study evaluated the ability of automatically generated, CT scan-based linear FE models of the proximal femur, to predict two aspects describing fracture location and fracture type. Fracture location was defined as the specific location of the fracture and was the more discriminating parameter. Fracture type was a categorical variable defined as either a cervical or a trochanteric fracture. Two loading circumstances were examined, single-limb stance and simulating an impact from a fall. These FE models have been validated previously for predicting proximal femoral fracture load [11]. Since fractures are unpleasant, debilitating events the mechanical performance of bone plays a crucial role in the quality of life that is experienced. Some kinds of fractures are quite clearly caused by the fact that bone is exposed to loads that surmount certain threshold levels (with regard to stress or damage); which can also be protracted (creep), or persistent (fatigue). Other types of fractures are due to structural compromise of the bone such as: disease, surgical intervention, poor diet, ageing, lack of exercise, pharmaceutical treatments, etc. In all conditions it can be postulated that by implementing either material/engineering principles to demonstrate the influences of overload, or structure/function correlations to encounter with the consequences of a materially and structurally compromised tissue [19]. To develop the FEA simulations in this study from previous studies cracks were introduced into the FEA solid models, these were formed and initiated at the femoral neck and interochanteric region, to represent what may occur in reality, these types of fractures are the most common reported [20]. The crack dimensions used for these models have been previously defined by Koester [21]. In summary the crack is initiated in a straight line with a width of 3 mm and propagated under an angle of 43.80 ± 6.7 from the horizontal (Figure 13). Boundary and loading conditions are the same as the conditions set for the FEA models examining the impact speeds and thicknesses in the previous sections as well the weight of the virtual model. However, in this case, the cortical thickness was kept constant at 3.7 mm, representing the average thickness of cortical bone and the applied kinetic energy during the sideways fall was quantified according to various impact velocities (Figure 14).
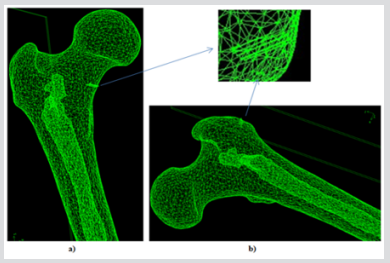
Figure 13: FEA model of the different cortical thickness and Impact Velocity on Neck and Intertrochanteric Crack in Sideways Fall.
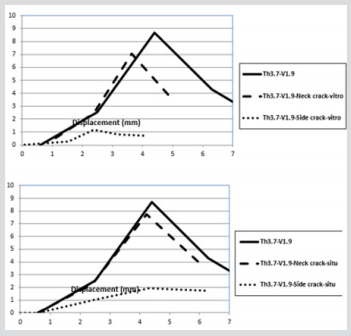
Figure 14: Force-displacement histories of cortical and impact velocity on Neck and Intertrochanteric crack in sideways fall in vitro and situ.
Experimental validations
A Practical Approach: Biomechanical analysis of human bone includes two frequently used methods: the first experiment carried out is in-vivo; this is followed by in-vitro Human bones are used for in vivo experimental studies, which provide an accurate picture of what is relevant and comparable to the in vivo situation with regards to the types of fractures that can occur during an injury. As a result, for almost a century, mechanical in-vitro tests have been carried out on human cadaveric bones and long bone implants [21]. Cadaver bones which have been embalmed have succeeded in preventing change in mechanical properties only after several months of the specimen being embalmed [14]. The inter-specimen variability in material and geometric properties is the most essential aspect that faces both cadaver and embalmed bones as a result of natural variability. The studies carried out by Zdero et al. [22], showed that torsional and axial stiffness for intact human femurs varied by 3.3 and 3.2 times. Due to this inconsistency between specimen results there is a large discrepancy in measured results. Synthetic long bones have advantages over cadaveric specimens and as a result are becoming more popular. Synthetic long bones are easy to manufacture and have geometry with a greater consistency; 20-200 times more uniform than cadaveric bones.
These bones do not decay over time, they are easy to store, non-toxic and are available commercially and relatively cheap to acquire. This in turn includes the FEA modelling software which has enabled the development of more accurate models that behave similarly to actual human bone [23,24]. Studies show that FEA provides a close approximation for comparing the performances of several implants. However, for absolute predictions, clinical conditions would need to be replicated. Although FEA cuts down costs and time complicated models have limitations. On such limitation is introducing fracture fixation devices and the modelling of forces. These become difficult to model on FEA requiring assumptions to be made which may not be valid (which in turn may not give accurate results). For example, boundary conditions in FEA at the interfacial contact regions could affect the distribution of loads between bone and implant. The assumption of bonded contact between the two surfaces in order to achieve perfect Osseo integration is considered in FE models i.e. bony growth around the implant. In reality this may not affect results. This investigation focuses on the assessment of the mechanical behavior of the femur bone compared to the fresh-frozen specimens experiment carried out by Keyak [21] and the developed FEA model. FE models usually treat bone as a continuum as opposed to focusing on its microstructural details. This approach is enough for implant design when relative rather than absolute results are used in comparison between devices with respect to performance. It is essential that clinical conditions are replicated should the absolute quantitative performance of an implant be predicted. Even though many researchers persevere to legitimately carry out experimentation and FEA separately from one another, combining the two has advantages. Experimentation would be able to assess on what degree an FE model can successfully replicate more real-world conditions.
FEA on the other hand, has the ability to mimic loading conditions and extend data analysis far more than what is possible to perform in a laboratory setting. Two caveats must be kept in mind; firstly, experimental setups should be able to simulate real-world physiological conditions as much as possible even though their inevitable limitations are recognized. Secondly, accurate and proper verification, validation and sensitivity of the FEA analysis should be run to ensure that the models are working properly. The aim of this section will be to present practical tools for engineers and clinicians, who, using this information in combination with FEA studies to successfully carry out orthopedic biomechanics research to provide a more a detailed depiction of what is occurring during fracture.
Specimen Preparation
Three medium-size fourth generation composite bones (model number: 3403) from Sawbones (Pacific Research Laboratories, Inc., Vashon Island, WA, USA) were examined in this study. Each composite femur was fixed by a clamp then the femur was subsequently sectioned at two-thirds of its length below the femoral head, and at 250 mm distal to the lesser trochanter and then cut. The composite femur bone was inserted into a jig to a depth of 100mm and secured inside the jig with 8 bolts to provide a mechanical restraint, and the jig was secured onto the baseplate of the test machine, this method has been used previously by Kayak (2001) and more recently by Razmkhah [10-11].
Anatomy and the Loading Conditions of the Force on Hip
This section describes the methodology used for both the experimental and computational studies. The two forces acting on the bone are Fpelvis and Ftibia: Fpelvis is acting on the femoral head, thereby the mechanical axis; Ftibia is acting on the tibia, in the upwards direction in the femoral axis which can see in Figure 15. The mechanical axis is defined as the line between the two forces acting on the femur in its anatomical position. The femoral axis is the line that is parallel to the shaft of the femur. The angle between the femoral axis and the transverse plane is θ. In this study, the angle between the mechanical and the femoral axis is α, which was set at 11°, and the composite femur bone was aligned at 20° adduction as shown in Figure 16. The vertical and horizontal edges of this jig fixture base also served as a coordinate system that was fixed in relation to the femur to facilitate accurate vectorial derivation and modeling of the applied load. The positioning of the femur bone at the given angle of θ = 20° was necessary so as to try and replicate the way a natural femoral head is distally referenced in the two-legged stance of a human being [25,26]. In this regard, values close to those acquired from the simulations of tensile stress loadings experienced on the natural femoral head could be obtained. The composite model was then loaded on to an axial load testing machine between a platen and a jig secured to a datum as shown in Figure 17. Experiments were carried out on a Zwick/ Roell machine, which included a load cell of 25 kN capacity, with a resolution of 0.1 N, and accuracy of ±0.5%. The loading frame was at an axial stiffness of 8 KN/ 50mm, joins withstanding a force of up to 7 KN / 50 mm which is 150-250 times stiffer than intact synthetic and human cadaveric femurs. A vertical compressive load was applied on the femoral head of the bone with a displacement control of 0.5mm, at a rate of 100 mm/sec.
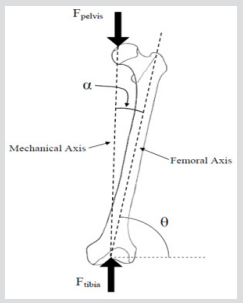
Figure 15: Free body diagram of loading conditions in the frontal plane view [20].
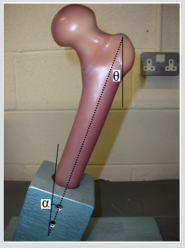
Figure 16: Free body diagram of loading conditions in the frontal plane view [20].
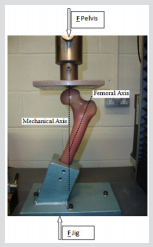
Figure 17: For the stance configuration, force was applied to the femoral head over a 3cm diameter region within the coronal plane and directed at 20° to the shaft axis while the shaft was restrained.
Results of Validation
Experimental data pertaining to the mechanical behavior of the femur was conducted to validate the numerical methods, which are used to assess femoral strength and bone quality. The inconsistency between force-displacement curves from mechanical testing of the cadaver and computational models was minimal in comparison with the previous models. In all of the specimen composite bones, the fracture was represented as a brittle crack, occurring at the same place, in the neck-trochanter junction. The fracture started initially in a small region on the superior surface and then abruptly progressed through the neck region, where low strains were measured in the FEA simulations (Figure 18). Qualitative analysis of the patterns due to fracture at the neck-trochanter junction looked very similar, however slightly more lateral to those reported for human cadaver femora in previous work by Kayak et al. (2001). The force-displacement results showed similar behaviour in the linear region for all bones. The femur experienced high peak stresses along the neck region, and surface stresses increased as the loads increased, particularly in the proximal region. The results also show that the peak stresses are concentrated in the superior region of the femoral neck; particularly in the posterior region. It appears that micro-damage has been caused as a result of loading which could lead to sub capital fractures. In Figure 18, the force-crush distance of all off-axis loading angles which were extracted from the composite bones are compared with experimental data from Keyak (2001) and FE modelling results in situ and in vitro. The difference in maximum force and energy absorption between the composite bones and FEA models are 3396 N in situ and 2665 N in vitro.
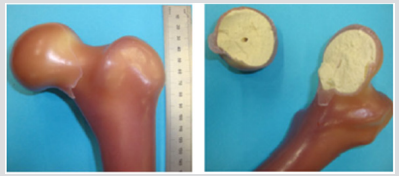
Figure 18: Shows a Sub capital neck fracture caused due to fatigue under the loading conditions. It is seen that the fracture occurs at the superior surface of the femoral neck and travels down to the inferior surface at the junction between the femoral head and the femoral neck.
Discussion
The research has demonstrated that the FFE results obtained from CT data gathered from the in-situ femur, in comparison to the CT data gathered from the femur in vitro showed a 7.3% difference in the fracture loads experienced by the femur following FEA simulation, Figure 19. The effect of uncertainty in displacement directions on fracture load was negligible, a difference of 2% was reported by Keyak et al. (2001), and the improvement in reduction of uncertainty can be attributed to the improved accuracy and resolution of the CT data used in this study. The quality of the data obtained from CT scans can be influenced by other factors such as noise, beam hardening bone structure and soft tissues as well surrounding the femur. Therefore, these factors must be taken into consideration in order to reduce errors in the accuracy of the FE model that will construct using the CT scan data. In situ and in vitro comparisons of CT data, in the relevant in situ and in vitro FE models, showed marked differences. For example, density increase related to material strength increase, subsequently, FFE will increase. Furthermore, there was an increase in the cross-section area, related to stress decrease when force is applied via axial loading/bending. This would have the effect of increasing FFE, if it was to occur in a stressed part of the bone such as the sub capital region of the femur for example the femoral neck. Keyak reported a difference of 13.3% FFE for the in situ and in vitro states for the femur; the current study has shown a difference of 7.3% for FFE. FFE from CT data in situ was 10,016 N and for the model in vitro was 9,285N.
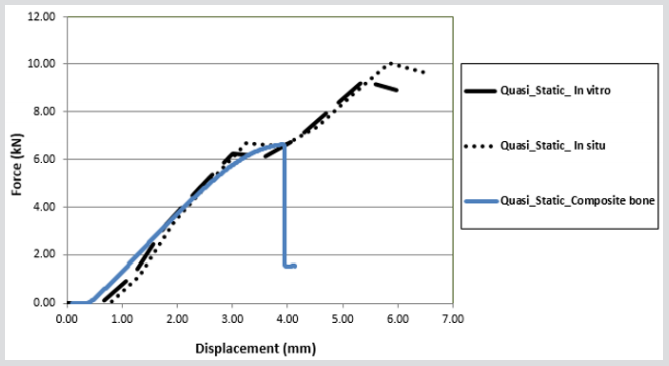
Figure 19: Comparison of experimental data with FE modelling in vitro and situ.
FE-predicted fracture loads can be influenced by many factors; hence, assumptions and approximations were implemented in the FE analyses, and included particular relationships. For example, between mechanical properties and thickness of cortical and trabecular bone (Jóhannesdóttir, 2012). Furthermore, isotropic properties and the theory of distortion-energy failure affected results generated from the FE model. Also, loading situations were made less complex in that the force was applied in the coronal plane, and excluded muscle forces, that would normally be acting upon the femur in situ. In contrast, distinctions between the FE models constructed from in situ and in vitro CT data could be affected by interactions of density and mechanical properties of the femur. However, fracture loads and applied forces may need to be determined for additional loading circumstances and forces attributable to muscular action may also be required and considered. This study has shown that FE models constructed from in situ CT data can provide accurate information to construct an FE model that will be able to predict fracture loads that are likely to occur in a femur fracture. The quality of the CT data will ensure that mechanical properties of bone are closer to what may actually occur during an incidence of fracture.
Conclusion
The present study examined whether FE models produced from CT scans, both in situ and in vitro, provide comparable predictions in terms of proximal femoral fracture load and concluded that largely different envisaged fracture loads were apparent. In vivo research on whole-bone strength of proximal femur was undertaken with FE analysis which is a cutting-edge technology for non-invasive assessment of femoral strength. For the future, this modelling technique could be utilized in in vivo for research or for clinical purposes. With this tenet, the current study examined whether FE models via CT of proximal femora, both in situ and in vitro, generate comparable prognoses of proximal femoral fracture load. Results showed different magnitudes of force which were noted when proximal femoral fracture load from in situ CT gathered data was compared to in vitro CT gathered data. Furthermore, the specimens demonstrated larger size dependence, with the greater differentials in fracture loads because of the inconsistent statistical trends with respect to cross-sectional area and density. This biomechanical testing methodology consisted only of quasi-static axial load application and does not represent the multi-planar or dynamic loading likely experienced in vivo.
However, on the basis of the erstwhile literature, this study shows that the loading of the femur in 20° of lateral tilt in the coronal plane represents an accurate summation of the main forces acting at the hip joint during the one-legged stance phase of gait. Cyclic loading of the femoral pairs might similarly be more physiologically relevant. Nevertheless, quasi-static axial loading of the femurs using the described testing configuration provided a comparative means to quantify strength reductions in femurs containing high-risk lesions of the proximal femur, and believe the findings are translatable to the real-world situation. The selection of a loading rate of 2 mm/s is likely to be more in line with those undergone by the hip during the activities of daily life, contrasted with those experienced during a fall, which have been approximated to be roughly 100 mm/s. Unlike fractures of normal, healthy bone, pathologic fractures are known to occur during regular activities or following minor trauma as a result of enervating of the bone by metastatic disease, adding justification to our use of this loading rate.
References
- Pfortmueller CA, Kunz M, Lindner G, Zisakis A, Puig S, et al. (2014) Fallrelatedemergency department admission: fall environment and settings and related injury patterns in 6357 patients with special emphasis on the elderly. Sci World J pp: 256519.
- (2014) National Institute for Health and Care Excellence. Hip fracture: the management of hip fracture in adults.
- Van Staa TP, Dennison EM, Leufkens HG, Cooper C (2001) Epidemiology of fractures in England and Wales. Bone 29(6): 517-522.
- Volpato S, Guralnik JM (2015) Hip fractures: comprehensive geriatric care and recovery. Lancet 385: 1594-1595.
- Magaziner J, Hawkes W, Hebel JR (2000) Recovery from hip fracture in eight areas of function. J Gerontol a Biol Sci Med Sci 55(9): M498-507.
- (2007) British Orthopaedic Association. The care of patients with fragility fracture. London: British Orthopaedic Association.
- Chesser T, Kelly M (2013) Management of hip fractures in the elderly. Surg e Oxf Int Ed 31: 456e9.
- National Institute for Clinical Excellence, Falls: the assessment and prevention of falls in older people. Clinical guideline 21. London: National Institute for Clinical Excellence.
- (2009) Scottish Intercollegiate Guidelines Network. Management of hip fracture in older people: a national clinical guideline. SIGN Guidelines. Edinburgh: Scottish Intercollegiate Guidelines Network p. 48.
- JH Keyak, SA Rossi, KA Jones, CM Les, HB Skinner (2001) Prediction of fracture location in the proximal femur using finite element models. Med Eng Phys 23(9): 657-664.
- O Razmkhah, H Ghasemnejad (2014) Explicit finite element analysis to predict impact damage response of osteoporosis hip bone, Computer Methods in Biomechanics and Biomedical Engineering: Imaging & Visualization 4(1).
- Majumder S, Roychowdhury A, Pal S (2008) Effects of trochanteric soft tissue thickness and hip impact velocity on hip fracture in sideways fall through 3D finite element simulations. J Biomech 41(13): 2834-2842.
- R Hambli, A Bettamer, S Allaoui (2012) Finite element prediction of proximal femur fracture pattern based on orthotropic behaviour law coupled to quasi-brittle damage. Medical Engineering & Physics 34(2): 202-210.
- B Van Rietbergen, A Odgaard, J Kabel, R Huiskes (1996) Direct mechanical assessment of elastic symmetries and properties of trabecular bone architecture. Journal Biomechanical Engineering 29(12): 1653-1657.
- J Kabel, B Van Rietbergen, M Dalstra, A Odgaard, R Huiskes (1999) The role of an effective isotropic tissue modulus in the elastic properties of cancellous bone. Journal Biomechanical Engineering 32(7): 673-680.
- H Ghasemnejad, H Hadavinia, D Marchant, A Aboutorabi (2009) Energy Absorption of Thin-walled Corrugated Crash Box in Axial Crushing. SDHM 98(1): 1-17.
- MJ Gomez, JM Garcia, M Doblare (2005) Finite element prediction of proximal femoral fracture pattern under different loads. Journal of Biomechanical Engineering 127(1): 9-14.
- AJ Kroonenberg van den, WC Hayes, TA McMahon (1995) Dynamic models for sideways falls from standing height. Journal of Biomechanical Engineering 117(3): 309-318.
- JY Rho, L Kuhn Spearing and P Zioupos (1998) Mechanical properties and the hierarchical structur of bone. Journal of Medical Engineering & Physics 20(2): 92-102.
- KJ Koester, JW Ager, RO Ritchie (2008) The true toughness of human cortical bone measured with realistically short cracks. Journal of Nature Materials 7(8): 672-677.
- RA Wainer, PH Wright, JA Gilbert, DF Taylor (1990) Biomechanics of Ender rods, compression screw, and Zickel nail in the fixation of stable subtrochanteric femur osteotomies. Journal of Orthopedic Trauma 4(1): 58-63.
- R Zdero, S Rose, EH Schemitsch, M Papini (2007) Cortical screw pullout strength and effective shear stress in synthetic third generation composite femurs. Journal of Biomech Eng 129(2): 289-293.
- G Cheung, P Zalzal, M Bhandari, JK Spelt, M Papini (2004) Finite element analysis of a femoral retrograde intramedullary nail subject to gait loading. Journal of Med Eng Phys 26(2): 93-108.
- B Van Rietbergen, H Weinans, R Huiskes, A Odgaard (1995) A new method to determine trabecular bone elastic properties and loading using micromechanical finite-element models. Journal Biomech 28(1): 69-81.
- Damien P Byrne, Kevin J Mulhall, Joseph F Baker (2010) Anatomy & Biomechanics of the Hip. The Open Sports Medicine Journal 4: 51-57.
- Bessho, Ohnishi, Matsumoto, Ohashi, Matsuyama, et al. (2009) Prediction of proximal femur strength using a CT-based nonlinear finite element method: Differences in predicted fracture load and site with changing load and boundary conditions. Bone 45(2): 226-231.
