 Research Article
Abstract
Background: Cystic fibrosis is a multi-organ disease, inherited in an autosomal recessive manner, requires systematic imaging tests. The most commonly used diagnostic method due to the low cost and low radiation dose is classic X-ray imaging. For patients with cystic fibrosis, they are performed as part of the annual review, as well as in rapid diagnostics when complications are suspected. In this paper, we describe the use of machine learning in medicine to make a diagnosis with a small number of X-ray images.
Methods: Our dataset contains 53 X-ray images of CF patients and 371 healthy patients. We use the Convolutional Neural Network (CNN) to classify X-ray images into two categories: CF patient / healthy one. The accuracy and loss function for training and validation were calculated as well as precision p, recall , specificity s, and Matthews correlation coefficient M_cc for prediction.
Keywords: Cystic fibrosis, X-ray images, machine learning, convolutional neural networks, classification After training CNN, we get accuracy and loss function L=0.6 for training and accuracy of validation and loss function of validation. For predictions we calculated precision, recall r=1 and specificity s=0.63. We also calculated the Matthews correlation coefficient M_cc=0.46 especially, for testing the accuracy of predictions of deep neural networks.
Conclusion: We have presented a method for classifying X-ray images of CF patients. The method can be used to automate screening, but much more data is needed for training to obtain reliable results. Future research will aim to increase network accuracy as well as training CNN to classify the correlation severity of CF.
Keywords: Cystic Fibrosis; X-Ray Images; Machine Learning; Convolutional Neural Networks; Classification
Abbreviations: CT: Computed Tomography; MRI: Magnetic Resonance Imaging; CF: Cystic Fibrosis; ML: Machine Learning; CNN: Convolutional Neural Networks; ANN: Artificial Neural Networks; TPU: Tensor Processing Units; AP: Anterior-Posterior; PA: Posterior- Anterior
Medical Introduction
Discovery of X-rays by W.K. Roentgen on November 8, 1895, and the possibility of using them for imaging of the human body was a real revolution in medicine at that time. In the present time, together with the progress of electronics and the introduction of computer techniques, we have been observing the constant development of X-ray methods and techniques that have been digitized and the dose of radiation has been significantly reduced for about 30 years. There has also been a dynamic development of other methods of obtaining images of the human body, such as Ultrasound (USG), Computed Tomography (CT), Magnetic Resonance Imaging (MRI) [1,2]. Cystic Fibrosis (CF) is a hereditary, multi-organ, genetically determined disease characterized by clinically chronic bronchial obstructive changes and respiratory tract infections as well as digestive disorders and their consequences.
The gene responsible for its development lies on the long arm of chromosome 7. The protein being a product of this gene, the membrane Conductance Regulator (CFTR), may undergo numerous mutations that are responsible for the development of the disease. The frequency of illness calculated in the 80s of the 20th century, for the white race is 1:2500 of live births, in Poland 1:4394 [3]. The course of cystic fibrosis varies significantly between patients and cannot be predicted on the basis of the genotype, the treatment must be adjusted individually, hence it is necessary to frequently monitor changes in the respiratory system, including imaging studies. Imaging diagnostics in cystic fibrosis primarily concerns the organs of the chest and abdomen, collateral nasal sinuses and the spine. Imaging mainly uses methods using ionizing radiation (X-ray, CT), but also other methods, such as USG or MR not using ionizing radiation. Radiological tests are based on the measurement of the attenuation of the ray beam after passing through the human body [1]. The X-ray image is a widely available method with a very low radiation dose and low cost. It allows to detect the macroscopic changes and gives insight into the physiology of the respiratory system [4].
Despite the low sensitivity in detecting early progression, it is still used by most centers, also in Poland, for regular monitoring of disease progression. It is usually performed as part of the annual medical check of patients with cystic fibrosis - during the period without infection. It is also used for quick diagnostics in the presence of suspected complications, monitoring of pleural drainage treatment, it is also recommended after chest procedures (e.g. establishing a vascular port). Although X-ray examination requires virtually no preparation, the technique of performing it is important [5]. Most often, an X-ray image is taken only in the anteroposterior projection-AP (in newborns and infants) and posterior-anterior-PA (in older children and adults. If the AP/ PA projection is difficult to interpret, the radiologist will order additional projections, usually lateral. In older children and adults, the picture is taken in a standing position, with the breath held at the top of the inspiratory phase, because then the assessment of the lungs and heart is most adequate, and in newborns and infants lying down. The main radiological symptoms are increased lung transparency, tightening of the pulmonary parenchyma, atelectasis, air bronchogram, silhouette symptom, and pleural fluid [6]. Peripheral pulmonary distension is the abnormality that is seen first in X-rays. The interpretation of the X-ray image includes familiarization with clinical referral data, assessment of the image in terms of technical correctness, assessment of pulmonary fields, identification of lesions, assessment of the mediastinum including heart and large vessels, assessment of the diaphragm and assessment of the chest wall. The study description and conclusions are formulated on the basis of clinical data and radiological images. The X-ray examination creates interpretation problems because there is a lack of standardization and validation in the assessment of an X-ray image (it is often subjective and depends on the experience of radiologists) [6-8].
Over the years, X-ray devices have undergone quite an evolution: the patient’s exposure time has been significantly shortened, better methods of filtering and collimating the X-ray beam have been introduced, and the radiation dose has been significantly reduced, replacing the analog methods with digital ones, which give more possibilities not only for X-ray image processing but also for its archiving and distance consulting, not to mention the economic aspect. Currently used systems also give the opportunity to simultaneously take X-ray images using different values of lamp voltage and current. Radiographs made in this way provide more diagnostic information, and the radiation dose received by the patient is similar to the dose of a single image [7]. The importance of some diagnostic methods has now been reevaluated, while modern technologies are increasingly being used to help in the correct interpretation of test results. An important opportunity for medicine could be the use of artificial neural networks, acting similarly to synapses in the human brain. The purpose of this article was to investigate whether artificial neural networks can be used as an effective tool for diagnosing cystic fibrosis based on X-rays images and predicting patient prognosis, as well as whether they will reduce the frequency of taking X-rays.
Methods
Machine learning and image analysis - Convolutional Neural Networks (CNN)
Machine Learning (ML) is a science dealing with algorithms and statistical models that allow computer systems to perform certain tasks without giving exact instructions - they only use emerging patterns and dependencies. They are used in those areas for which the creation of a working and correct algorithm solving a given problem is very difficult, and sometimes even impossible. Artificial Neural Networks (ANN) are one type of machine learning algorithms [9]. These are systems of elements (nodes) loosely inspired by biological neural networks. They work like synapses in the human brain - training data causes signals to be sent along a network - according to the appropriate mathematical function (usually non-linear) assigned to each of the neurons. ANN requires a large amount of “training” data to calculate the weights of nodes of the network [10]. From several to thousands of neurons can make up a single layer, each of which can serve different purposes and perform different operations on the input data. The basic algorithm that teaches neural networks is the backpropagation algorithm, which involves finding the weights of individual neurons moving from the final (output) layer through subsequent hidden layers to the input layer.
Image Analysis and Neural Networks
The main problem during the analysis and classification of images using neural networks is the fact that images are usually objects of large size (for an example image of size 224x224 pixels and 3 color channels can be stored using 224x224x3 = 150528 numbers). The result is that even a small picture requires a very large neural network - in this case, over 150 000 neurons in the input layer. It turns out that biology also encountered such a limitation and solved this problem. In 1950-1960, Hubel and Wiesel showed that the visual cortex of cats and monkeys contains neurons that individually respond to small fragments of the field of view. This area is called the receptive field. Adjacent neurons have similar and overlapping receptive fields. All neurons in the visual cortex together form a map of the entire visual space, which is observed by an animal [11].
Hubel and Wiesel also noticed that they are dealing with two types of neurons:
a) Simple cells whose output is maximized by detecting edges in a specific orientation to the receptive field
b) Complex cells - having a larger receptive field whose output is independent of the edge position in the receptive field.
The practical use of this discovery came much later in the form of Convolutional Neural Networks (CNN)[12].
The CNN is made up of many hidden layers, but the groups of neurons in some layers do not connect with each other (as in typical dense layers), but only a small number of input neurons creates a receptive field that connects to one or several hidden layer neurons.
Used Software
In the process of classification of RTG images, the opensource programming libraries were used to support the design, learning, and testing of convolutional neural networks. Due to the fact that Python has been chosen as the programming language for research, we can use the Keras programming library [13] which allows for even greater abstraction and generalization of specific tasks related to CNN. The Keras library allows to quickly define a neural network, usually layer by layer, in a very simple and fast way (definition of a single layer takes only one line of code). Similarly, performing operations such as model build, neural network training, testing, or generating predictions based on a trained model are usually just a matter of a few commands. This library also provides loading and preprocessing images. This library can use Tensor Flow [14] as a backend engine or other low-level libraries (for example Theano or CNTK). In our research, we use TensorFlow, which provides computations on CPU, GPU as well as Tensor Processing Units (TPU) provided by Google. In addition, the cu DNN library [15] was used in our calculations to run the model training using the graphic accelerator and HDF5 to save the model on the hard disk for future reuse.
Data used during Training of CNN
The data used in training and testing the neural network are chest X-ray images of patients with cystic fibrosis (PA item) from the archives of Clinical Radiology and Imaging Diagnostics Department of the Provincial Hospital No. 2 in Rzeszów. X-rays were taken with a camera Precision XR/i (General Electric Medical Systems). They have undergone preliminary preprocessing - they have been resized and cropped to 512x512 pixel images. Then, using the Keras library, the 24-bit color of the images were scaled to the value range (0, 1), and the size of the images was rescaled - due to the neural network requirements - to 224x224 pixels. The training set included 53 X-ray images of CF patients and 371 X-ray images of other people - a total of 424 samples. The test set included 11 X-ray images of CF patients and 10 X-ray images of other people - a total of 21 samples.
The main problem is the difficulty in obtaining a sufficient number of X-ray images of patients with cystic fibrosis - the proper training of each neural network requires a large number of data samples, in this case, there are really few. This is a very common problem when it comes to medical data that can be solved using two possible approaches: data augmentation and/or so-called knowledge transfer from a neural network previously trained on a large data set. In our case, we use data augmentation to at least slightly compensate for excessive network overfitting caused by a small number of samples. This technique involves subjecting individual photos to transformations (rotation by a given, random angle; random vertical and/or horizontal shift, image tilt, scaling, horizontal reflection and filling of empty pixels).
Structure of the Neural Network
The individual blocks in the CNN diagram represent layers of neural networks. Blocks marked in red are a set of blocks typical for CNN, consisting of a Convolution layer, an Activation layer (the ReLU function) and a Pooling layer that reduces the size of a given set of layers. Three blocks of layers using the convolution function allow reducing the dimensions of the examined image from 224x224 pixels to 26x26 pixels. At the same time, the number of distinguished features increases from 3 (corresponding to the color channels of the image) increases to 64. The Flatten layer causes the 3D tensor to “flatten” to the 1D vector, the next layers are 2 Dense layers, the Activation layer and the Dropout layer placed between them, which reduces the likelihood of overfitting.
The Network has been Trained for 50 Epochs
The Loss function has been calculated - it is a measure of the discrepancy between the predicted value for the input data and the actual value. Unlike Accuracy, this is not a percentage, but the sum of errors for each entry in a training or test set. For neural networks, the loss function usually behaves like a negative logarithm function. Thus, the main goal in model learning is to minimize the loss function through various optimization methods. Ideally, we should get a result equal zero - the smaller the value of this function, the better and more accurate model. In the case of the Keras library, the loss function works within a single set of training data and considers, for example, the action of the Dropout layer, which adds additional “noise” to the data. After 50 epochs, we received the value of loss function equal to 0.6, which in this case is not very satisfactory. The second important parameter is Accuracy - the higher the value (optimally 1), the more accurate is the model and it performs better during calculations - it gives more accurate results. After 50 epochs, accuracy was equal to 0.72. Accuracy also considers the Dropout layer. Val_loss is a loss function but applied to a validation set created by the library automatically from some training data. In addition, the Dropout layer is not used in this case. Val_loss has fallen to 0.37. Val_acc is accuracy calculated from data in the validation set - it reached the value of 1.00 but in the last few steps, it oscillated at 0.74.
Results
During the test of the trained neural network on a test set consisting of 11 X-ray images of people with CF, unfortunately, 6 of these pictures were classified as pictures of healthy people. During the test of the trained neural network on a test set of 10 X-ray images of healthy people, all of these images were classified as healthy people. It should be remembered that the neural network always classifies a picture with a certain probability - if the probability of classifying a picture as a picture of a sick person is only slightly lower than the probability of classifying a picture as a picture of a healthy person, we will receive information on the output that it is a picture of a healthy person. The accuracy of a given neural network can be illustrated in Table 1 (the so-called confusion matrix. We also calculated predictions for the test set for healthy and CF patients. As one can see from the above images and the number of incorrectly classified cases of CF patients, the neural network trained on the selected data set doesn’t deal very well with the correct classification of X-ray images of CF patients but doesn’t make mistakes when it comes to classifying healthy people.
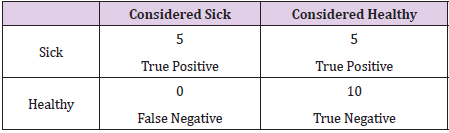
Table 1: Confusion matrix of CNN predictions.
After the calculation of the loss function and the accuracy for the test set, we can observe that the loss function in the test increased in relation to the one calculated during the training (L_ test=0.7415), which means that most likely the model is overfitted - what was expected due to the small amount of data. The accuracy in the test is A_test=68.75. An overfitted model handles training data very well, but it is not flexible enough to properly analyze a test data set. It is probably related to the basic problem when it comes to the use of neural network algorithms - the lack of sufficient training data and a certain “imbalance” in the number of X-rays of sick and healthy people. We also calculated some coefficients describing the accuracy of predictions of CNN (Table 2). Precision (also known as Positive Predictive Value) p=0.45 describes the performance of a test. A high result can be interpreted as indicating the accuracy of CNN. Recall r=1 measures the proportion of actual positives that are correctly identified as such (e.g., the percentage of sick people who are correctly identified as having the condition). The specificity s=0.63 measures the proportion of actual negatives that are correctly identified as such (e.g., the percentage of healthy people who are correctly identified as not having the condition). Matthews correlation coefficient is used in machine learning to measure the quality of binary classification. M_cc is better than F1- score or accuracy in case of binary problems, because it considers the balance ratios of the four confusion matrix categories [16]. M_cc changes from -1 (worst) to +1 (best value) and consider sizes of all four classes of the confusion matrix.
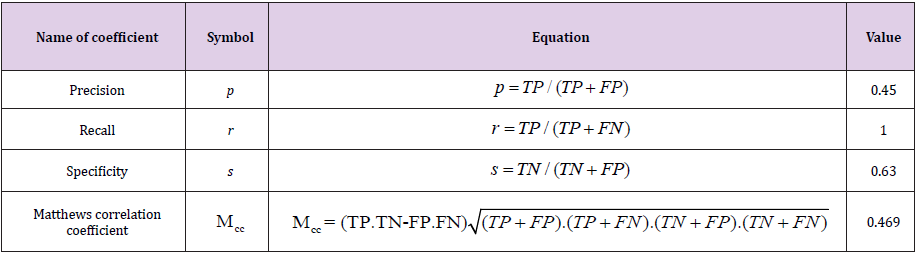
Table 2: Calculated coefficients.
where TP – number of true positives, TN – number of true negatives, FP – number of false positives, FN – number of false negatives.
Discussion
Chest X-ray images are the basic method used on a large scale to assess and monitor pulmonary changes in cystic fibrosis known and used for over 120 years. Cystic Fibrosis (CF) is a hereditary, multiorgan, genetically determined disease, characterized by clinically chronic bronchial obstructive changes and respiratory tract infections, as well as digestive processes and their consequences. Due to the individual course of the disease in each patient, CF requires systematic imaging tests. X-rays are one of the methods of imaging lung lesions in CF patients. Cystic Fibrosis Foundation recommends taking radiographs annually in all CF patients [1,4,17- 19]. Radiography is a simple, inexpensive, widely available study with a relatively low dose of radiation. X-ray images are currently used both for imaging exacerbations of cystic fibrosis and in annual scheduled patient reviews.
Standard Anterior-Posterior (AP) and Posterior-Anterior (PA) images allow detection of atelectasis, pneumothorax, consolidation or pneumonia. Despite the many advantages of X-ray examination, it creates interpretation problems because there is a lack of standardization and validation in the assessment of an X-ray image, which is often subjective and depends on the experience of radiologists [4-8]. The assessment of pictures of patients with CF is a particular challenge because radiological changes in the lungs are varied and their severity depends on the patient’s age and the frequency and intensity of respiratory infections. The Brasfield scale is most commonly used to assess the development of radiological changes in the lungs of CF patients. Characteristics in cystic fibrosis are peripheral emphysema and polymorphism of changes (simultaneous occurrence of changes of different types and severity) [20]. Despite the more sensitive methods of imaging the changes in the chest (high resolution computed tomography), X-ray images are still recommended for the diagnosis of lesions.
The use of ML in the diagnosis of Cystic Fibrosis, in particular, CNN in the analysis and classification of X-ray images of CF patients gives enormous possibilities when it comes to a quick and accurate diagnosis. CNN is able to detect details that only an experienced expert will be able to find [21]. Our research shows that CNN is an excellent tool in the classification of X-ray images, even despite the fact that the amount of data used during the training of the neural network was very limited. A larger amount of data (mainly greater number of X-ray images of CF patients) and the use of data augmentation, knowledge transfer method and using other structures of the neural network will allow in the future to significantly increase the accuracy of neural network predictions and thus also the usefulness of this tool in medical diagnostics. What’s more, while the training of the neural network takes a long time, even with the use of tools such as specialized Tensor Processors (TPU) or Graphics Card Processors (GPU), the analysis of X-ray images using such a trained network takes a very short time, so CNN is also a very efficient tool. Future research. Undoubtedly, the main problem associated with the use of an artificial neural network to analyze X-ray images in the detection of cystic fibrosis is the small number of X-rays of patients.
One of solutions is to find more data - obtaining a large number of X-ray images of patients with cystic fibrosis, which, however, can be a very difficult task due to the limited access to medical data and legal issues. Another possibility to solve the problem of the correct operation of the neural network can be a change in its structure e.g. adding layers or changing the activation function. Another possible solution is to use an already trained neural network (e.g. Google Net), which detects completely different types of objects, but it is possible to re-train several initial layers of such a network using training set of X-ray images, which will cause the network to classify this data with much greater accuracy than the network trained only with this training set of our X-ray images [22,23].
Disclosures
The authors declare that there is no conflict of interest regarding the publication of this research. This research did not receive any specific grant from funding agencies in the public, commercial, or not-for-profit sector. All data relevant to the study are included in the article or uploaded as supplementary information.
References
- Kołodziej M, J de Veer M, Cholewa M (2017) Lung function imaging methods in Cystic Fibrosis pulmonary disease. Respir Res 18: 96.
- Ward R, Carroll WD, Cunningham P (2017) Radiation dose from common radiological investigations and cumulative exposure in children with cystic fibrosis: an observational study from a single UK centre. BMJ Open 7(8): e017548.
- Sands D, Pogorzelski A, Skoczylas Ligocka A (2018) Epidemiologia i organizacja opieki medycznej nad chorymi na mukowiscydozę w Polsce. In: Sands D (Ed.), Mukowiscydoza choroba wieloukł Termedia Poznań p: 15-24.
- Sonnapa S, Owens CM (2016) Clinical and radiological aspects of imaging the lungs. In Bush A, Bilton D, Hodson M Hodson (Eds.), Geddes Cystic Fibrosis. CRC Press 2016: 447-458.
- Daines C, Morgan W (2011) The Importance of Imaging in Cystic Fibrosis. Am J Respir Crit Care Med 184(7): 751-752.
- Jaworska J, Uliasz M (2018) Rola badań obrazowych w diagnostyce i monitorowaniu mukowiscydozy. In Sands D (Eds.), Mukowiscydoza choroba wieloukładowa. Termedia. Poznań 2018: 91-122.
- Brzewski M, Komarnicka J, Popielarz M (2018) Diagnostyka obrazowa chorób układu oddechowego. In Kulus M, Krenke K (Eds.), Pulmunologia dziecięca. PZWL Warszawa 2018: 80-112.
- Przelaskowski A (2010) Computer-aided diagnosis based on medical imaging–challenges and development perspectives. Acta Bio-Optica et Informatica Medica 16: 245-253.
- Engelbrecht AP (2007) Computational Intelligence: An Introduction. In Engelbrecht AP(Eds.), (2nd ), John Wiley & Sons pp. 15-41.
- Singh R, Kalra MK, Nitiwarangkul C (2018) Deep learning in chest radiography: Detection of findings and presence of change. PLOS ONE. 13(10): e0204155.
- Hubel D (1995) Eye, Brain and Vision. (2nd edition). Henry Holt and Company.
- Sewak M, Karim Md, Pujari P (2018) Practical Convolutional Neural Networks, Packt Publishing Ltd, 30-45.
- Chollet F (2017) Deep Learning with Python. Manning Publications p. 3-24.
- Zaccone G, Md Karim R, Menshawy A (2017) Deep Learning with TensorFlow. Packt Publishing Ltd. 2017: 15-17.
- Tuomanen (2018) B Hands-On GPU Programming with Python and CUDA: Explore high-performance parallel computing with CUDA. Packt Publishing. 269-270.
- Géron A (2019) Hands-On Machine Learning with Scikit-Learn, Keras, and TensorFlow: Concepts, Tools, and Techniques to Build Intelligent Systems. O'Reilly Media. 280-325.
- Kerem E, Conway S, Elborn S (2005) Standards of care for patients with cystic fibrosis: A European consensus. J. Cyst. Fibros 4(1): 7-26.
- Murphy KD, Maher MM, O Connor OJ (2016) Imaging of Cystic Fibrosis and Pediatric Bronchiectasis. AJR Am J Roentgenol. 206(3): 448-454.
- Smyth AR, Bell SC, Bojcin S (2014) European Cystic Fibrosis Society Standards of Care: Best Practise Guidelines. J Cyst Fibros 13(1): S23-S42.
- Mazurczak T (2006) editor. Mukowiscydoza. Dziedziczenie, etiopatogeneza, diagnostyka, leczenie. Warszawa 8: 26-35.
- Jarpurkar P, Irvin J, Zhu K (2017) CheXNet: Radiologist-Level Pneumonia Detection on Chest X-Rays with Deep Learning.
- Tajbakhsh N, Shin JY, Gurudu SR (2016) Convolutional Neural Networks for Medical Image Analysis: Full Training or Fine Tuning? IEEE Transactions on Medical Imaging. 35(5):1299-1312.
- Chicco D (2017) Ten quick tips for machine learning in computational biology. BioData Mining 10: 35.
