 Research Article
Abstract
Background: Tacrolimus (TAC) is important immunosuppressant given for graft survival after renal transplant. Recent studies have proposed TAC metabolism rate (blood concentration normalized by TAC daily dose or C/D) may affect kidney outcome.
Methods: A retrospective study was performed to determine whether TAC metabolism rate affects the renal function among Hispanic renal recipients. Of the 303 kidney allograft recipients, 165 patients were included in the study. Study population were divided into fast (C/D ratio <1.54) and slow (C/D ratio ≥1.55) metabolizer group. The renal function was evaluated by creatinine clearance (CrCl) using Cockcroft-Gault nomogram.
Results: Slow metabolizers showed that TAC doses were significantly lower than fast metabolizers through the one-year follow-up period (p<0.05). The mean TAC trough levels of slow metabolizers were significantly higher than those of faster metabolizers at 1month and 6 months (1 month: 7.0 ± 2.3 vs. 6.0 ± 2.0 ng/mL, p=0.003; 6 months: 6.7 ± 2.4 vs 5.9 ± 1.8 ng/mL, p=0.012) Compared with fast metabolizers, slow metabolizers showed significantly lower CrCl at discharge (ml/min) (28.0 ± 21.6 vs. 35.6 ± 25.6, p=0.04), 1 month (52.0 ± 16.6 vs. 61.4±22.4, p=0.03), 3 months (58.3±18.7 vs. 64.9±18.1, p=0.025) and 12 months(61.7±23.5 vs. 68.9±21.0, p=0.045) after transplantation.
Conclusion: This study demonstrated that TAC slow metabolizers exhibit significantly poor kidney function compared to fast metabolizers in Hispanic patients. We may predict the renal outcome following renal transplantation with using C/D ratio.
Keywords: Tacrolimus concentration-to-dose ratio (C/D ratio); Renal Function; Kidney Transplantation
Abbreviations:ABCB1: ATP-Binding Cassette Subfamily B member1; BMI: Body Mass Index BMIC/D Ratio: Concentration- To-Dose Ratio; CrCl: Creatinine Clearance; CNI: Calcineurin Inhibitor; CYP: Cytochrome P450; GFR: Glomerular Filtration Rate; TAC: Tacrolimus; TDM: Therapeutic Drug Monitoring
Introduction
Tacrolimus (TAC), a Calcineurin Inhibitor (CNI), is the immunosuppressive drug of choice after renal transplantation because it has reduced acute rejection and improved renal function and graft survival [1,2]. However, many factors make management of tacrolimus complicated: its narrow therapeutic index, the large inter and intra individual variations in its pharmacokinetics characteristics, pharmaceutical interactions and polymorphisms in genes encoding TAC metabolizing enzymes [3,4]. A narrow therapeutic window and proven association between drug concentration and effect requires to perform Therapeutic Drug Monitoring (TDM) of tacrolimus routinely [5]. Subtherapeutic level increases the risk of acute rejection and development of de novo donor specific antibodies (dnDSA) [6] whereas supratherapeutic level increases the risk of adverse effects such as nephrotoxicity, neurotoxicity, infection, diabetes and malignancies. Therefore, it is necessary to keep a balance between efficacy and toxicity of the tacrolimus [7,8].
However, although blood levels fall within the therapeutic range, the actual efficacy or adverse effect may be different due to variability of interindividual susceptibility in drug response [9]. The determinants for variability between individual recipients and susceptibility to CNI nephrotoxicity comprises multiple clinical factors, such as kidney age, gender, body mass index, albumin, corticosteroids, food component, comedication, hepatitis, diabetes, function of cytochrome P450(CYP)3A5, CYP3A4, and p-glycoprotein [1,5,10-20]. For this reason, intra-patient variability makes no consensus on the appropriate interpretation of tacrolimus trough level monitoring [8]. Additionally, efficacy and side effects are determined by unbound concentrations, whereas TDM uses whole blood concentrations poorly related to the area under the concentration-time curve, so there might be a limit to predicting the effect exactly [3-13]. Nankivell et al suggested local exposure of tacrolimus could be more than essential than systemic exposure in regarding nephrotoxicity [14]. Furthermore, relying on TDM data takes 1 month for recipients to achieve stable therapeutic tacrolimus dosing [9].
Therefore, ultimately, we need the personalizing CNI therapy based on understanding the factors that determine drug disposition in individual patients [3]. Also, it is clear reliable predictive marker is necessary to estimate efficacy and side effect of tacrolimus to protect graft for tacrolimus-treated kidney recipient. From this, it has been investigated about tool to optimize the individual doses of tacrolimus to achieve therapeutic targets and parameter for categorize high-risk patients identified by high metabolite rate to develop tacrolimus side effects [15]. The previous several studies have been explored the C/D ratio (TAC trough concentration/daily TAC dose) which define tacrolimus metabolization as a potential predictor of nephrotoxicity and acute rejection, or even higher mortality independently for tacrolimus-treated patients after transplantation [15-18]. Even though ethnicity is one of the factor for interindividual variability of drug metabolism and response [19]. there have been no studies based on specific ethnic variability about tacrolimus metabolization rate influencing clinical outcome.
Objective
We aim to determine whether the rate of the metabolism of TAC affects the renal function after renal transplantation and evaluate whether the C/D ratio can be reliable clinical predictor to estimate risk on allograft loss after kidney transplantation among Hispanic patients.
Materials and Methods
Study Subjects
We analyzed retrospectively data from 303 Hispanic patients who underwent renal transplant from January 1, 2013 to December 31, 2017 at the St. Vincent Medical Center (USA). All patient data was de-identified and anonymized prior to analysis. This study was approved by the Institutional Review Board for Human Subjects of St. Vincent Medical Center. Kidney recipients who use TAC as a part of immunosuppressants had been included for over one year. Exclusion criteria were: Patients who received an extra-renal organ (i.e., pancreas); The patients’ kidney function who did not last more than 3 months; Patients lost to follow up. The following parameters were examined: recipient’s age, height, weight, Body Mass Index (BMI), gender, cause of End-Stage of Renal Disease (ESRD), donor type, blood pressure, daily TAC dose and trough levels of TAC (at 1, 3, 6, 9 and 12 month), creatinine clearance (at discharge and at 1,3, 6, 9 and 12 month). BMI was calculated by dividing the body weight to the square of the height. Glomerular Filtration Rate (GFR) was estimated from creatinine clearance values with the use of the Cockcroft–Gault formula.
Tacrolimus Metabolism Rate
Once all data was collected, tacrolimus metabolism rates were calculated by dividing the TAC trough Concentration (C) by the corresponding daily TAC dose (D), as published using the following formula [16]. C/D ratio (ng/mL x 1/mg) = blood TAC trough level (ng/mL)/daily TAC dose (mg) TAC metabolism rate was determined at discharge time and at month 1, 3, 6, 9 and 12 after renal transplantation. The mean C/D ratio of the six periods used for patient categorization. We decided the C/D ratio thresholds based its mean value (1.93 ng/mL x 1/mg) because it showed symmetric distribution. Since the mean value of the C/D ratio in this study was higher than the mean value (1.29ng/mLx1/mg) shown in the previous study, we decided that the C/D ratio (between 1.05 and 1.55), which previously defined the intermediate group, was also included as the fast metabolizer group. We used cut-off C/D ratio of 1.55 ng/mL x 1/mg, so patient with a TAC C/D ratio ≤1.55ng/mL x 1/mg were defined as fast metabolizer and TAC C/D ratio >1.55 ng/ mL x 1/mg were categorized as slow metabolizer.
Statistical analyses
The demographic and clinical characteristics of the patients are presented as mean, Standard Deviation (SD), and percentage. The Chi-squared test for categorial variables and the independent ttest for continuous variables were used to compare the 2 different TAC metabolism groups. P value < 0.05 was considered statistically significant. Statistical analysis was performed using IBM SPSS Statistical Analysis Software Program version 24 (Armonk, NY: IBM Corp.).
Results
Study patients
A total of 303 self-reported Hispanic patients who had renal transplantation were recruited into this study. From these patients, 165 kidney allograft recipients were fulfilled our study inclusion criteria and they were categorized in two groups with different TAC metabolism rates. Ninety-two recipients (55.8 %) were classified as slow metabolizers and 73 recipients (44.2%) were categorized as fast metabolizers.
Study patients’ demographic and clinical characteristics
shown in Table 1. The recipient’s height showed a statistically correlation with the metabolism rate. Fast metabolizers were taller than slow metabolizers (p<0.001). Except for height, there were no significant differences in demographic features and clinical characteristics between metabolizer groups (Table 1). The mean (± SD) age for slow metabolizers and fast metabolizers was 54.9 ± 9.9 years and 52.7 ± 12.0 years. Fifty-five (59.8%) of slow metabolizers and 52 (71.2%) of fast metabolizers were male. Majority of donor type of slow and fast metabolizers was the decreased donor (94.6% vs 91.8%). The proportion of patients diagnosed with diabetes as cause of ESRD was 54.3% and 42.5% in slow and fast metabolizers, respectively.
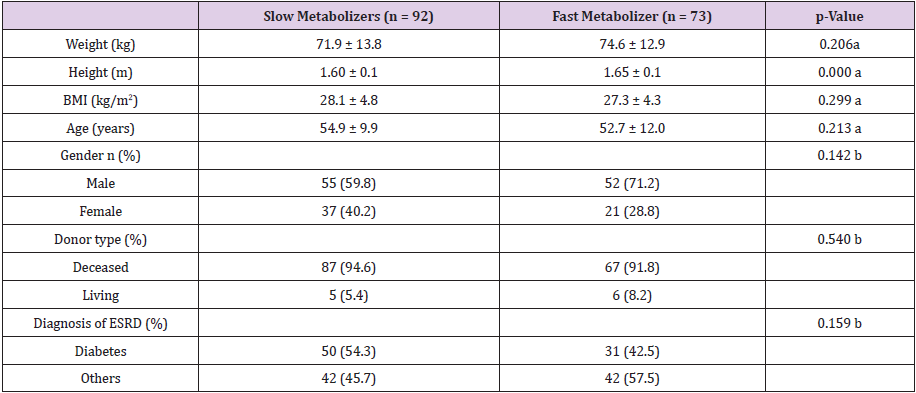
Table 1: Patients characteristics.
Tacrolimus Daily Dose, Trough Level and Metabolism Rate
At 1, 3, 6, 9, and 12 months, the mean daily dose for TAC was significantly higher in fast metabolizers than slow metabolizers (Table 2). Fast metabolizers required more than twice of the TAC maintenance dose compared to slow metabolizers for entire followup period. The mean TAC trough levels of slow metabolizers were significantly higher than those of faster metabolizers at 1 month and 6 months after renal transplantation (1month: 7.0 ± 2.3 vs 6.0 ± 2.0 ng/mL, p = 0.003; 6 months: 6.7 ± 2.4 vs 5.9 ± 1.8 ng/mL, p = 0.012). At all points, there were no differences of blood pressures between two groups (Table 2). As shown in Figure 1, the C/D ratio had symmetric distribution. The mean C/D ration values was 1.93 ± 1.068 ng/mL x 1/mg (range 0.35 to 5.74).
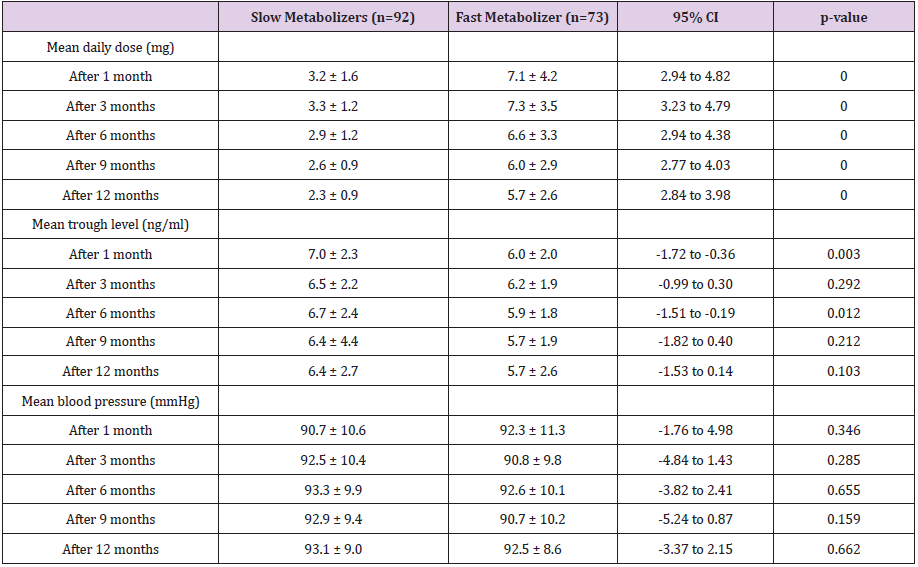
Table 2: Medication dose, blood trough concentration and mean blood pressure at points.
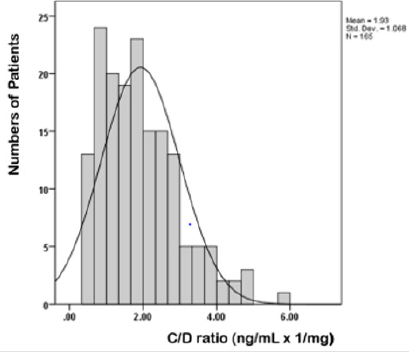
Figure 1:
Renal Function
Renal function is evaluated with creatinine clearance using Cockcroft–Gault formula. Table 3 presents CrCl between slow and fast metabolism at discharge and 1, 3, 6, 9 and 12 months after renal transplantation. The delta CrCl were the difference between at 1month and each point 3, 6, 9 and 12 months after transplantation. In the one-year follow-up period, the CrCl values of two groups showed increasing trend. At discharge point and 1, 3 and 12 months after transplantation there were significant differences of CrCl values between slow and fast metabolizers (at discharge: 28.0 ± 21.6 vs 35.6 ± 25.6, p = 0.042; 1 month: 52.0 ± 16.6 vs 61.4 ± 22.4, p=0.003; 3 months: 58.3 ± 18.7 vs 64.9 ± 18.1, p = 0.025; 12 months: 61.7±23.5 vs. 68.9±21.0, p=0.045). Compared with fast metabolizers, slow metabolizers showed significantly lower CrCl at those point. The delta CrCl was defined as differences between one month and each point month by subtracting the former from the latter. Between the metabolism groups there were no significant difference of delta CrCl at all points (Table 3). At one month after renal transplantation slow metabolizers showed a significant decreased CrCl compared to fast metabolizers (Figure 2) The univariate change of the CrCl in the one-year follow-up period was illustrated in (Figure 3).
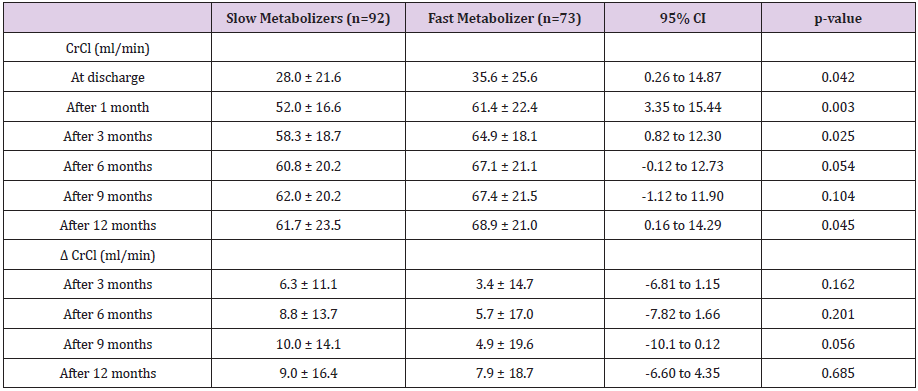
Table 3: CrCl value and Δ CrCl between the metabolism groups.
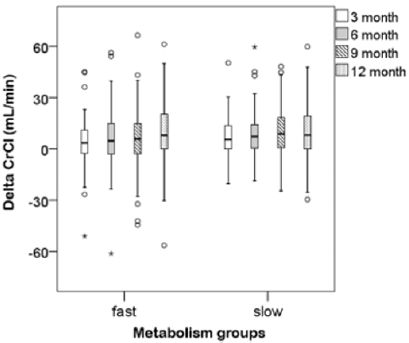
Figure 2:
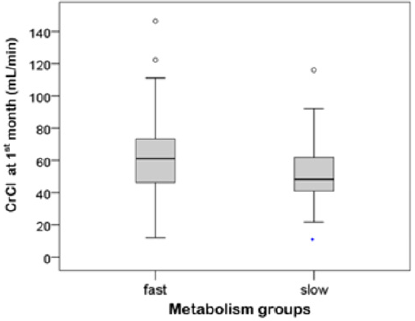
Figure 3:
Discussion
Our study evaluated how much the rate of the metabolism of TAC affects the renal function after renal transplantation and investigated whether the C/D ratio can be reliable clinical predictor to estimate risk on allograft loss after kidney transplantation among Hispanic patients. There are many factors affecting the bioavailability and metabolism of tacrolimus including polymorphism of intestinal p-glycoprotein, CYP3A4/5, age, ethnicity, medication, food, intestinal pathology, concomitant disease, such as liver and kidney diseases, hypoalbuminemia, and anemia [7,20]. The combined use of steroids and tacrolimus may change tacrolimus pharmacokinetics by enzymatic induction and/ or p-glycoprotein efflux transporter in the intestine and liver. The higher dose steroid can lead to reduce tacrolimus blood levels and require higher tacrolimus dose to achieve therapeutic level of immunosuppressive effect [2,18]. Although controversial, Single Nucleotide Polymorphisms (SNPs) in genes coding CYP 3A4/5 and p-glycoprotein efflux transporter (ABCB1: ATP-binding cassette subfamily B member1) can affect tacrolimus metabolizing rate in kidney recipients [4,9,21-29].
It is demonstrated that specific alleles of CYP 3A4/5 and ABCB1 were associated with TAC rapid metabolization and contributed a lower estimated glomerular filtration rate [22]. The expressor patients with CYP3A5*1/*1 or *1/*3 genotype require the higher tacrolimus dose to get target level due to the high level of metabolism in intestine and hepatic line, while the non-expressor patients with CYP3A5*3/*3 need lower dose due to slow metabolism rate [7,23,24]. In other words, fast metabolizers, characterized by a high tacrolimus requirement to reach the target trough level, has shown the small C/D ratio and presented CYP 3A5 *1/*1 expressor, while slow metabolizers need small dose to achieve targeted concentration, characterized as CYP 3A5 *3/*3 nonexpresser recipients exhibiting the large C/D ratio [4,18,20,21,25]. According to one report, which has shown ethnic variability in the frequencies of polymorphism in gene encoding for drug metabolizing enzyme, Hispanic population in the US has the largest frequency in CYP3A5*3 (0.245–0.867) and a higher prevalence of CYP2C9*3, CYP2C19*4, and UGT2B7 IVS1+985 A>G compared to that in non-Hispanics [26]. More than 80% of Caucasians are non-expressors i.e. the CYP3A5*3 [7]. In our study, patients who were categorized as slow metabolizers (55.8 %) were more than fast metabolizer (44.2%). The mean C/D ratio values also higher than that of previous study (1.93 mg/mL x 1/mg vs, 1.29ng/mL x 1/mg) [16]. This result reflected majority of Hispanics have CYP3A5*3 genotype and can be categorized the slow metabolizers with low dose of tacrolimus requirement and high C/D ratio in our study.
There have been several studies related to the relationship between TAC level and allograft outcome. It has been suggested that higher tacrolimus trough-level variability was related with inferior renal graft outcome [25].The mechanism of action by which CNI increases nephrotoxicity can be explained as follows: vasoconstriction of afferent and efferent glomerular arterioles, and reduction of renal blood flow and GFR by decreased formation of prostaglandin E2 and inhibiting COX-2 inhibition Nitric Oxide (NO) synthesis [27-29].Based on the evidence of nephrotoxicity correlated to the tacrolimus blood levels, some studies emphasized TAC minimizing protocols and presented that low exposure TAC have been shown to decrease premature allograft loss [11,29]. Studies on minimizing TAC exposure have shown a correlation between mean trough levels and graft survival [11,30,31]. For example. one largest randomized clinical trial with 1645 renal recipients showed that reduced exposure to tacrolimus based regimen (trough levels 3–7ng/ml) provided better estimated GFR and allograft survival [11] whereas the usual therapeutic trough level is range from 5–20mg/L and for preventing toxicity the usual range is 5–15mg/L [13]. However, when low exposure to TAC is too much, it may contribute to de novo DSA formation so it should be tailored to the degree of risk the patient has for preventing TACassociated nephrotoxicity [32].
Although tacrolimus TDM is essential for targeting, there is the shortcoming of TDM that toxicity can occur even within the therapeutic range. Therefore, new approach about personalized use of tacrolimus considering intra-patient variability has been required. A new concept, C/D ratio, might be able to help identify patients at risk for TAC toxicity and can be used to individualize and optimize tacrolimus therapy contributing to improved graft outcomes. In several published studies, the C/D ratio can reflect tacrolimus metabolism rate and the fast metabolizer has been associated with relatively higher risk of impaired kidney functions [15,17,19,21,33]. Thölking et al and Jouve et al demonstrated that the fast metabolizer with the lower the C/D ratio exhibited significant lower eGFR, more prone to developing BK nephropathy and the worse graft outcome, even death-censored graft loss, than slow metabolizers [17,34]. Thoelking et al explained the possible reason why fast metabolizer showed the impaired renal function: fast metabolizers might have overexposure and toxicity in the first hours after TAC administration [16-33]. The following strategy can be suggested: after identifying individual risk of nephrotoxicity predictively with C/D ratio, TAC minimizing protocol should be applied to patients with low risk classified by C/D ratio. Recent studies have shown that higher C/D ratios lower the risk of graft loss, so TAC minimization is possible, while minimization is not recommended for patients with low C/D ratios [15-18].
However, there are influencing factors on C/D ratio such as CYP3A5 gene polymorphism, race, hepatic function, age, time after transplantation, hematocrit, and drug or food that induce/inhibit CYP 3A and/or ABCB1 activity [35]. As a result of this, it is necessary to evaluate whether the C/D ratio can be reliable clinical predictor to estimate risk on allograft loss. Gijsen et al found that younger age and CYP 3A5 expressor were correlated with higher TAC dose and lower tacrolimus concentrations for dose administrated, but there is no association between CYP 3A5 or ABCB1 genotypes and estimated GFR [24]. Kim et al. also failed to observe the association between CYP3A genotype and kidney function even a 5-year follow up period post renal transplantation [36]. It remains unclear that fast metabolizers express the CYP3A5*1 predominantly and influence renal function noticeably [23]. Additionally, Egeland et al said that the patients with the high clearance increased risk of biopsy-proven acute rejection (BPAR) significantly the first 90 days compared to the patients with the low clearance post renal transplantation [19].
They hypothesized a high estimated tacrolimus clearance (daily tacrolimus dose [mg]/trough concentration[mcg/L]) may result from a low oral bioavailability and might cause a low intra-lymphocyte tacrolimus level requiring a higher dosage [19]. However, their study didn’t consider CYP3A influence and the patients’ ethnicity [19]. These studies may help us to identify patient with increased risk of acute rejection in early phase or impaired renal function further by evaluating their TAC metabolism rate. In our study, 165 kidney recipients taking TAC for immunosuppressive therapy were included. We evaluated influence of an individual’s metabolism of tacrolimus about the renal function. In accordance with previous finding, we found that fast metabolizers had significantly higher doses of tacrolimus at all time points analyzed which correlates with the idea that fast metabolizers clear the drug faster and would require high doses to reach target troughs than slow metabolizers. However, our finding is contrary to previous studies which have suggested that fast metabolizer showed deteriorated renal function.
Compared with fast metabolizers, slow metabolizers showed significantly lower creatine clearance at discharge, 1 month, 3 months and 12 months in our study population. We found that a cut-off C/D ratio of 1.55ng/mL x 1/mg can identify patients with increased risk of reduced GFR following transplantation. This observation may suggest new possibility that slow metabolizers with C/D ratio above 1.55 should be categorized into high risk group developing impaired renal function in tacrolimus-treated Hispanic patients after transplantation. It is not clear why this observation is found only in Hispanic patients and our results do not determine the cause of impaired graft function in slow TAC metabolizers. But we can hypothesize that slow metabolizers do not clear the drug as efficiently as fast metabolizers, and this may lead to an increase exposure which may lead to nephrotoxicity or that this may result from ethnically associated differences in intestinal CYP3A or P-glycoprotein activity or both. Mancinelli et al compared the pharmacokinetics for the main tacrolimus metabolite across three ethnic groups, African American, white, and Latin American and proposed ethnically associated differences in intestinal CYP3A or p-glycoprotein activity [37].
Also, we observed slow metabolizers tend to be diabetic compared to fast metabolizers, although not statistically significant, may have contributed to be vulnerable to preserve renal function. Thus, it is unclear whether mechanisms adequately explain variations in renal function by metabolism rate in this study group. Further research is needed to determine precisely which factors contribute to worsening kidney function in slow metabolizers in Hispanic group. This study has some limitations. We conducted retrospective single center study and didn’t control some confounders including drug interactions, comorbid diseases and donor characteristics. However, we investigated one strategy to personalize immunosuppressant management with certain study population having specific genetic characteristics. To our knowledge, this is the first study of Hispanic population which examines associations between patients’ tacrolimus metabolism rate and clinical outcomes (renal function) after renal transplantation. We showed non consistent association between C/D ratio and graft function compared to previous studies. This new understanding would help to improve predictions of the impact of C/D ratio. Prospective, controlled and multicenter trials are needed to determine whether C/D ratio can be powerful predictor of the graft outcome.
Conclusion
Our finding shows that there are significant association between C/D ratio and estimated GFR in tacrolimus-treated Hispanic patients after transplantation. We suggest that slow metabolizers with C/D ratio above 1.55 should be categorized into high risk group developing deteriorated renal function after transplantation. We propose the use of C/D ratio as alternative methods for assessing tacrolimus exposure and we expect this method can be useful tool to personalize tacrolimus therapy and to ensure the safety of the patient by identifying those patients who are at increased risk of developing CNI nephrotoxicity.
Conflicts of Interest
All authors declare that they have no conflict of interest.
Acknowledgment
The authors acknowledge that this study is in part supported by Western University of Health Sciences. In addition, the authors deeply appreciate for the contributions from physicians, other health care providers and patients who participated in this study at the St. Vincent Medical Center.
Funding
This research did not receive any specific grant from funding agencies in the public, commercial, or not-for-profit sectors.
References
- (2009) Kidney Disease: Improving Global Outcomes (KDIGO) Transplant Work Group, KDIGO clinical practice guideline for the care of kidney transplant recipients, Am J Transplant 3: S1-155.
- Anglicheau D, Flamant M, Schlageter MH, Martinez F, Cassinat B (2003) Thervet, Pharmacokinetic interaction between corticosteroids and tacrolimus after renal transplantation, Nephrol. Dial. Transplant 18: 2409-2414.
- Vanhove T, Annaert P, Kuypers DRJ (2016) Clinical determinants of calcineurin inhibitor disposition: a mechanistic review. Drug Metab Rev 48: 88-112.
- Hu R, Barratt DT, Coller JK, Sallust BC, Somogyi AA (2018) CYP3A5*3 and ABCB1 61A>G Significantly Influence Dose-adjusted Trough Blood Tacrolimus Concentrations in the First Three Months Post-Kidney Transplantation, Basic Clin. Pharmacol. Toxicol 123: 320-326.
- Rančić N, Dragojević-Simić V, Vavić N, Kovačević A, Šegrt Z, et al. (2015) Tacrolimus oncentration/dose ratio as a therapeutic drug monitoring strategy: the influence of gender and comedication, Vojnosanit Pregl 72: 813-822.
- Gaynor JJ, Ciancio G, Guerra G, Sageshima J, Roth D, et al. (2016) Lower tacrolimus trough levels are associated with subsequently higher acute rejection risk during the first 12 months after kidney transplantation, Transpl Int 29: 216-226.
- Bentata Y (2019) Tacrolimus: 20 years of use in adult kidney transplantation. What we should know about its nephrotoxicity, Artif Organs.
- Davis S, Gralla J, Klem P, Stites E, Wiseman A (2019) Tacrolimus Intra-Patient Variability, Time in Therapeutic Range, and Risk of De Novo Donor-Specific Antibodies, Transplantation.
- Hendijani F, Azarpira N, Kaviani M (2018) Effect of CYP3A5*1 expression on tacrolimus required dose for transplant pediatrics: A systematic review and meta-analysis. Pediatr Transplant.
- Rodrigo E, Piñera C, De Cos MA, Sánchez B, Ruiz JC, et al. (2005) Evolution of tacrolimus blood levels and concentration-dose ratios in patients who develop new onset diabetes mellitus after kidney transplantation, Transplant International 18(10): 1152-1157.
- Ekberg H, Tedesco-Silva H, Demirbas A, Vítko S, Nashan B, et al. (2007) ELITE-Symphony Study, Reduced exposure to calcineurin inhibitors in renal transplantation. N Engl J Med 357: 2562-2575.
- Malvezzi P, Rostaing L (2015) The safety of calcineurin inhibitors for kidney-transplant patients. Expert Opin Drug Saf 14: 1531-1546.
- Sikma MA, Kirkels, Verhaar MC (2005) Pharmacokinetics and Toxicity of Tacrolimus Early After Heart and Lung Transplantation, American Journal of Transplantation 15: 2301-2313.
- Nankivell BJ, Borrows RJ, Chapman JR (2004) Evolution and pathophysiology of renal-transplant glomerulosclerosis, Transplantation 78: 461-468.
- Schütte-Nütgen K, Suwelack B, Reuter S (2019) Fast Tac Metabolizers at Risk-It is Time for a C/D Ratio Calculation. J Clin Med.
- Thölking G, Fortmann C, Koch R, Gerth HU, Pabst H (2014) The tacrolimus metabolism rate influences renal function after kidney transplantation. PLoS ONE 9: e111128.
- Jouve T, Noble J, Fonrose X, Janbon B, Fiard G (2019) Tacrolimus Concentration/Dose Ratio is im Independent Predictor of Death-Censored Kidney Allograft Survival. Am J Transplant 19: 682-682.
- Stratta P, Quaglia M, Cena T, Antoniotti R, Fenoglio R, et al. (2012) The interactions of age, sex, body mass index, genetics, and steroid weight-based doses on tacrolimus dosing requirement after adult kidney transplantation. Eur J Clin Pharmacol 68: 671-680.
- Egeland EJ, Robertsen I, Hermann M, Midtvedt K, Størset E, et al. (2017) High Tacrolimus Clearance Is a Risk Factor for Acute Rejection in the Early Phase After Renal Transplantation, Transplantation 101(8): 273-e279.
- Capron A, Mourad M, M De Meyer, L De Pauw, Eddour DC, et al. (2010) CYP3A5 and ABCB1 polymorphisms influence tacrolimus concentrations in peripheral blood mononuclear cells after renal transplantation. Pharmacogenomics 11: 703-714.
- Ji E, Choi L, K S Suh, J Y Cho, N Han, et al. (2012) Combinational effect of intestinal and hepatic CYP3A5 genotypes on tacrolimus pharmacokinetics in recipients of living donor liver transplantation, Transplantation 94(8): 866-872.
- Genvigir FDV, Salgado PC, Felipe CR, Luo EYF, Alves C, et al. (2016) Influence of the CYP3A4/5 genetic score and ABCB1 polymorphisms on tacrolimus exposure and renal function in Brazilian kidney transplant patients, Pharmacogenet. Genomics 26(10): 462-472.
- Kuypers DRJ, De Jonge H, Naesens M, Lerut E, Verbeke K, et al. (2007) CYP3A5 and CYP3A4 but not MDR1 single-nucleotide polymorphisms determine long-term tacrolimus disposition and drug-related nephrotoxicity in renal recipients. Clin Pharmacol Ther 82: 711-725.
- Gijsen V, Mital S, Van Schaik RH, Soldin O, Soldin SJ, et al. (2011) Age and CYP3A5 genotype affect tacrolimus dosing requirements after transplant in pediatric heart recipients, J. Heart Lung Transplant 30:1352-1359.
- O’Regan JA, Canney M, Connaughton DM, O’Kelly P, Williams Y (2016) Tacrolimus trough-level variability predicts long-term allograft survival following kidney transplantation. J Nephrol 29: 269-276.
- Claudio-Campos K, Duconge J, Cadilla CL, Ruaño G (2015) Pharmacogenetics of drug-metabolizing enzymes in US Hispanics, Drug Metabol Personal Ther. 30(2): 87-105.
- Shrestha BM (2017) Two Decades of Tacrolimus in Renal Transplant: Basic Science and Clinical Evidences, Exp Clin Transplant 15(1): 1-9.
- Naesens M, Kuypers DRJ, Sarwal M (2009) Calcineurin Inhibitor Nephrotoxicity. CJASN 4(2): 481-508.
- Ekberg H, Van Gelder T, Kaplan B, Bernasconi C (2011) Relationship of tacrolimus exposure and mycophenolate mofetil dose with renal function after renal transplantation, Transplantation 92(1): 82-87.
- Staatz CE, Tett SE (2004) Clinical Pharmacokinetics and Pharmacodynamics of Tacrolimus in Solid Organ Transplantation. Clin Pharmacokinet 43(10): 623-653.
- Jouve T, Noble J, Rostaing L, Malvezzi P (2018) Tailoring tacrolimus therapy in kidney transplantation, Expert Rev Clin Pharmacol 11: 581-588.
- Jouve T, Noble J, Rostaing L, Malvezzi P (2019) An update on the safety of tacrolimus in kidney transplant recipients, with a focus on tacrolimus minimization. Expert Opin Drug Saf 18: 285-294.
- Thölking G, Gerth HU, Schuette-Nuetgen K, Reuter S (2017) Influence of tacrolimus metabolism rate on renal function after solid organ transplantation, World J Transplant 7: 26-33.
- Niioka T, Kagaya H, Saito M, Inoue T, Numakura K, et al. (2017) Impact of the CYP3A5 genotype on the distributions of dose-adjusted trough concentrations and incidence of rejection in Japanese renal transplant recipients receiving different tacrolimus formulations, Clin. Exp. Nephrol 21: 787-796.
- IW Kim, Noh H, E Ji, N Han, S H Hong, et al. (2015) Identification of Factors Affecting Tacrolimus Level and 5-Year Clinical Outcome in Kidney Transplant Patients, Basic & Clinical Pharmacology & Toxicology 111: 217-223.
- Mancinelli L, Frassetto L, Floren LC, Dressler D, Carrier S, et al. (2001) The pharmacokinetics and metabolic disposition of tacrolimus: A comparison across ethnic groups, Clinical Pharmacology & herapeutics. 69: 24-31.
