 Review Article
Abstract
Damage assessment of lead and pulse generator with various exposure times is important in the development of cardiac devices. Approximately, 92.1 million patients in the US suffer from cardiovascular diseases with an estimated healthcare cost of over $300 billion and at least one million with implantable cardiac devices. These devices are complex and composed on multiple levels and present challenges while assessing the damage. However, the study on the analysis of cardiac devices may lend insight into common damage patterns and improve future cardiac devices design. The objective of this work is to perform a thorough in vivo damage assessment of retrieved 65 cardiac devices and 136 leads from different manufacturers (Medtronic, St. Jude Medical-Abbott and Boston Scientific). The examined damage features were surface deformation, burnishing, pitting, scratching, discoloration, delamination, insulation defects, coil damage, and abrasion. Methods to collect and compile data were performed, and statistical models were used to assess the sensitivity of measured parameters with in vivo performance. The devices from Medtronic and Boston Scientific were affected by the damage modes but these damages could not have affected the functionality of the devices and the therapy. The main damage mode observed was scratching, and the anterior side was more exposed to damage than the posterior side. Medtronic leads showed significant resistant to different damage modes when compared to Boston Scientific and St. Jude Medical, and the middle part was more exposed to damage than the proximal part. Medtronic leads showed failure rates lower than other manufacturers based on the 65 devices that were examined in this paper.
Introduction
Cardiovascular diseases (CVD) are among the leading causes of mortality globally, especially in the developed countries [1]. While 17.3 million mortalities occurred from CVDs in 2008, it is projected to increase to 23 million by 2030 [2]. In the United States alone, about 92.1 million adults have cardiovascular disease with an estimated health-care cost of over $316 billion [2]. There are more than 1 million people around the world with implantable devices for cardiac conditions and quarter of these devices in the United States [3]. These numbers are projected to increase many-folds with time and might reach 2 million in the US alone. A pacemaker delivers electrical impulses via electrodes causing the heart muscles to contract and regulate the heart beating. Therefore, there is a need to understand how these devices deteriorate after implantation so that corrective actions can be taken and in vivo performance enhanced.
Overall, most of the described cardiac devices consist of the pulse generator which is the body of the device and the leads [4]. The pulse generator contains the circuit board and the battery, it stores data such as a total number of cardiac events, the rate of these events, whether these were paced or intrinsic, and high rate episodes. Moreover, cardiac devices offer the ability to store intracardiac electrograms and function as event monitors with the ability to playback the paced or sensed events. These recordings are extremely valuable in diagnosing the cause of symptoms as related to heart rhythms. On the other hand, the other major component that constitutes the cardiac devices is the leads. The leads are specially engineered wires that are designed to connect the pulse generator to the heart muscle. An electrical signal is transmitted through the leads allowing the pulse generator to sense and pace the heart whenever an abnormal behavior is detected. To prevent the electrical signal from travelling to other places, the leads are encased in an insulator which is made either from silicone or polyurethane [4]. In addition, the length of the pacemaker leads typically vary from 45 and 85 cm and the number of leads that are used depends on the type of the cardiac device that will be implanted and of the heart failure symptoms to be monitored [4]. Generally, the malfunctions are defined as failure to pace or sense, or both, and may be caused by problems with battery, the leads, the outer metal case, or the electronic components of the main circuit.
Methodology
The as received devices were cleaned and sanitized for visual inspection. Devices serial numbers were categorized and tabulated from the specifications. The inspection of the pulse generator covered the anterior and the posterior surfaces, Figure 1. The pulse generators were checked for scratches, surface deformation, pitting, discoloration, abrasion, and burnishing. Additionally, the leads were divided into three areas of inspection, the proximal part where the lead is connected to the connector block of the pulse generator, the middle part is known as the conductor, and the distal part where the electrode is located and connects the lead to the cardiac muscle, as shown in Figure 2. Then these leads were checked for surface deformation, burnishing, pitting, scratching, delamination, insulation defect, coil damage, and abrasions. The damage modes identified as surface deformation was described by any minor or major warping that can be found on the surface of the device. Pitting described as a small hemispherical material loss that found on the surface of the device by corrosion. Scratches described as two-dimensional array lines as a result of rubbing. Abrasion described by shredding in the device materials. Discoloration was a change in the appearance (color) of the surface [5]. Insulation defect was described by a surface cracking on the surface of the lead or by complete insulation fracture. Coil damage described a cut in the coil protecting out of insulation or even damaged within the insulation [6]. A damage scoring method was developed to represent damage in terms of individual damage fractions, added linearly to produce a total damage score for the pulse generators and leads. The severity of different damage modes identified. Each damage mode was rated from 1 to 10 with regards to severity, where 0 meant no damage and 10 meant failure. For minor or superficial damages like shallow scratches, depending on the length, depth and the number of the scratches the rate was given from 1 to 5. On the other hand, the deep scratches that can be felt with the fingers were given a score of more than 5 based on the length, depth and the number of scratches. In cases where the device was totally damaged and can affect the normal functionality of the device a total failure to pace or sense, the assigned values were more than 7 and up to 10 [7].
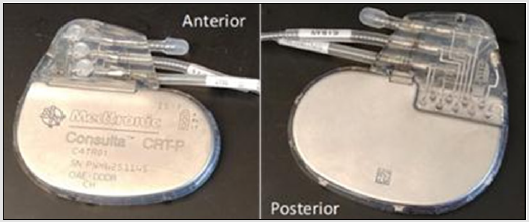
Figure 1: Anterior and Posterior side of the pulse generator.
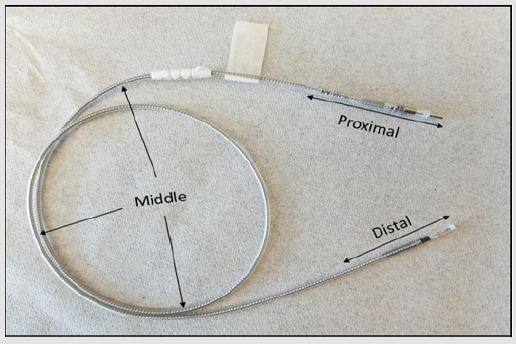
Figure 2: Lead as received from MDT, showing proximal, middle and distal parts.
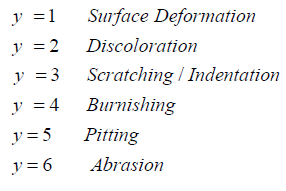
The damage score equation for the pulse generator was developed to determine the damage percentage for each mode. The equation is as follow:
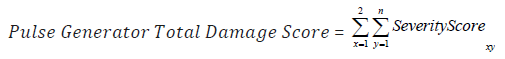
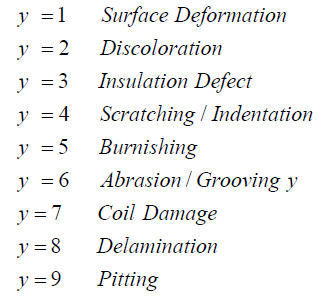
Where x= 1 through 2 and represents the anterior and posterior surfaces of the device, and y represents the damage mode where y=1 through 6.
The results showed the average total damage score for the pulse generator is 0.502 ± 0.28. Then, the damage score equation for the lead was developed to determine the damage percentage for each mode. The equation is as follow:

Where x= 1 through 3 and represents the three parts of the lead (proximal, middle and distal) of the devices, and j represents the damage mode where y=1 through 9[8].
The results showed the average total damage score for the leads is 0.501 ± 0.29. These two equations characterize the accumulative damage made by each mode, and accounting for each part of the pulse generator and the lead. For the pulse generator, the number of the parts was two while the number of the damage modes varied according to different modes. For the lead, the number of the parts was three and the number of the damage features changed according to the equation above. All the devices were optically examined under the optical microscope. Most of the pulse generators had scratches; however, with the naked eye it was not possible to quantify how deep they were. With the use of the microscope, the coils were examined for cut, stretches and other damage modes [9].
Devices were interrogated at Miami Valley Cardiology Clinic and checked the internal components, parameters, remaining charge in the battery, lead impedance, pacing, sensing threshold, time of implant, estimated time of retrieval and other information. The lead trend shows the impedances during the in-vivo life of the lead ranged 200-2000Ω for the pacing lead and 20-200Ω for the defibrillator lead [10]. These impedances were measured to ensure the lead integrity to deliver therapy to the patient. Each damage mode could cause specific failures to the leads and cause abnormal functionality. The failure of the lead is indicated by the one or more of the following failures: failure to capture, failure to sense, impedance out of range, conductor failure, extra-cardiac stimulation, cardiac perforation, lead dislodgement, and insulation defect [11, 12]. Failure to capture (loss of capture) is intermittent or complete failure of the lead to stimulate the heart during a specific time programmed previously (mostly outside the refractory period). Failure to sense (loss of sensing) can be described as intermittent or complete failure of the lead to sense the intrinsic cardiac signal during the specific time programmed previously.
Impedance out of range can be described as the impedance below 200Ω or above 2000Ω for the pacing lead and below 20Ω or above 200Ω for the defibrillator lead. Conductor failure can be seen either by the naked eye or electrically measured if mechanical break of the conductor occurred. Extra-cardiac stimulation occurs when the lead senses signal from other chambers and considers it as R-wave and may lead to inappropriate shock delivery. Cardiac perforation occurs when the lead tip penetrates through the myocardium and it can be observed visually and clinically. Lead dislodgement may be described as a spacing taken place between the lead tip and the cardiac muscle that could lead to inappropriate lead performance. Insulation defect can be described as an evidence of interruption or break in insulation [13]. In order to check for extra-cardiac stimulation, cardiac perforation, and lead dislodgement, the distal part must be presented for examination. However, the other types of failures were observed in the proximal and the middle part of the lead [14].
Results
Pulse Generator
The pulse generators of all the manufacturers are made of commercially pure titanium. However, titanium accrues damage by scratching and discoloration as most devices sustained scratching, Figure 3a. 68% of the anterior surface of MDT devices, 66% SJM and 53% of BSC were scratched. The posterior surface of SJM showed no scratching on the surface, while 44% of MDT and 33% of BSC devices exhibited scratching. Surface deformation, as shown in Figure 3b was also found on both surfaces. The anterior surface sustained higher deformation than the posterior surface. Discoloration was only found on BSC and MDT anterior and posterior surfaces, as shown in Figure 3c. While burnishing was only found on the posterior surface of BSC devices, there were only three SJM devices and cannot be included in statistical analyses. All the damage modes are summarized in Figure 4 illustrating the number of devices examined for each of the manufacturers, degree of surface deformation, scratching, burnishing, and discoloration on the anterior and posterior surfaces [15].
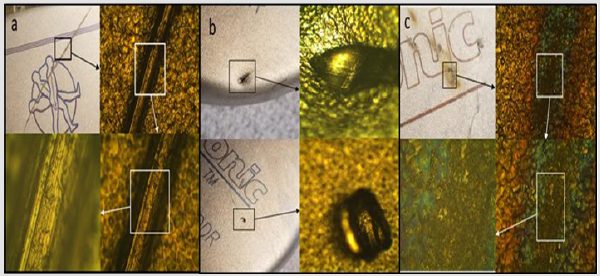
Figure 3: Pulse Generator Damage Modes, (a) Scratch, (b) Surface Deformation, (c) Discoloration.
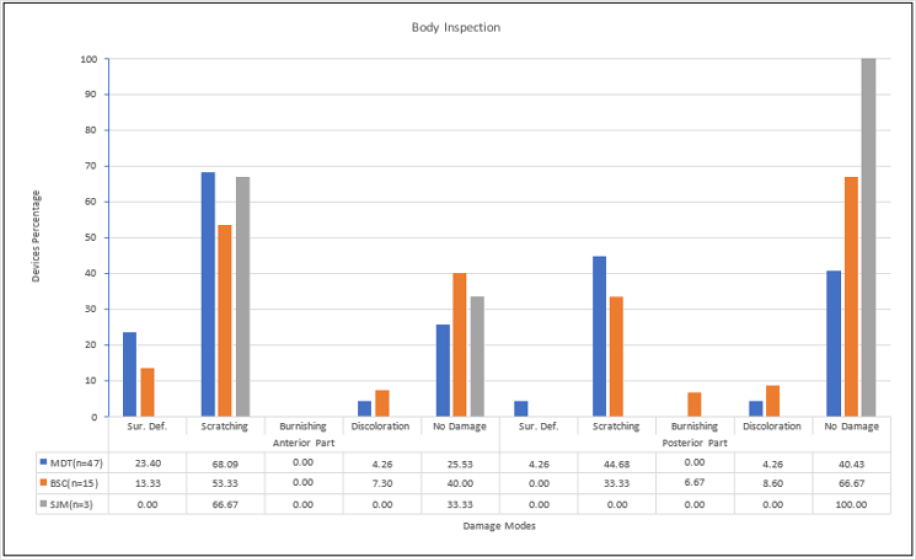
Figure 4: Pulse Generator Inspection, showing the percentage damage for each manufacturer.
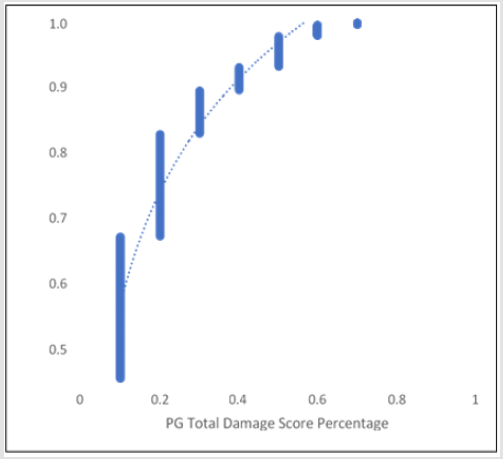
Figure 5: PG Damage Score Distribution.
The damage modes of the pulse generator were compared to each other by using Fisher’s LSD student test using JMP software. The scratching mode showed a significant difference when compared to the other damage modes. This test also showed no significant difference between surface deformation, pitting, discoloration, burnishing, and abrasion. The anterior and the posterior surfaces had compared to each other by using Fisher’s LSD student test. The results showed a statistically significant difference between the anterior and the posterior surface (p=0.0011). Finally, the manufacturers were compared to each other by using Fisher’s LSD student test, the results showed a significant difference for MDT when compared to BSC and SJM (p=0.0399). The damage modes of the pulse generator compared to each other by using Fisher’s LSD student test [16]. It showed a significant difference between scratching on the anterior and the posterior part. Also, the results showed a significant difference between scratching and other damage modes. The pulse generator damage scoring distribution showed that the damage was between 10% and 70%. Higher number of devices with 10% damage, however, as percentage damage increased to 70%, number of devices decreased. Figure 5 illustrates cumulative distribution and total damage score [17].
The battery life was checked using the corresponding program of each cardiac device, and the reports were obtained. Their longevity and the voltage were measured and plotted. A comparison was made between the battery depletion rate from the product reports. Using Ohm meter and the multi-meter, we observed that most batteries were depleted due to in vivo usage of our as received devices [18]. The impedance was checked, and the results showed most of the leads were malfunctioning and had failures. Most of the devices had breaks on the insulation, cuts and scratches that leads to the leakage of the current produced by the pulse generator. However, this could have occurred during device extraction also. At the same time, most of the coax wires had been cut under the insulation or had been stretched which is also a conductor failure and leads to current overgrowth that may drain the battery. These two lead failure features may lead to software failure under pristine conditions. Impedance is innate to the material and electricity at a certain frequency. Some ways to change the impedance are to change the material, to lengthen the circuit, to adjust the potentiometer, or to change the frequency of electricity through inductor or capacitor [19].
Lead
The leads showed visible cuts and stretches. The coax wires were stretched along with cuts. Optical microscope was able to resolve cuts and stretches under the insulation. The inner coil was also frayed in some parts and had numerous breaks. The coax wire on most of the devices was detached out of the insulation and appeared brittle, and in some occasions, broken easily. The distal parts of the leads were not retrieved during extraction and submitted to us for investigation. For the pacing leads, the damage modes observed on both proximal and middle parts were abrasion Figure 6a, discoloration Figure 6d, scratching, coil damages Figure 6b and insulation defect Figure 6c. The proximal part showed fewer damage than the middle part. Abrasion and discoloration on MDT and BSC leads were significant compared to SJM, where no abrasion and discoloration found in the proximal part. On the other hand, for the middle part, discoloration, coil damage, and insulation defect were highly present on SJM leads compared to MDT and BSC. The ICD leads showed more abrasion, scratching and insulation defect in the proximal part than the middle part. BSC had the most abraded and scratched leads when compared to MDT and SJM [20]. SJM, BSC and MDT leads had almost equal insulation defect. For the middle part of the lead, discoloration was only found on MDT leads, and insulation defect was found on both MDT and BSC.
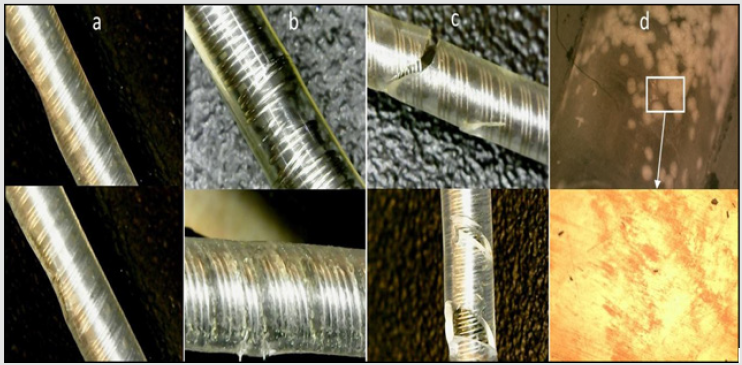
Figure 6: Samples of Lead Damage Modes, (a) Abrasion, (b) Coil Damage, (c) Insulation Defect, (d) Discoloration.
SJM had only one lead in our inventory and this lead had no damage on both the proximal and the middle parts. MDT leads showed no damage, 71.43%, on the proximal part and 85.71% on the middle part, and BSC leads showed no damage 83.33% on the middle part. Even though the availability of the CRT devices in the lab is from both MDT and BSC, but all the leads used were only from MDT of three different types. On the proximal part, discoloration, scratching and insulation defect shared the same percentage with 6.67%. While this percentage increased significantly in the middle part, in addition to coil damage. The percentage of the undamaged parts in the proximal part was higher than the percentage in the middle part of the lead [21]. The damage modes are summarized in Figure 7.
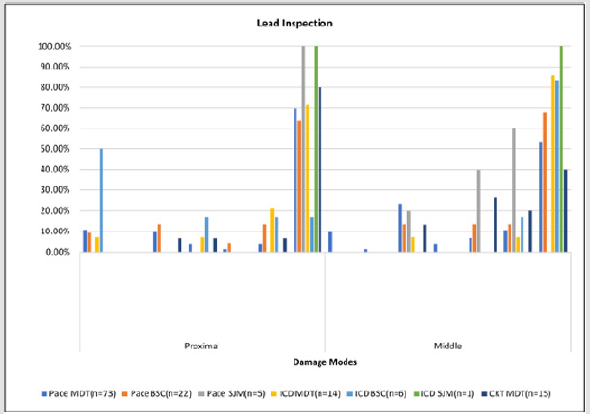
Figure 7: Lead Inspection, showing the damage modes versus different leads for different manufacturers.
The damage modes of the lead were compared to each other by using Fisher’s LSD student test using JMP software. The insulation defect showed a significant difference when compared to the other damage modes, and it showed a significant difference between discoloration, abrasion and coil damage. Then the proximal and the middle parts were compared to each other by using Fisher’s LSD student test where the results showed a statistically significant difference between the proximal and the middle parts (p-value<0.0004) [22]. Also, the results showed no significant difference between discoloration in the middle part, coil damage in the middle part, insulation defect in the proximal part and abrasion in the proximal part. Finally, damage modes compared for the leads and it shows a significant difference between SJM insulation defect and other damage modes for both MDT and BSC. It also showed no significant difference between BSC insulation defect, MDT insulation defect, SJM discoloration, BSC abrasion, and SJM coil damage [23]. The lead damage scoring distribution illustrates that the damage was between 0.1 and 1.
The average damage on leads ranged between 0.1-0.3 damage score. With the increment of the damage score the number of damaged leads decreased, where 17.6% (24 out of 136) of leads with total damage. Figure 8 shows cumulative distribution of the leads and total damage score. According to the characterization of operational parameters, SJM showed higher failure types than MDT and BSC with 50% of its devices. The three manufacturers shared the same conductor fracture rate. Figure 9 shows the types of failure and the distribution of each type for each manufacturer, neglecting lead types. The number of leads that were investigated is 136. The majority were manufactured by MDT (102 leads), while the rest were form BSC (28 leads), and SJM (6 leads) [24]. The results show that BSC leads had 10% higher failure rate than MDT leads with respect to failure to sense, capture and impedance out of range applicable only to our unique retrieved devices which may have been damaged while extraction and transportation. The two most widely used pacing leads were taken and examined thoroughly to identify the types of failure modes [25-28]. These leads were MDT 5076 CapSureFix Novus and BSC 4470 FINELINE II. The results showed the percentage of leads failed to sense, capture and impedance out of range were higher in BSC 4470 (25.00%) than MDT 5076 (15.69%). The conductor fracture in MDT 5076 was 6.67% compared to 8.7% in BSC 4470. Insulators for MDT was Silicone (MED-4719) [36], while BSC 55D polyurethane [29].
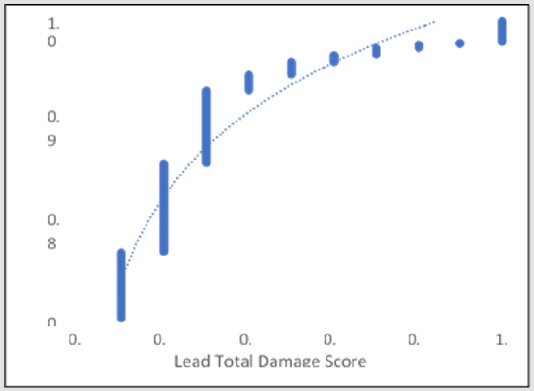
Figure 8: Lead Damage Score Distribution.
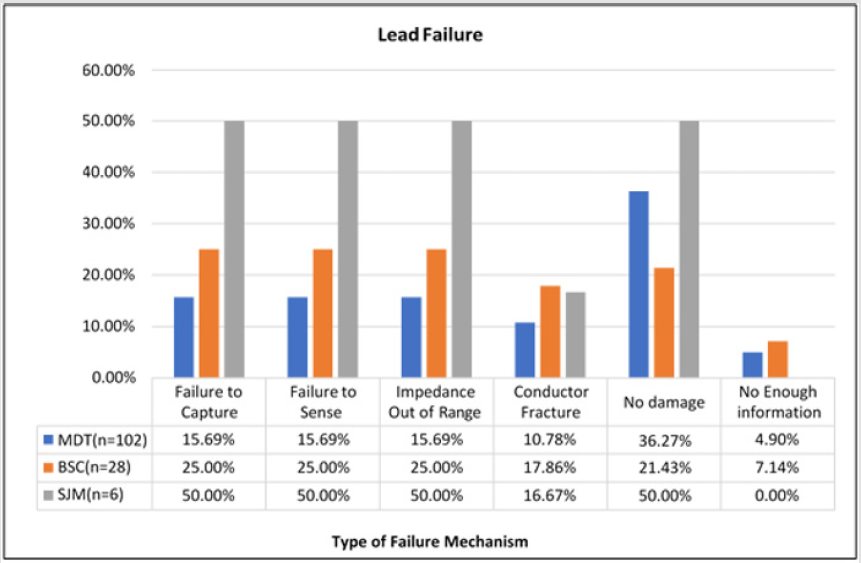
Figure 9: Types of Failure Mechanisms in Leads, showing the percentage of each failure type for each manufacture.
The two most widely used ICD leads were taken and inspected carefully to categorize the failure types, the leads are MDT 6947 Sprint Quattro Secure and BSC 0157 ENDOTAK RELIANCE. The percentage failure of MDT 6947 for our devices was lower than the percentage failure of BSC 0157 with 33.33% for MDT 6947 and 42.86% for BSC 0157, while no lead exposed to conductor fracture. MDT used polyurethane as the outer insulator and silicone rubber as inner insulator [30], while BSC silicone rubber as the lead insulator [30]. Therefore, three MDT CRT leads were examined to identify the types of failure. The three inspected leads were 4196 Attain Ability, 4194 Attain OTW and 4193 Attain OTW. The results showed that the 4196 Attain Ability lead had a lower failure rate than the other leads as well as no conductor fracture. All 4194 Attain OTW leads were all failed due to the damage modes discussed previously. While 50% of the 4196 and 4193 leads exhibited no damages. Figure 10 summarizes the failure types and the percentage that occurred to the pacing, ICD and CRT leads [31].
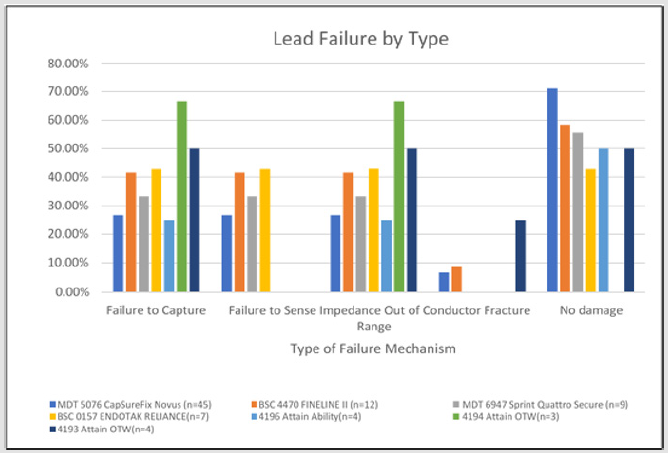
Figure 10: Types of Failure Mechanisms in leads, showing the comparison between the pacing and the ICD leads of MDT and BSC, and three MDT CRT leads.
40 out of 65 devices were still functioning and have a range of longevity from 3 months to 11.5 years. These devices are listed in Appendix I and continue to be analyzed for another effort. Two of the active devices were connected to an oscilloscope to examine the functionality of these devices. The output waveform from the leads was measured [32]. Figure 11 represents the obtained waveforms that verify the functionality of the device. The course time of the pulse generator survival for both MDT (n=24) and BSC (n=11) is shown by Kaplan-Meier curves in Figure 12 obtained for 65 as received devices. The cumulative survival is 71% at one year and 10% at six years for both MDT devices and BSC devices respectively, the cumulative survival probability for MDT is 10% at six years and no survival for BSC devices. Pacemaker showed 88% survival rate after one year of implantation for both MDT and BSC. After four years, however, the survival rate reduced to 40% for MDT and 38% for BSC from the as received devices. No survival for BSC after six years of implantation, while 16% survival for MDT pacemakers. The survival probability of the leads for both MDT (n=34) and BSC (n=9) is shown in Figure 13.
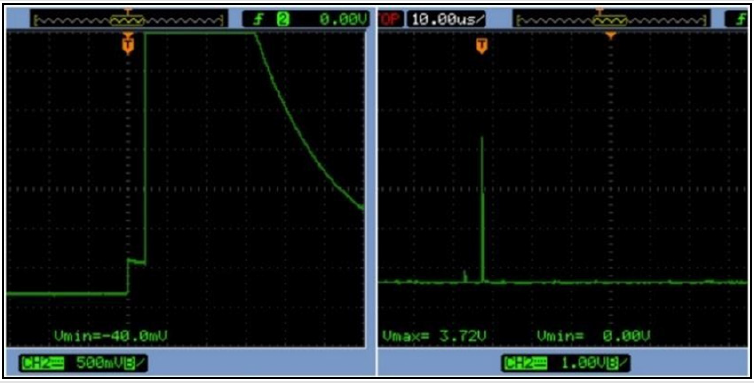
Figure 11: Pulse width and the Voltage, obtained by connecting the devices to an oscilloscope.
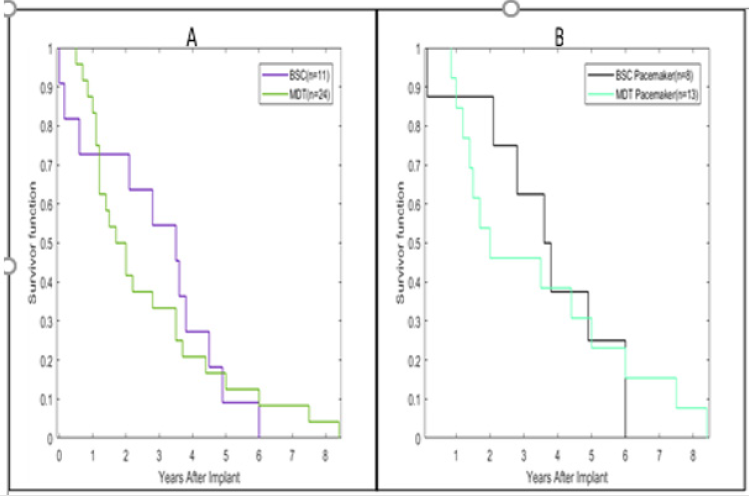
Figure 12: Kaplan-Meier analysis of survival of (A) Medtronic Devices (n=24) and Boston Scientific Devices (n=11), (B) Medtronic Pacemakers (n=13) and Boston Scientific Pacemakers (n=8).

Figure 13: Kaplan-Meier analysis of survival of (A) Medtronic Pacing Leads (n=34) and Boston Scientific Pacing Leads (n=9).
After 60 months, the survival is 60% for MDT and 68% for BSC. The survival is 6% after 176 months of implantation for both the manufacturers, and no survival for BSC after 180 months of implantation, while MDT is 6% survival after 180 months after implantation. 33% of BSC devices used MDT leads for different purposes [33]. Sensitivity can be defined by the capability of the device to sense the intrinsic heartbeat. It represents the minimum cardiac signal that can be sensed by the pacemaker to initiate or terminate the therapy. The sensitivity is measured in millivolts, the higher sensitivity the lower voltage programmed. When programming the sensitivity to a low value, this means allowing the device to sense additional signals than expected and could cause what is known as over-sensing. When programming the sensitivity to a higher value, this means preventing the device from detecting the intrinsic cardiac signal and could cause what is known as under-sensing [34]. Figure 14 illustrates the sensitivity distribution for all the investigated devices. The mean sensitivity is 1.188 mV and ranges from 0.25-4 mV. Additionally, the mean sensitivity value of the ventricular leads was 1.465 mV and ranged from 0.3- 2.8 mV. Furthermore, the mean sensitivity value of the atrial leads was 1.188 mV and ranged from 0.25-4 mV. Figure 15 shows the difference between the sensitivity setting of the ventricular and atrial leads, and it shows the ventricular sensitivity setting was higher compared to the atrial sensitivity setting [35].
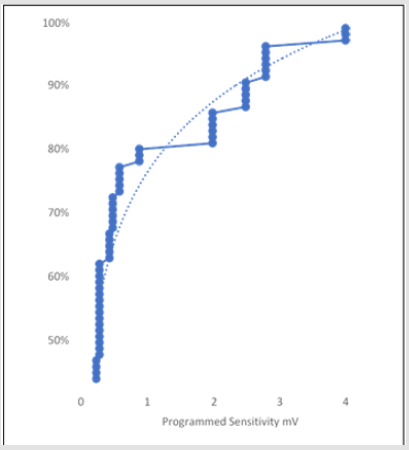
Figure 14: Sensitivity Distribution for all the leads.
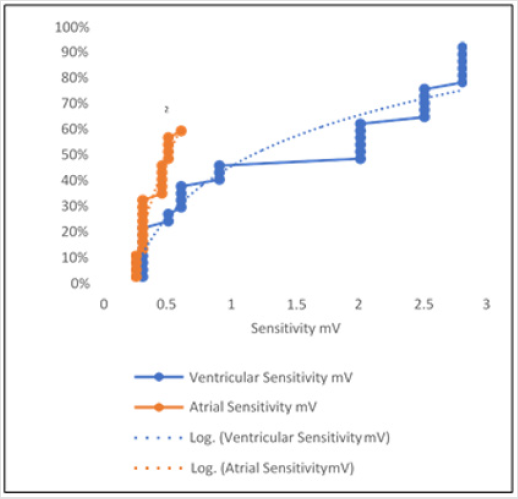
Figure 15: Sensitivity Distribution for both ventricular and atrial leads.
Discussion
In literature the pulse generator of the cardiac device has rarely been investigated for damage. Most of the investigations were done on the leads. Discoloration was found on the titanium oxide cases resulting in the white discoloration could have led to further biodegradation. The discoloration on the cases do not affect the functionality of the devices. The percentage damage mode present on the pulse generator is shown in Table 1. The damage percentage on the anterior part is 61.93% and on the posterior part is 38.07%. The leads showed visible cuts and stretches. The coax wires were stretched along with cuts [36]. Optical microscopy shows several areas the insulation had been degraded scratched or even cut and may affect the functionality of the devices. The lead damage modes and the percentage of each mode is summarized in Table 2. Previous efforts from literature showed that electrical tests, optical microscopy and SEM [37] were performed on the lead. The work was presented to investigate for coil damage in 49 leads from one manufacturer.
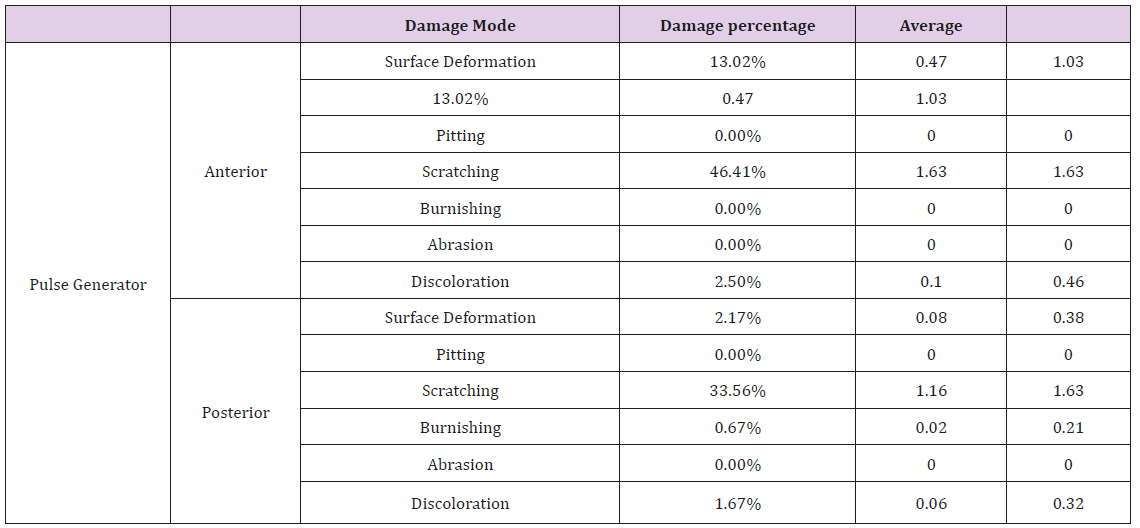
Table 1: Pulse Generator Damage Mode Percentage, average damage and standard deviation.
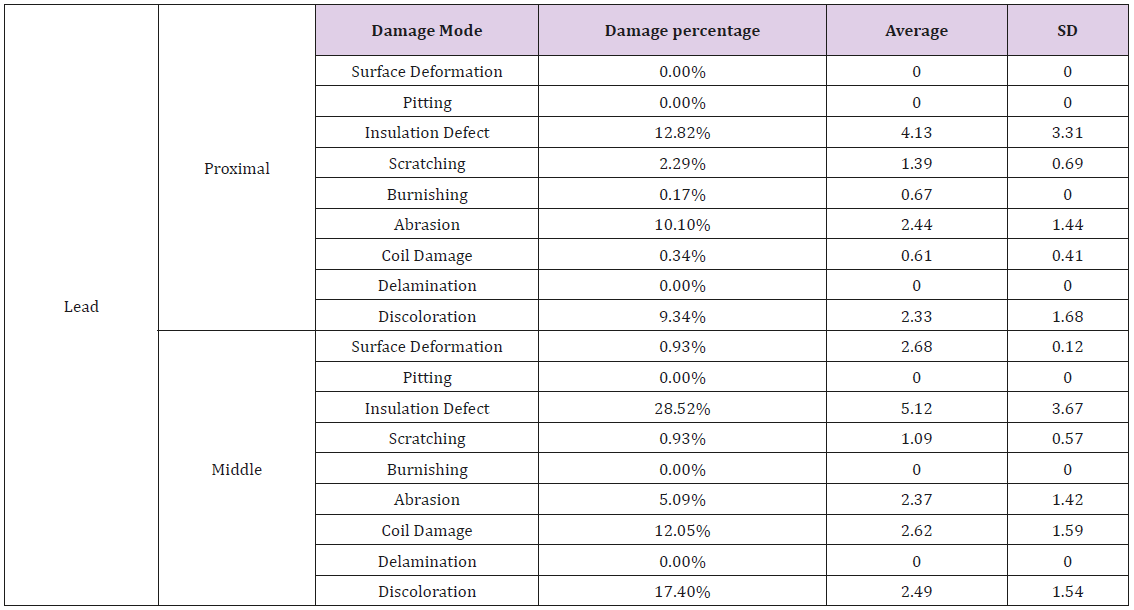
Table 2: Lead Damage Mode Percentage, average damage and standard deviation.
Additionally, optical microscopy, SEM and FTIR used to determine the chemical degradation on the inner and outer insulation. This is a key feature of learning the residual properties of the leads and its insulation. They did their investigation about the biodegradation of the PU insulation of 7 leads. In addition, Hauser et al. investigated the lead failure in one lead type [38]. Additionally, Mehta et al. performed clinical evaluation of 132 randomized patients for four years to identify the complication of leads [39]. This study showed the same results as current work that the ICD leads are more vulnerable than pacing leads in insulation break down. Furthermore, Kron et al. [43] used data from 539 patients, and this study was conducted for 4 years. It showed that 2.8% of the leads fractured [40]. Fortescue et al. [29] collected data from one pediatric center during 1980-2002. A total of 1007 leads were implanted in 497 patients. Lead failure occurred in 155 leads 15%, and the patients who experienced multiple failures were 28%. They found the insulation defect percentage was 32.2% of the failed leads. In general, the investigation in this paper was significant due to the variation of the devices involved. It involved 65 cardiac devices and 136 leads from different manufacturers [41]. Visual inspection, optical microscope inspection and electrical tests were performed to determine the damage modes for these devices.
Sensitivity metric equation was created from the data that were generated during this investigation from the devices. The goal was to mathematically model the sensitivity for any given time. A principal component analysis was performed for the acquired data to isolate those parameters that are the most important to create the sensitivity metric expression (S). It was noticed that as the voltage increased the pulse width decreased and vice-versa. Therefore, sensitivity function parameters (F) were defined in terms of voltage, (F1) and pulse width (F2) as reciprocal, (1/F2). It is important to note that if the voltage doubled, then the energy usage can be higher. Lastly, the time was a crucial component and by far the most important [42].
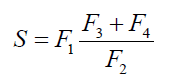
F1 is the voltage in millivolts, F2 is the pulse width in milliseconds, F3 is the in ohms, and lastly is F4 the current in milli-amperes. The interrogation of the devices leads to numerous discoveries, and the relation between sensitivity setting, pulse width and impedance can be revealed through the obtained reports. Sensitivity plot generated using MATLAB R2017a, that contained impedance, pulse width, and sensitivity setting as shown in Figure 16. This plot shows that with low impedance and high pulse width, the sensitivity is low. However, the impedance increases the sensitivity and pulse width, this scenario depletes the battery earlier than estimated. In general, the devices investigated in this report were from Medtronic and Boston Scientific exhibit surface damage modes, but these damages could not have affected the functionality of the device and the therapy. The main damage mode observed was scratching, and the anterior side was more exposed to damage than the posterior side. Medtronic leads showed significant resistant to different damage modes when compared to Boston Scientific and St. Jude Medical, for our sample size, and the middle part was more exposed to damage than the proximal part [43].
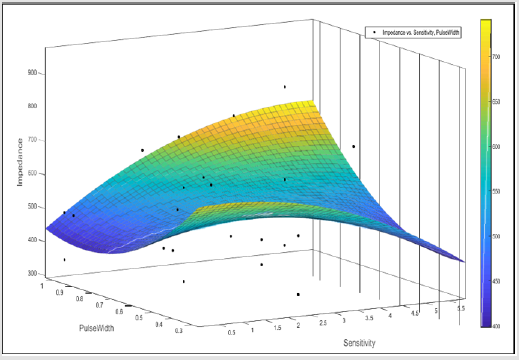
Figure 16: Sensitivity Plot.
Conclusion
The devices used in this investigation were received from The Wright State Anatomical Gift Program. These devices were extracted posthumously and ranged from 3 months to the end of service. It can be inferred that the pulse generator cases had mainly scratches that were shallow, narrow and could not have affected the functionality of the devices. The discoloration on the cases was caused by the growth of organic material from the body or due to the exposition to fluids (alcohol, bleach, dimethyl formaldehyde etc.) used in the sterilization process of the devices after their retrieval. However, the discoloration could not have affected the functionality of the devices. In addition, the investigation showed that the anterior side was more exposed to damage than the posterior side. The leads, which consist of the inner coil, outer coil and the insulation around the coils, had visible insulation defect, stretches, and coil damages that caused different types of failures and could have affected the functionality of the devices. However, these damages may have happened during the extraction/pulling of the devices or during the replacement of the leads not during the in vivo usage. In general, Medtronic leads showed significant resistance to different damage modes when compared to Boston Scientific and St. Jude medical, and the middle part was more exposed to damage than the proximal part. Medtronic leads showed higher survival rate than other manufacturers. Medtronic packing and ICD leads also exhibited the same behavior for 65 devices studied during this investigation.
References
- Gaziano TA, Bitton A, Anand S, Abrahams Gessel S, et al. (2010) Growing epidemic of coronary heart disease in low-and middle-income countries. Current problems in cardiology 35(2): 72-115.
- Gemma Vilahur, Juan José Badimon, Raffaele Bugiardini, Lina Badimon (2014) Perspectives: The burden of cardiovascular risk factors and coronary heart disease in Europe and worldwide. European Heart Journal Supplements 16(suppl_A): A7-A11.
- Sanjeev Saksena, Maria Poczobutt Johanos, Lon W Castle, Richard N Fogoros, et al. (1992) Long-term multicenter experience with a second-generation implantable pacemaker-defibrillator in patients with malignant ventricular tachyarrhythmias. Journal of the American College of Cardiology 19(3): 490-499.
- Emelia J. Benjamin, Michael J. Blaha, Stephanie E. Chiuve, Mary Cushman, Sandeep R. Das, et al. (2017) Heart disease and stroke statistics-2017 update: a report from the American Heart Association. Circulation, 135(10).
- Childs K, Crosby L, Goswami T (2016) Quantitative Analysis of Retrieved Glenoid Liners. Lubricants, 4(1): 3.
- Hauser RG, McGriff D, Retel LK (2012) Riata implantable cardioverter- defibrillator lead failure: analysis of explanted leads with a unique insulation defect. Heart Rhythm 9(5): 742-749.
- Jane Sands Robb, Robert Cumming Robb (1942) The normal heart: anatomy and physiology of the structural units. American Heart Journal 23(4): 455-467.
- Aaron Hesselson (2003) Simplified Interpretation of Pacemaker ECGs: An Introduction. John Wiley & Sons.
- Joseph S Owen, Sammy Khatib, Daniel P Morin (2009) Cardiac resynchronization therapy. The Ochsner Journal 9(4): 248-256.
- Bock DC, Marschilok AC, Takeuchi KJ, Takeuchi ES (2012) Batteries used to power implantable biomedical devices. Electrochimica acta 84.
- Medtronic Inc (2018) Medtronic CRM product performance report- Issue 78 MDT CRHF PPR 2018 1st Edition.
- (2000) Guidance for the Submission of Research and Marketing Applications for Permanent Pacemaker Leads and for Pacemaker Lead Adaptor 510(k) Submissions- Guidance for Industry. U.S Food and Drug Administration
- Maully Shah, Larry Rhodes, Jonathan Kaltman (2017) Cardiac Pacing and Defibrillation in Pediatric and Congenital Heart Disease. Wiley Online Library.
- Kirk Jeffrey (2001) Machines in our hearts: the cardiac pacemaker, the implantable defibrillator, and American health care. JHU Press.
- Maisel WH, Moynahan M, Zuckerman BD, Gross TP, Tovar OH, et al. (2006) Pacemaker and ICD generator malfunctions: analysis of Food and Drug Administration annual reports. Jama 295(16): 1901-1906.
- Gloria L Jarmon (2018) Hospitals Did Not Comply with Medicare Requirements for Reporting Certain Cardiac Device Credits. Department of Health and Human Services.
- Bock DC, Marschilok AC, Takeuchi KJ, Takeuchi ES (2012) Review article: Batteries used to power implantable biomedical devices. Electrochim Acta 84: 155-164.
- Charles J Love (2006) Cardiac pacemakers and defibrillators. 1-174.
- Takeuchi ES, Leising RA (2002) Lithium batteries for biomedical applications. MRS bulletin 27(8):624-627.
- Matsuda Y, Morita M, Yamada K, Hirai K (1985) Characteristics of sulfolane‐ based electrolytes for rechargeable lithium batteries. Journal of The Electrochemical Society 132(11): 2538-2543.
- Bock DC, Marschilok AC, Takeuchi KJ, Takeuchi ES (2012) Batteries used to power implantable biomedical devices. Electrochim acta 84: 155-164.
- Nishio K (2009) PRIMARY BATTERIES–NONAQUEOUS SYSTEMS Lithium– Manganese Dioxide. KUNDOC
- Watanabe N, Fukuda M (1970) U.S. Patent No. 3,536,532. Washington, DC: U.S. Patent and Trademark Office.
- Watanabe N, Fukoda M (1972) U.S. Patent No. 3,700,502. Washington, DC: U.S. Patent and Trademark Office.
- Greatbatch W, Holmes CF, Takeuchi ES, Ebel SJ (1996) Lithium/carbon monofluoride (LI/CFx): a new pacemaker battery. Pacing and clinical electrophysiology 19(11): 1836-1840.
- Gan H, Rubino RS, Takeuchi ES (2005) Dual-chemistry cathode system for high-rate pulse applications. Journal of power sources 146(1): 101-106.
- Kaimin Chen Donald, R Merritt William, G Howard Craig, L Schmidt, Paul M Skarstad (2006) Hybrid cathode lithium batteries for implantable medical applications. Journal of power sources 162(2): 837-840.
- Fortescue EB, Berul CI, Cecchin F, Walsh EP, Triedman JK, et al. (2004) Patient, procedural, and hardware factors associated with pacemaker lead failures in pediatrics and congenital heart disease. Heart Rhythm 1(2): 150-159.
- Charles J Love (2006) Cardiac pacemakers and defibrillators.
- Brodd RJ, Bullock KR, Leising RA, Middaugh RL, Miller JR, (2004) Batteries, 1977 to 2002. Journal of Electrochemical Society 151(3): K1- K11.
- Kenny T (2008) The nuts and bolts of cardiac pacing, 2nd
- Ellenbogen KA, Kaszala K (2014) Cardiac pacing and ICDs, Sixth edition.
- Charles D Swerdlow, Gautham Kalahasty, Kenneth A Ellenbogen (2016) Implantable cardiac defibrillator lead failure and management. Journal of the American College of Cardiology 67(11): 1358-1368.
- Korpas D (2013) Implantable cardiac devices technology. Springer
- Hayes DL, Friedman PA, Samuel J Asirvatham, (2012) Cardiac pacing, defibrillation and resynchronization: a clinical approach. Wiley Online Library
- Laudon MK (1995) “Pulse Output”, Chapter 11 of Design of Cardiac Pacemakers, Edited by John Webster, published by the Institute of Electrical and Electronics Engineers, Inc., New York, USA, pp. 251-276.
- Haddad, Sandro Augusto Pavlik, Serdijn, Wouter A (2009) Ultra low-power biomedical signal processing: an analog wavelet filter approach for pacemakers. Springer
- Donald M Jacobs, andrew S Fink, robert P Miller, w Robert anderson, rick D Mcvenes, et al. (1993) Anatomical and morphological evaluation of pacemaker lead compression. Pacing and Clinical Electrophysiology 16(3): 434-444.
- Michael J Wiggins, Bruce Wilkoff, James M Anderson, Anne Hiltner (2001). Biodegradation of polyether polyurethane inner insulation in bipolar pacemaker leads. Journal of Biomedical Materials Research 58(3): 302-307.
- Hauser RG, McGriff D, Retel LK (2012) Riata implantable cardioverter- defibrillator lead failure: analysis of explanted leads with a unique insulation defect. Heart Rhythm 9(5): 742-749.
- Rack HJ, Qazi JI (2006). Titanium alloys for biomedical applications. Materials Science and Engineering: C 26(8): 1269-1277.
- Mehta D, Nayak HM, Singson M, Chao S, Pe E, et al. (1998) Late complications in patients with pectoral defibrillator implants with transvenous defibrillator lead systems: high incidence of insulation breakdown. Pacing and clinical electrophysiology 21(10): 1893-1900.
- Kron J, Herre J, Renfroe EG, Rizo Patron C, Raitt M, et al. (2001) Lead-and device-related complications in the antiarrhythmics versus implantable defibrillators trial. American heart journal 141(1): 92-98.
