 Research Article
Abstract
Pancreas is a vital organ regulating the physiological lipid level. However, how lipid metabolism changes in pancreatic disease, especially in pancreatic cancer, is not yet clearly elucidated. To investigate the plasma lipid profiling of healthy individuals (H group), patients with Chronic Pancreatitis (CP) (C group), and patients with Pancreatic Ductal Adenocarcinoma (PDAC) (P group) using ultra-performance liquid chromatograph-time of flight mass spectrometry (UPLC-TOF/MS) method. Total 669 lipid elements were identified, and there was a similar percentage of the different lipid components in each group. A bioinformatics analysis revealed 46 and 43 lipid elements which were overexpressed in C and P groups respectively. Levels of 27 and 17 lipid elements were reduced in C and P groups respectively demonstrating different lipid profile in C and P groups. Specifically, lipid PA is only elevated in C group. Two elements from triacylglycerol group, TG(16:0/18:2(9Z,12Z)/20:3(8Z,11Z,14Z))[iso6] and TG(17:2(9Z,12Z)/17:2(9Z,12Z)/2 0:0)[iso3] were reduced in the C group but elevated in P group. The altered lipid level provides new possibilities of lipid biomarker pool for diagnostic, prognostic as well as predictive purposes.
Keywords: Lipidomic; Chronic Pancreatitis; Pancreatic Ductal Adenocarcinoma; Triacylglycerol
Abbreviation: PA: Phosphatidic Acid, PC: Phosphatidylcholine, PE: Phosphatidylethanolamine, PI: Phosphatidylinositol, PS: Phosphatidylserine, PG: Phosphatidylglycerol, SM: Sphingomyelins Sphingolipids, TG: Triacylglycerol Glycerol lipids, DG: Diacylglycerol Glycerol lipids, CL: Cardiolipin Phospholipids
Introduction
Pancreatic Ductal Adenocarcinoma (PDAC) is a highly lethal disease with a 5-year survival rate of approximately 5% [1]. It is highly therapy-resistant and only surgery has a curative option. However, only about 20% patients with PDAC can be available for surgery due to the presence of metastasis at the time of diagnosis [2]. Chronic Pancreatitis (CP) is one of the major risk factors for PDAC [3]. Notably, in some cases, a differential diagnosis for PDAC and CP is challenging, and final diagnosis can be set only during the surgery. Therefore, biomarkers to classify persons with/without pancreatic diseases, especially to distinguish CP and PDAC could be helpful for diagnosis and treatment strategy. Biomarkers provide diagnostic, prognostic, predictive, or therapeutic information about a particular disease [4]. In order to improve the clinical outcome, a number of studies have been carried out on finding novel DNA- miRNA-, and metabolomics-based biomarkers for the early detection, diagnosis, monitoring and prognosis evaluation of PDAC and CP [5-8]. Novel metabolic biomarkers for PDAC based on Mass Spectrometry (MS) and Nuclear Magnetic Resonance (NMR) have been reported [9,10]. However, a consensus regarding these results is yet controversial. In the present study, we analyzed the lipid profile using ultra-performance liquid chromatograph-time of flight mass spectrometry (UPLC-TOF/MS) to investigate the lipid metabolism in healthy individuals (H group), patients with CP (C group), and patients with PDAC (P group). The lipid profiling analysis revealed particular differences in these three groups.
Materials and Methods
Patient Recruitment Plasma Sample Collection
The present study was approved by the Ethics Committee of the Second Affiliated Hospital of Zhengzhou University, Zhengzhou, China. All participants signed the Informed Consent Form. We recruited 5 patients diagnosed with PDAC (P group) at the Department of General Surgery in Second Affiliated Hospital of Zhengzhou University from October 2015 to March 2016. PDAC diagnosis was confirmed by a histopathologic examination. Five healthy volunteers (H group) and 5 patients with CP (C group) were randomly recruited from the Physical Examination Department or the Department of Digestive Internal Medicine, respectively. CP was diagnosed by the following criteria from the 2014 Chinese Guide for Diagnosis and Treatment of Chronic Pancreatitis:
(1) chronic abdominal pain and or pancreatic calcifications;
(2) abdominal pain and morphological features of distortion in duct pancreatograms;
(3) exocrine pancreatic insufficiency;
(4) histopathological changes, wherein surgical resection was indicated; and
(5) one or more than one imaging examinations showing the characteristic morphological changes of CP.
Patients in the C group and healthy individuals in H group were not diagnosed with any cancer, and also, did not present any prior cancer history. The clinic epidemiological characteristics of the participants are summarized in (Table 1).
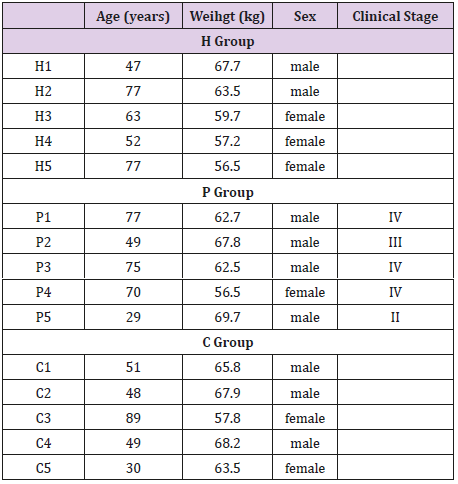
Table 1: Patient information H: healthy volunteers; C: chronic pancreatitis; P: PDAC
Plasma Sample Collection
All blood samples were withdrawn before operation and collected into polyethylene tubes pre-rinsed with EDTA. Samples were centrifuged at 2500 rpm for 5 min at 4°C at the Institute of Digestive Diseases. Plasma samples of patients from each group were immediately frozen and stored at −80°C, and the cells and buffy coat were discarded.
Extraction of Lipids
Briefly, 100μL plasma was thawed and mixed with 900μL isopropanol (IPA). After vigorously agitating for more than 10 s and sonicating for 10min, the mixture was frozen at –20°C for 1h, followed by centrifugation at 10,000rpm for 10min. The upper layer (800μL) was transferred to a sample vial and analyzed by UPLC-QTOF/MS.
UPLC-QTOF/MS analysis
Quality Control (QC) samples were prepared by pooling the aliquots of all plasma samples that were representative of the serum samples under analysis. Blank samples (IPA/water: 90/10) and QC samples were injected (five samples each) during acquisition. The UPLC-QTOF/MS analyses were performed using a UPLC system (ACQUITY UPLC I-Class, Waters Co., Manchester, UK) coupled to an electrospray ionization quadruple time-of-flight mass spectrometer (ESI-QTOF/MS) (Xevo G2-S Q-TOF, Waters). Waters ACQUITY UPLC CSH column [particle size, 1.7μm; 50mm (length) x 2.1mm (i.d.)] was used for the LC separation, and the column temperature was maintained at 55°C. The flow rate was 0.4mL/min and the sample injection volume was 2μL. The mobile phase A contained 0.1% FA and 10mM ammonium formate in ACN/H2O (60/40%), and B contained 0.1%FA and 10mM ammonium formate in IPA/ACN (90/10%). The linear gradient was set as follows: Initial: 40% B, 0–2min: 40–43% B, 2–2.1min: 43–50% B, 2.1–12min: 50–54% B, 12–12.1min: 54–70% B, 12.1–18min: 70–99% B, 18–18.1min: 99– 40% B, 18.1–20min: 40% B.
High-accuracy MS data were recorded by MassLynx 4.1 software (Waters). Capillary voltage was set at 3.0kV for both positive and negative modes, whereas the cone voltage was at 25V for both modes. The source temperature was set at 120°C with a cone gas flow of 50L/h, and desolvation temperature was set at 450°C with desolvation gas flow at 850L/h. Leucine-enkephalin (Waters Co.) was used as the lock-mass generating a reference ion at m/z 556.2771 in the positive mode and m/z 554.2615 in the negative mode that were introduced by a lockspray at 5μL/min for data calibration. The MSE data were acquired in the continuum mode using ramp collision energy in two scan functions. For the low energy mode, the scan range, scan time, and collision energy were set at 50–2000 Da, 0.2s, and 6V, respectively; whereas for the high-energy mode, the parameters were set at 50–2000 Da, 0.2s, and 15−60V were employed.
Lipidomics Data Analysis
Data were collected in both positive and negative ESI QTOF modes operated in the full-scan mode at a scan range of 100–2000 Da, scan time of 0.25s, and a collision energy ramp of 35−60V. The temperature of the source was set at 150°C with a cone gas flow of 50L/h. The desolvation temperature was set at 500°C with desolvation gas flow of 800L/h. The leucine-enkephalin peptide was used as the lock-mass generating a reference ion at m/z 556.2771 in the positive mode and m/z 554.2615 in the negative mode that was introduced by a lockspray at 10μL/min for data calibration. The MSE data were acquired in the centroid mode using ramp collision energy in both the positive and negative scan functions. MassLynx4.1 software (Waters, Massachusetts, USA) was employed to record the results and obtain the molecular features of the samples for non-targeted lipidomic analysis of the extracted features. The screened data were taken into account after correcting for individual bias using QC and blank data. For multivariate analysis lipidomics, EZinfo 3.0 controlled by Progenesis QI was used to perform various analyses such as Principal Component Analysis (PCA), orthogonal signal correction partial least square regression discrimination analysis (OPLS-DA), Variable Importance in Projection (VIP) and volcano analysis for coefficients vs. VIP spots. The VENN analysis was carried out using the Venn 2.1 online software (http://bioinfogp.cnb.csic.es/tools/venny/index.html).
Results
General PCA analysis revealed that dots from the 3 groups localizes in different zones (Figure 1) indicating different lipid metabolism in the groups analyzed. PCA for comparison of H vs C as well as H vs P clearly demonstrated that lipid element dots were conversely distributed (Figures 2A & 3A). Further, the OPLS-DA found out that in each score plot, dots are localized in diagonal conversely quadrants (Figures 2B & 3B), presenting the OPLS-DA model efficiently distinguishes the groups tested. Then, VIP was calculated, and compounds with VIP > 1 were screened as deregulated elements contribute to the difference between groups (Figures 2C & 3C). Finally, these elements were retested by volcano analysis (coefficients vs. VIP spots) (Fig. 2D and 3D). Subsequently, totally 669 lipid elements were identified in H, C, and P ( Table 2). Lipid type analysis revealed a similar percentage of the different lipid components in each group. The order from the maximal to the minimal parts is Triacylglycerol (TG) (33-34%), others (30-31%, composed of different lipids), phospholipids (29%), and Diacylglycerol (DG) (7%). The up- and down regulated lipids elements in C & P both groups compared with H group were classified (Table 3), obviously, compared with H group, PA and TG are elevated and reduced only in C group respectively. Compared with H group, in C group there were 46 and 27 lipid elements are up-/down regulated (Tables 4 & 5), while 43 and 17 elements were up-/down regulated in P group than that in H group respectively (Tables 6 & 7). To classify the lipid elements in different groups, VENN method was utilized to analyze the deregulated elements in C and P groups (Figure 4). This analysis demonstrates that 46 and 43 lipid elements were over expressed in the C (blue zone) and P (green zone) groups than in the H group respectively, and 28 of the 89 elevated lipid elements were shared by both C and P groups (blue-green overlap zone). Besides, 27 and 17 lipid elements were found to be down regulated in C (yellow zone) and P (pink zone) groups respectively. Finally, 13 of the 44 reduced elements were common in the two groups (yellow-pink overlap zone). Two common lipid elements located in the yellow-green overlap zone indicate their reduction in the C group (yellow zone) while elevated in the P group (green zone) as compared to H group: (i) TG(16:0 /18:2(9Z,12Z)/20:3(8Z,11Z,14Z))[iso6] with the formula name C57H100O6 and (ii) TG(17:2(9Z,12Z)/17:2(9Z,12Z)/20:0)[iso3] with the formula name C57H102O6. There were no elements found to be reduced in P (pink zone) simultaneously elevated in C groups (blue zone). Obviously, compared with H group, PA and TG were elevated and reduced respectively only in C group.
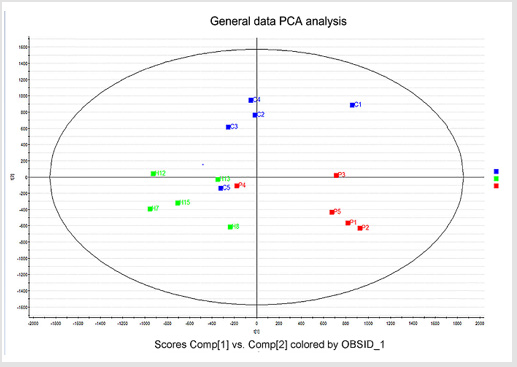
Figure 1: general data PCA analysis.
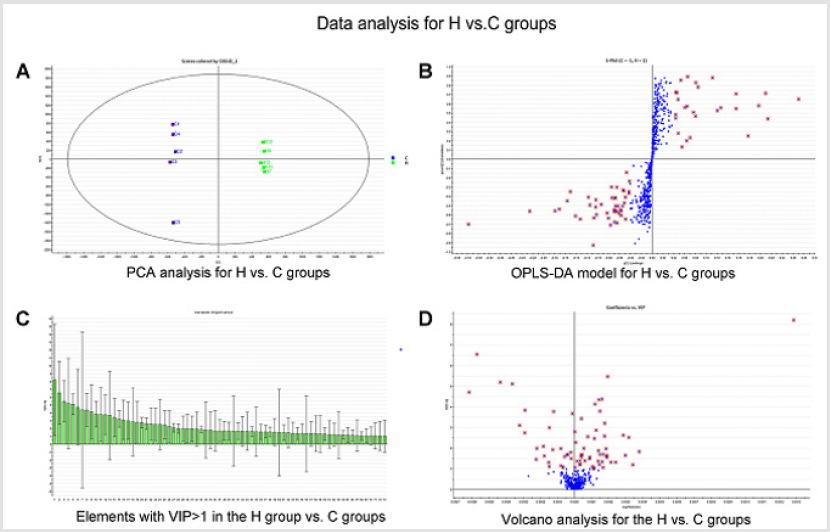
Figure 2: data analysis for H vs. C groups.
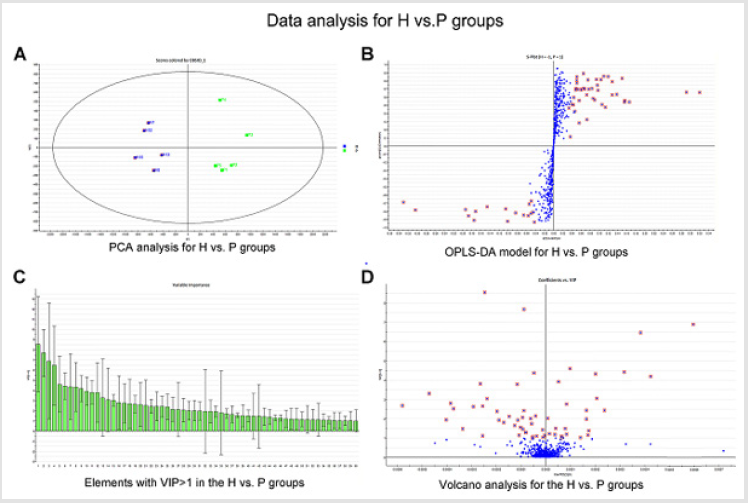
Figure 3: data analysis for H vs. P groups.
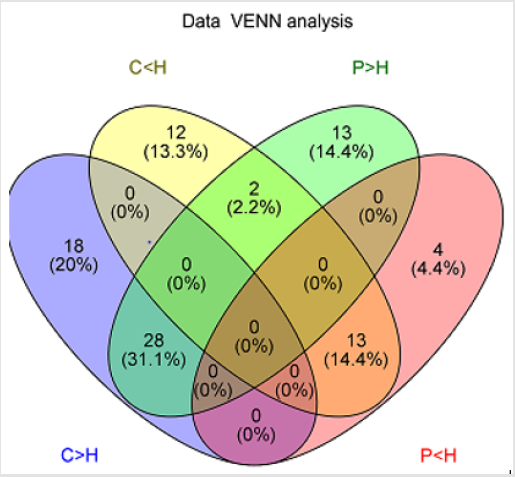
Figure 4: data VENN analysis.
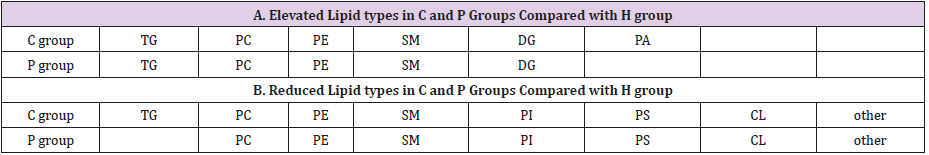
Table 3: Deregulated lipid types in C and P groups.
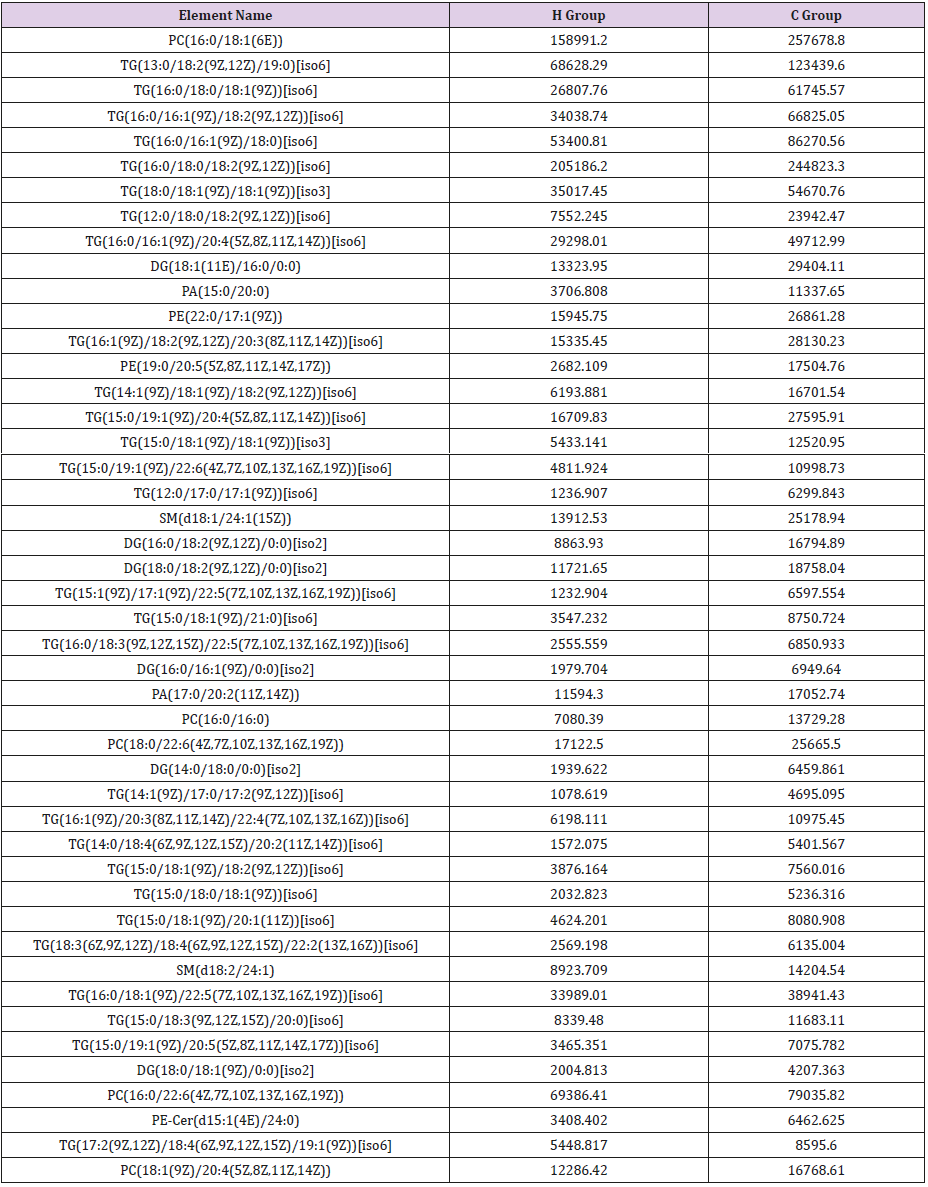
Table 4: Elevated 46 elements in the C group compared with H group (unit: intensity).
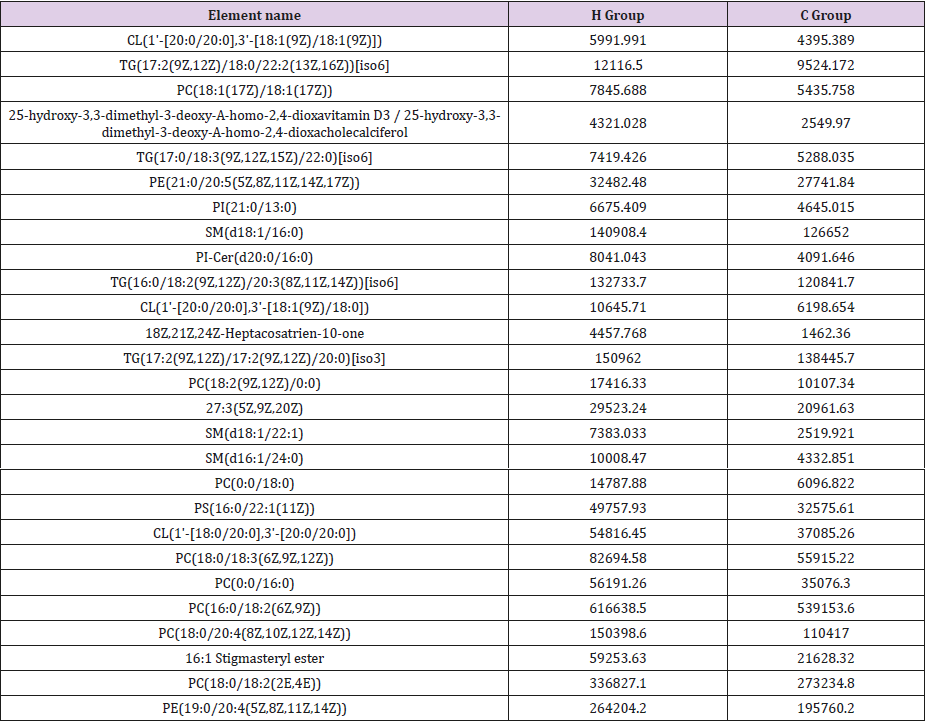
Table 5: Reduced 27 elements in the C group compared with H group (unit: intensity).
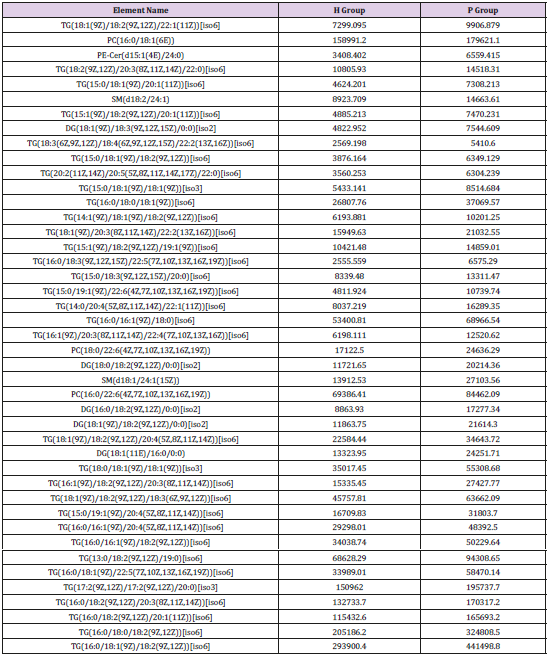
Table 6: Elevated 43 elements in the P group compared with H group (unit: intensity).
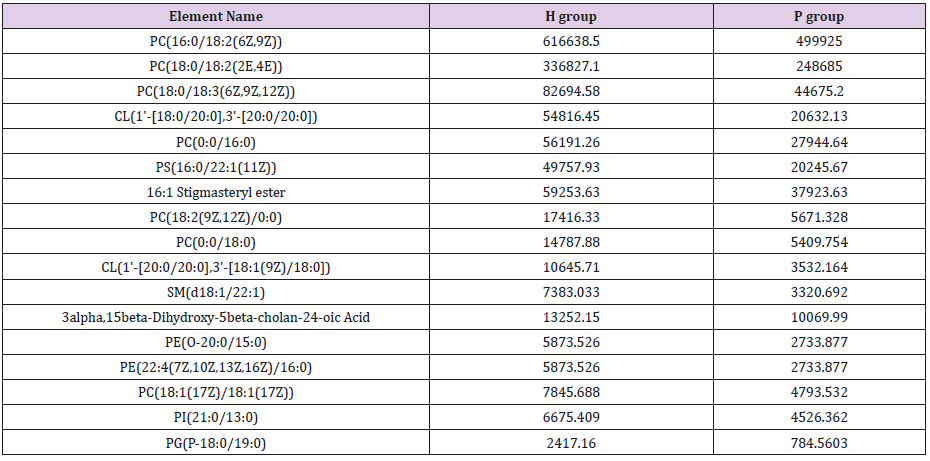
Table 7: Reduced 17 elements in the P group compared with H group (unit: intensity).
Discussion
PDAC is a tremendous systemic disease which contributes to the high fatality rate in affected patients [11-13]. Therefore, biomarkers for PDAC early detection and distinguishing PDAC and CP are important [5-8]. Our data clearly demonstrated different lipid profiles with different deregulated lipid elements in the patient’s groups tested. These lipid profiles might be biomarkers to define healthy or pathological pancreas condition after careful clinical validation. PA attracts our more attention, because it only elevated in C group compared with H group,thus make PA some specificities might be useful to classify CP and PDAC. There are 3 pathways to produce PA [14]: (1) Phospholipase D hydrolyzes phosphatidylcholine into PA and choline, (2) lysoPA-acyltransferase converts lysophosphatidic acid into PA, and (3) diacylglycerol kinase phosphorylates diacylglycerol into PA. Also, PA could be conversely catalyzed by phospholipase A into lysophosphatidate. It has been reported that autotaxin/lysophosphatidate signaling axis places multiple key roles in tumorigenesis, proliferation, invasion, metastasis of PDAC [15]. However, the role of PA in CP needs further investigation. Interestingly, a cross point of C and P groups was identified by two TG elements which are reduced in C group but elevated in P group: TG(16:0/18:2(9Z,12Z)/20:3(8Z,11Z,14Z))[iso6] and TG(17:2(9Z ,12Z)/17:2(9Z,12Z)/20:0)[iso3]. These substances provide a new opportunity to discriminate CP and PDAC. These two TG elements could be components of very-low-density lipoprotein (VLDL) and chylomicrons [16]. Indeed, Fan et al. reported that VLDL level is higher in PDAC patients and lower in CP patients [10], which is in line with our findings. Also, Ulmer et al. found a statistically significant positive association between the amount of serum TG and the risk of cancers in the colon, respiratory tract, kidney, and skin [17]. However, the specifying of the TG found in this study needs to be done in future. To the best of our knowledge, this is the first study reporting elevation and diminishment of PA and TG in patients with different pancreatic diseases.
Conclusion
Our research revealed the plasma lipid profile in healthy individuals and patients with CP and PDAC. Altered lipid level provides new possibilities of lipid biomarker pool for pancreas disease detection, surveillance and to distinguish CP and PDAC.
Funding
This work was supported by Project 162102410006, Department of Science and Technology of Henan Province, People’s Republic of China. Project 201702139 and 2017049, Health Commission of Henan province, People’s Republic of China.
Conflict of Interest
The authors declare that they have no conflict of interest.
References
- Witkowski ER, Smith JK, Tseng JF (2013) Outcomes following resection of pancreatic cancer. J Surg Oncol pp. 10797-103.
- Hartwig W, Werner J, Jager D, Debus J, Buchler MW (2013) Improvement of surgical results for pancreatic cancer. Lancet Oncol 14: e476-485.
- Malka D, Hammel P, Maire F, Rufat P, Madeira I, et al. (2002) Risk of pancreatic adenocarcinoma in chronic pancreatitis. Gut 51(6): 849-852.
- Jimeno A, Hidalgo M (2006) Molecular biomarkers: their increasing role in the diagnosis, characterization, and therapy guidance in pancreatic cancer. Mol Cancer Ther 5(4): 787-796.
- Gonda TA, Saif MW (2011) Early detection and screening of pancreatic cancer. Highlights from the "2011 ASCO Gastrointestinal Cancers Symposium".
- Sarnecka AK, Zagozda M, Durlik M (2016) An Overview of Genetic Changes and Risk of Pancreatic Ductal Adenocarcinoma. J Cancer 7(2): 2045-2051.
- Tumas J, Kvederaviciute K, Petrulionis M, Kurlinkus B, Rimkus A, et al. (2016) Metabolomics in pancreatic cancer biomarkers research 33(12): 133.
- Huang J, Liu J, Chen Xiao K, Zhang X, Lee WN, et al. (2016) Advance in microRNA as a potential biomarker for early detection of pancreatic cancer. Biomark Res 4: 20.
- Nishiumi S, Suzuki M, Kobayashi T, Matsubara A, Azuma T (2014) Metabolomics for biomarker discovery in gastroenterological cancer. Metabolites 4(3): 547-571.
- Zhang L, Jin H, Guo X, Yang Z, Zhao L, et al. (2012) Distinguishing pancreatic cancer from chronic pancreatitis and healthy individuals by (1)H nuclear magnetic resonance-based metabonomic profiles. Clin Biochem 45(1): 1064-1069.
- Gnerlich JL, Luka SR, Deshpande AD, Dubray BJ, Weir JS (2012) Microscopic margins and patterns of treatment failure in resected pancreatic adenocarcinoma. Arch Surg 147: 753-760.
- Lacobuzio Donahue CA, B Fu, Yachida S, Luo M, Abe H (2009) DPC4 gene status of the primary carcinoma correlates with patterns of failure in patients with pancreatic cancer. J Clin Oncol 27(11): 1806-1813.
- Hishinuma S, Ogata Y, Tomikawa M, Ozawa I, Hirabayashi K (2006) Patterns of recurrence after curative resection of pancreatic cancer, based on autopsy findings. J Gastrointest Surg 10(4): 511-518.
- Bruntz RC, Lindsley CW, Brown HA (2014) Phospholipase D signaling pathways and phosphatidic acid as therapeutic targets in cancer. Pharmacol Rev 66: 1033-1079.
- Quan M, Cui JJ, Feng X, Huang Q (2017) The critical role and potential target of the autotaxin/lysophosphatidate axis in pancreatic cancer. Tumour Biol.
- Drummond KE, Brefere LM (2014) Nutrition for Foodservice and Culinary Professionals. (8th )., John Wiley & Sons, USA.
- Borena W, Stocks T, Jonsson H, Strohmaier S, Nagel G, et al. (2011) Serum triglycerides and cancer risk in the metabolic syndrome and cancer (Me-Can) collaborative study. Cancer Causes Control 22(2): 291-299.
