 Mini Review
Abstract
Heathers and his colleagues have proposed a variety of tests to detect inconsistencies in research data, including the GRIM, SPRITE, DEBIT, and RIVETS tests. Binary data are common in social science research, for such variables as male/female, rural/urban, white/nonwhite, or college educated/not college educated. However, the standard deviation for binary data is a direct mathematical function of the mean score. We show how standard deviations vary as a function of the mean and how the maximum possible standard deviation varies as a function of sample size for a mean of .50. Implications for detecting fraudulent data are discussed.
Introduction
There appears to be increasing pressure on academic scholars to publish more often, even at lower ranks [1]. Such pressure may lead to an increase in the number of scholarly articles that report falsified data, which can lead to articles being retracted. What are editors, reviewers, and scholars to do? Several tests for fraudulent data have been proposed, such as the GRIM test [2], the GRIMMER test [3], the SPRITE test [4], and the RIVETS test [5]. Here we limit our discussion to the use of binary data anomalies for detecting data errors. In 2018, we pointed toward a way for checking the validity of binary data, checking whether standard deviations (SD) from binary data fit what would have been predicted by their mean scores [6:786]. We noted that standard deviations for binary variables in large samples should seldom exceed 0.55, so if an article reported a standard deviation of 0.71, it would have to be an error, either a typographical error or possibly falsified data. We included a formula for predicting the standard deviation from the mean, for binary variables (e.g., 0 and 1 being the only possible values) [6].
More recently, Heathers & Brown [7] have proposed a DEBIT test along the same lines. They report the same formula as the square root of [N/(N-1) times m(1–m)] where m is the mean of the binary data and N represents the sample size. Data that do not fit the expected pattern might indicate rounding errors, unreported missing data, or as Heathers and Brown [5] call it, “altered” data. It is possible that means were reported incorrectly or that standard deviations were reported incorrectly, or both. It is possible that sample sizes were reported incorrectly. They noted that standard deviations from grouped data might not fit the mean/SD pattern for the whole sample. Thus, issues are raised with respect to the analysis of multi-level data (e.g., hierarchical linear modeling techniques) which includes individual level variables as well as group level variables. Until further research is done with respect to such group-level data, the best data for checking binary patterns would be that data reported for entire samples at the individual level.
Using a sample size of ten, Figure 1 shows the pattern that would result for standard deviations as a function of their mean scores, using only binary data. The resulting pattern is symmetric around a mean of 0.50, with a maximum standard deviation value of 0.5270 and a minimum value of zero, when the mean equals either zero or one. As sample size increases the general pattern remains the same but the maximum standard deviation will trend towards 0.50 as shown in Figure 2. While not shown in Figure 2, the standard deviations continue to approach 0.50 as sample sizes increase (e.g., N = 200, SD = .0513; N = 500, SD = .5005; N = 1,000, SD = .5003; N = 5,000, SD = .5000). There will always be more complicated ways to assess scientific issues, but we are trying to find simpler approaches that can be useful for a wider range of scholars [8-9]. Heathers and Brown [7] have suggested that standard deviations might differ between grouped and individual data; therefore, our discussion will focus on results for individual level data [10].
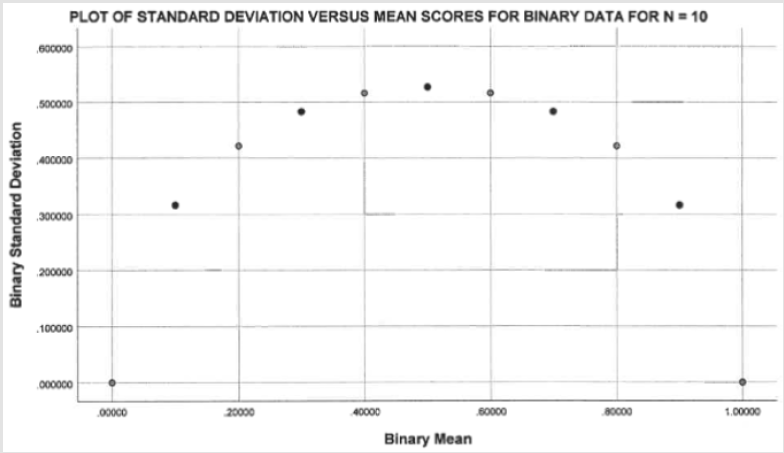
Figure 1.
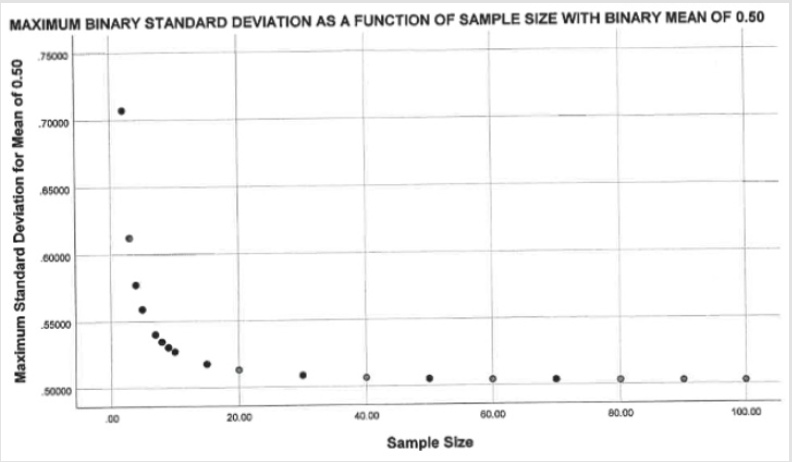
Figure 2.
For example, Regnerus [10:757-758] reported standard deviations for binary variables that were larger than 0.70. If his sample size had been N = 2, that might have been possible, but his sample size was nearly 3,000. Since only two of his forty binary variables featured such large standard deviations, it is most likely that those reports represented typographical errors [6:786]. However, if a much larger percentage of data points (e.g., 20 of 30 cases) were impossible binary data points, falling above or below the correct pattern as shown in Figure 1 for the study’s particular sample size, then one might suspect that the data were made up, i.e. fake. Substantial levels of such incorrect data in an article might lead eventually, after more careful investigation, to its retraction. Binary testing will not catch fraud in which a researcher merely doubles or triples the number of cases in order to create a larger sample size. Astute cheaters might revise their binary standard deviations to make them more reasonable, even though that would take some time.
Fraudulent researchers may choose to only report mean scores or basic percentages without reporting standard deviations, in order to not permit anyone to detect problems with standard deviations. Other approaches to testing for fraudulent data are possible but not the focus of this report. On the positive side, binary testing is not limited by sample size. As sample size increases, the formula approaches the square root of [m(1–m)]. Data points can be plotted easily to see if they conform to the expected curve of means versus standard deviations. The plots can be examined to see if similar mean scores feature widely different standard deviations even though similar mean scores should feature similar standard deviations. Heathers and Brown [7] have proposed more specific ways to test each data point against its expected value in the binary plot; however, our visual approach may be easier for the average scientist. Furthermore, for any given sample size, there will be one and only one correct standard deviation for each mean score, so there is no need to be concerned with confidence intervals around the expected standard deviations, if the sample size is known.
References
- Warren John Robert (2019) How much do you have to publish to get a job in a top sociology department? Or to get tenure? Trends over a generation. Sociological Science 6: 172-196.
- Brown Nicholas, James Heathers (2017) The GRIM test: A simple technique detects numerous anomalies in the reporting of results in psychology. Social Psychological and Personality Research 8(4): 363-369.
- Anaya Jordan (2016) The GRIMMER test: A method for testing the validity of reported measures of variability. Peer J Preprints 4: e2400v1.
- Heathers A James, Jordan Anaya, Timothy van der Zee, Brown, et al. (2018) Recovering data from summary statistics: Sample parameter reconstruction via iterative techniques (SPRITE). Peerj Preprints: 1-17.
- Brown Nicholas, James Heathers (2019) Rounded input variables, exact test statistics (RIVETS): A technique for detecting hand calculated results in published research. PsyArXiv Preprints: 1-13.
- Schumm, Walter, Duane Crawford, Michael Higgins, Lorenza Lockett, et al. (2018) Estimating the standard deviation from the range: A replication of analysis of demographic data reported in Marriage & Family Review, 2016-2017. Marriage & Family Review 54(8): 777-792.
- Heathers James, Brown Nicholas (2019) DEBIT: A simple consistency test for binary data.
- Unpublished paper, Bouve College of Health Sciences, Northeastern University, 360 Huntington Avenue, Boston, MA 02115.
- Schumm Walter (2018) Making sense of probability: What formulas to use under different conditions. Biomed J Sci & Tech Res 3(1): 2983-2984.
- Schumm Walter, Duane Crawford (2019) Scientific consensus on whether LGBTQ parents are more likely (or not) to have LGBTQ children: An analysis of 72 social science reviews of the literature published between 2001 and 2017. Journal of International Women’s Studies 20(7): 1-12.
- Regnerus Mark (2012) How different are the adult children of parents who have same-sex relationships? Findings from the New Family Structures Study. Social Science Research 41(4): 752-770.
