Abstract
Honey is potentially useful source of dietary antioxidants which can be used as medicinal purposes. Honey is a product which is result from nectar of flowers. The majority of honey is sugar which is bonded with antioxidant components. The physicochemical parameters of eight Iranian honey samples from different botanical origins were characterized in this study. Differences in their pH, moisture, sugar, and phenolic profiles were observed. Different Iranian honeys contain different carbohydrate compositions. The relationship between different parameters, such as phenolic concentration, color, antioxidant properties, moisture content, and Hydroxymethylfurfural (HMF) content were established. High correlations between total phenolic content and radical scavenging properties, moisture content and antioxidant properties were observed for all of the samples. The correlation between HMF content and honey color was also observed in the eight types of honey. A high positive correlation was found between the two assays used to measure the antioxidant activity of honey and its total phenolic content, indicating the major contribution of phenolic to the antioxidant activity of honey, although there may be other minor factors involved. There was a linear correlation between the water content of honeys and their antioxidant activities. The values of antioxidant activity and phenolic content differed amongst the honey samples, which may reflect their different floral sources. Physicochemical properties are vital to find pure honey which can be used in medicine. The correlation between these properties with antioxidant capacities is a simple way to understand honey purity.
Keywords: Chromatography; Phenolics; Purity; Physicochemical
Introduction
Honey is a common natural sweetener that is found worldwide. It is obtained from honeybees, which process the nectar of flowers or the secretions of living parts of plants. The floral source used by bees is the main variable that determines the composition of the honey they produce [1], and therefore the chemical composition of honey is also often related to the geographical area of production. Other factors that may affect honey during processing by humans include the addition of enzymes and the reduction of water content. It is also important that honey is stored in clean, dry conditions at an appropriate temperature and humidity level. Bee honey is one of the few virtually totally non-allergenic foods that the human body can easily assimilate. It contains many nutrients and is a good energy provider [2], since it is rich in carbohydrates (80–85%), and honey sugars are as easily digestible as those found in many fruits [3]. Bogdanov et al. (2004) found more than twenty sugars present in honey, with fructose and glucose being the major ones [4,5]. Furthermore, the sum of the fructose and glucose content, the fructose: glucose ratio, and the glucose: water ratio are other important factors related to honey quality.
The fructose: glucose ratio indicates the ability of honey to crystallize [3-8]. Honey contains more than 200 substances, including amino acids, enzymes, proteins, vitamins, minerals, ash, organic acids, and phenol compounds. The moisture content of bee honey is of major importance for its resistance to fermentation and granulation, since low moisture content protects honey from microbiological activity [8-10]. The combination of organic acids, water, and sugars can lead to the formation of furanic aldehydes, the most important of which in food products is 5-hydroxymethyl-2-furfural- dehyde (HMF) [11]. Furanic aldehydes are usually formed via one of two pathways: the Maillard reaction [12],or the dehydration of hexoses catalyzed by acid [13]. The concentration of HMF in food is related to its quality and freshness, being virtually absent in fresh and untreated food, with increasing concentrations occurring as a result of thermal treatment and longer storage times [11]. Other parameters linked to honey freshness or quality include its colour and its diastase index [12-14]. Therefore, understanding the chemical and physical characteristics of honey is necessary in order to evaluate the quality of the sweetener or to detect the presence of adulterants. It is important to understand the physicochemical properties of honey if its quality is to be determined [15], which is what the work reported here sets out to do.
Materials & Methods
Preparation of Honey Samples
In this study eight honey samples, from different seasons, were initially harvested from the northeast region of Iran. If any foreign matter, such as wax, sticks, bees, or particles of comb were present in the honey it was heated to 40˚C in a water-bath then strained through cheesecloth before sampling. If the samples were free from granulation, they were mixed thoroughly by stirring or shaking; if they were granulated, they were placed in closed containers in a water-bath and heated for 30 minutes at 60˚C until the granules melted. The temperature was increased to 65˚C if necessary. Occasional shaking was required during the heating process. A Gallenkamp model IH-1 50 incubators were used to control the incubation conditions. The temperature of the incubator was electronically controlled and verified against a calibrated thermometer. The eight samples were taken to represent the best honey available from one region. They were subsequently analysed to determine their sugar content, using standards accepted by both the Iranian and Malaysian standardization departments, and following the Codex Alimentarius standards.
Analysis Methods
The pH of the honey was measured using a pH meter (Accumet® 950 pH/ion Meter).The protocol used to measure moisture content for this study was based on the refractometric method of Bogdanov [16].The method used to analyse the Hydroxymethylfurfural (HMF) content was based on the original work [17]. The HMF content, expressed in mg/kg of sample, was calculated using the following formula:

The percentage sugar content of the honey samples was determined in two ways. The first used gas Chromatography (GC) method, adapted from Doner (1977) with some modifications (18). The second method used High Performance Liquid Chromatography (HPLC) to analyse the sugar profile of the honey samples according to Bogdanov and Baumann’s method [19].
Total Phenolic Content and Antioxidant Activities
The total phenolic content of the honey samples was estimated by a colourimetric method based on the Folin-Ciocalteu assay. To determine the antioxidant activity of the samples, a spectrophotometric DPPH (2,2-diphenyl-1-picrylhydrazyl) free radical scavenging assay was used [20,21]. The antiradical activity (ARA) of honey was expressed as percentage inhibition of DPPH radicals by the honey and was calculated as follows:

AB = Absorbance of DPPH radical blank, AT = Absorbance of test sample with DPPH radical Determination of the total antioxidant power of honey was carried out by a ferric reducing/antioxidant power (FRAP) assay [21].
Colour Intensity: ABS450
The net absorbance of the honey samples was determined using the method of Beretta et al. [22]. The honey samples were diluted to 50% (w/v) with warm (45-50ºC) Milli-Q TM water and the solution was filtered through a 0.45μm filter. The absorbance was measured using a spectrophotometer at 450 and 720nm and the difference in absorbance was expressed as absorbance units (Au) [22].
Statistical Analysis
Data were analyzed using the SPSS and SAS computer software packages (INC., 1985). A complete random design was used. Arcsine transformation of all percentage and ratio data before ANOVA analysis was done in order to normalize the data.
Results & Discussion
Physicochemical Properties of the Honey Samples
Analysis of pH Values: All of the honey samples had weak acidic properties, with pH values ranging from 3.14 to 4.95. In general, honey is acidic in nature, regardless of its geographical origin. Honey generally tastes like weak acid. Acids in honey represent less than 0.5 percent of its total composition. The level of acidity not only contributes to its taste but is also responsible for the stability of honey against various microorganisms. It has been reported that the high acidity of honey is caused by the fermentation of sugar into organic acids, which are thought to be responsible for honey’s flavour and stability against microbial spoilage [16]. Various organic acids have been characterized in honey, of which gluconic acid is the most important. Other acids present in honey are formic, acetic, butyric, lactic, oxalic, tartaric, maleic, succinic, pyruvic, pyroglutamic, α-ketoglutaric glycolic, citric and malic acids [23,24].
Analysis of Moisture Content
Water content is a good criterion with which to establish the quality of honey(based on the Codex Alimentarius standards for honey, which state that water content must not be more than 20%). For the honey samples tested here, water content values of between 17.1g/100g (saffron honey) and 19.8 g /100 g (citrus honey) were obtained. In addition to honey number 4, the other five honey samples with a high moisture content were honey numbers 5, 2, 3, 6 and 8, with moisture contents of 18.1%, 18.3%, 18.7%, 19.2%, 19.5% and 19.6%, respectively. The moisture content of honey depends on various factors, such as the harvesting season, the degree of honey maturity in the hive, and climatic factors [25]. Low moisture content has been reported to be advantageous, as it can promote a longer shelf life during storage [23].
Analysis of Hydroxymethylfurfural (Hmf) Content
The HMF content was shown to be highest in berberis honey, with a value of 0.78± 0.37 mg/kg, andlowest in citrus honey, which contained 0.011± 3.6 mg/kg HMF (Table 1). HMF is an important indicator of honey purity, as HMF content is widely recognized as a parameter that indicates the freshness of honey [24]. High concentrations of HMF in honey are an indicator of overheating and storage in poor conditions. According to the Codex Alimentarius Commission honey standards [16], the HMF concentration in honey should not exceed 60g/100g. Aside from storage conditions, such as temperature, the age of honey and floral sources can also influence HMF levels [24-26]. It has been reported that HMF concentrations in honey stored for longer periods (12 – 24 months) increased to levels that exceed those considered suitable and safe for human consumption [27]. The low levels of HMF in the selected Iranian honeys indicate their freshness and lack of exposure to extreme heat.
Characterization of Sugar Profiles in Honey Samples Using Gas Chromatography (Gc) and High-Performance Liquid Chromatography (HPLC)
All of the samples contained a very high percentage of sugars (75%), which was to be expected since these compounds are the most abundant nutrients found in honey [14]. No significant statistical differences between the sugar content in each of the honey samples were observed. The fructose, glucose, sucrose and maltose contents of the honey samples were analyzed using both GC and HPLC. The proportions of these sugars, along with the fructose: glucose (F:G) ratio found in each honey sample, are presented in Table 2. Fructose was the main sugar found in all eight of the honey samples, followed by glucose, maltose and sucrose. There were differences between the results of the sugar content as measured using GC compared with HPLC (Table 2). Generally, honeys with a high fructose content are sweeter compared to those with a high glucose content. A higher fructose content will increase the fructose: glucose ratio of a honey, making it more than one. This is taken to be an indicator of a good quality honey, and it also reduces a honey’s tendency to granulate. In this study, it was assumed that sugars could ionize better during GC than during HPLC. Therefore, the differences in sugar content seen between the GC and HPLC methods could be due to differences in the polarity of the sugars. Generally, GC is more reliable for analysis of polar compounds like sugars, whereas HPLC is better for non-polar compounds.
Table 2: The proportion of sugars and the fructose:glucose (F:G) ratio in eight selected honey samples,as measured using Gas Chromatography(GC) and High Performance Liquid Chromatography (HPLC).
Honey Color
The color of honey is one of the characteristics that serve to indicate the plant source. In this study, the color of the honey samples ranged from light yellow (citrus honey = 0.430 Au), yellow (sunflower honey = 0.456 Au), through orange (thyme honey = 0.479Au), light red (polyfloral honey = 0.570Au), red (vulgare honey = 0.681Au), red-brown (berberis honey = 0.695Au), light brown (tamarix honey = 0.836Au) and dark brown (saffron honey = 0.972Au). Other researchers have found that dark-coloured honeys have a higher total phenolic content and consequently a higher antioxidant capacity [22-28].
Physicochemical Properties of the Honey Samples
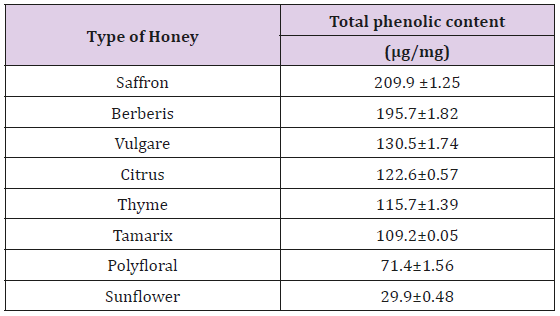
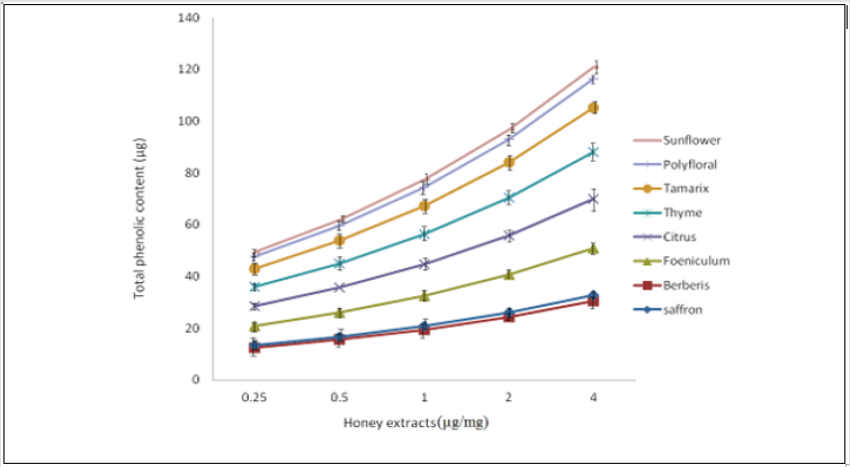
Determination of Total Phenolic Content: Of the Iranian honey samples tested, the total phenolic content of saffron honey was found to be the highest, with a value of 2.09 ±0.25 μg/mg, which differs significantly in comparison with the other types of Iranian honeys tested (P <0.001) (Table 3). Sunflower honey showed the lowest total phenolic content (0.29±0.48 μg/mg). A linear relationship existed between extract concentrations and their total phenolic content (Figure 1).
Figure 1: Total phenolic content of the ethyl acetate extracts of honey. Determination was carried out using the Folin-Ciocalteu reagent procedure and calculated from a standard gallic acid graph.
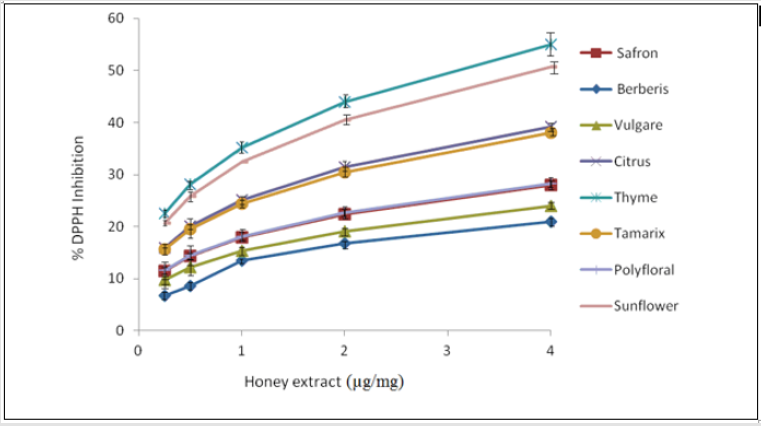
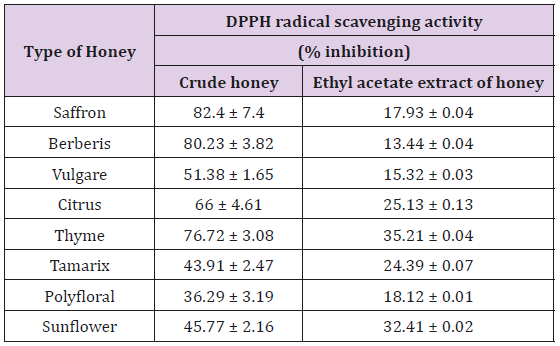
Determination of the Dpph Radical-Scavenging Activity of Honey (DpphAssay): In this study, different honeys showed different antioxidant activities, depending on their botanical sources, which is in agreement with earlier studies [29]. The highest DPPH radical scavenging activity was seen in saffron honey, with a percentage inhibition of 82.4 ± 7.4%, whereas the lowest was in the polyfloral honey (36.29 ± 1.9%) (Table 4). However, following the liquid-liquid extraction, there was a significant loss of DPPH radical scavenging activities. In this instance, the thyme honey extract showed the highest DPPH radical scavenging activity (35.21 ± 0.04%), while the lowest was seen in the berberis honey extract (13.44 ± 0.04%) (Table 4). This implies that antioxidants responsible for the DPPH radical scavenging activities of honey are not only present in the ethyl acetate extract. Each crude honey sample and honey extract had specific DPPH radical scavenging capacities. The dose– response curves of the DPPH radical scavenging activities of the honey extracts are shown in Figure 2. Reducing substances, such as some sugars and amino acids, may interfere with the antioxidant activity of honey [30]. In fact, honey samples contain some of these compounds, as well as other antioxidants that can lead to an increase in absorbance values and to positive errors in the determination of phenolics by the Folin-Ciocalteu method. From the analysis of (Table 4) we can also conclude that darkhoney contains the highest concentrations of other antioxidants, such as flavonoids (587.42mg/kg), ascorbic acid (145.80mg/kg) and beta-carotene (9.49mg/kg), which can also contribute to the better antioxidant properties observed in these samples.
Figure 2: Dose-response curves for the DPPH radical scavenging activity of the ethyl acetate extracts of the honey samples.
Table 3: The DPPH radical scavenging activities of crude honey and ethyl acetate extracts of honey samples.
Determination of the Total Antioxidant Power of Honey (Frap Assay): Different honeys showed different antioxidant activities in this study, which were dependent on their botanical sources [22]. The average FRAP values of the crude honey extracts ranged from 309.7 ± 24.1μM in sunflower honey, to 1247.5 ± 13.5μM in saffron honey. Following extraction with ethyl acetate, there was a significant loss of ferric reducing activities (from 31.67 ± 14.2μM in sunflower honey to 82.22 ± 9.7μM in saffron honey). This again implies that antioxidants responsible for the antioxidant activities of honey are not only present in the ethyl acetate extract.
A highly positive correlation was found between two parameters, which were the antioxidant activities of the honeys, and their phenolic contents, indicating the important role of phenolics in the antioxidant activity of honey. Therefore, a strong positive correlation was seen between DPPH radical scavenging activities and the total phenolic content of the honey samples. A moderately strong positive correlation was observed between FRAP and total phenolic content, providing further support for the contribution that polyphenols make in providing antioxidant activities.
Conclusion
Honey is potentially useful source of dietary antioxidants. All of the selected Iranian honeys that were sampled and tested showed the presence of antioxidant activities.
Acknowledgement
I would like to sincerely thank Professor Kamaruddin Mohd
Yusof.
This research does not contain any studies with human or
animal subjects.
Conflicts of Interest
The authors declare no conflicting or financial disclosures.
References
- Anklam E (1998) A review of the analytical methods to determine the geographical and botanical origin of honey. Food Chem 63(4): 549-562.
- Rahman MM, Allan R, Azirun MS (2010) Antibacterial activity of propolis and honey against Staphylococcus aureus and Escherichia Coli. Afr J Microbiol Res 4(16): 1872-1878.
- White JW, Doner LW (1980) Honey Composition and Properties: Beekeeping in the United States. Agric Handbook No. 335, p. 82-91.
- Bogdanov S, Rouff K, Oddo LP (2004) Physico-chemical methods for the characterization of unifloral honey: a review. Apidologie 35 (4): 275-282.
- Zafar A, Safdar M, Siddiqui N, Mumtaz A, Hameed T, et al. (2008) Chemical analysis and sensory evaluation of branded honey collected from Islamabad and Rawalpindi market. J Agric Res 2: 86-91.
- Manikis I, Thrasivoulou A (2001) Relation of physicochemical characteristics of honey and the crystallization sensitive parameters. Apiacta 36: 106-112.
- Kaškonienėa V, Venskutonis PR, Ceksteryt V (2010) Carbohydrate composition and electrical conductivity of different origin honeys from Lithuania. LWT-Food Sci Technol 43: 801-807.
- Buba F, Gidado A, Shugaba A (2013) Analysis of biochemical composition of honey samples from North-East Nigeria. Biochem Anal Biochem 2(3): 139.
- Akhtar S, Ali J, Javed B, Hassan S, Abbas S, et al. (2014) Comparative physicochemical analysis of imported and locally produced Khyber Pakhtunkhwa honey. Global J Biotechnol Biochem 9 (3): 55-59.
- EL-Metwally AAE (2015) Factors Affecting the Physical and Chemical Characteristics of Egyptian Bee honey. Ph. D. Thesis, Fac Agric Cairo Univ pp. 320.
- Petretto GL, Tuberoso CIG, Vlahopoulou G, Atzei A, Mannu A, et al. (2016) Volatiles, color characteristics and other physico-chemical parameters of commercial Moroccan honeys. Nat Prod Res 30(3): 286-292.
- Martins SIFS, Jongen WMF (2000) A review of Maillard reaction in food and implications to kinetic modelling. Trends Food Sci Technol 11: 364-373.
- Beliz HD, Grosh W (1999) Food chem Berlin: Springer-Verlag Press.
- Mendes E, Brojo proenca E, Ferreira IMPLVO, Ferreira MA (1998) Quality evaluation of Portuguese honey. Carbohydr Polymers 37(3): 219-223.
- Cordella C, Moussa I, Martel A, Sbirrazzuoli N, Lizzani-Cuvelier L (2002) Recent developments in food characterization and adulteration detection: Technique-oriented perspectives. J Agric Food Chem 50: 1751-1764.
- Bogdanov S (2009) Book of honey: honey composition, Bee product science p. 1-9.
- White DC, Davis WM, Nickel JS, King JD, Bobbie RJ (1979) Determination of the sedimentary microbial biomass by extractible lipid phosphate. Oecologia 40(1): 51-62.
- Doner LW (1977) The sugars of honey-A review. J Sci Food Agric 28(5): 443-456.
- Bogdanov S, Baumann E (1988) Determination of sugar composition of honeys by HPLC. Mitt Geb Lebensm Hyg 79: 198-206.
- Chen L, Mehta A, Berenbaum M, Zangerl AR, Engeseth NJ (2000) Honeys from different floral sources as inhibitors of enzymatic browning in fruit and vegetable homogenates. J Agric Food Chem 48(10): 4997-5000.
- Almahdi AM, Kamaruddin MY (2004) Evaluation of the phenolic contents and antioxidant capacities of two Malaysian floral honeys. Food Chem 85(4): 513-518.
- Beretta G, Granata P, Ferrero M, Orioli M, Roberto MF (2005) Standardization of antioxidant properties of honey by a combination of spectrophotometric/fluorimetric assays and chemometrics. Analytica Chimica Acta 533(2): 185-191.
- Fallico B, Zappala M, Arena E, Verzera A (2004) Effects of conditioning on HMF content in unifloral honeys. Food Chem 85(2): 305-313.
- Terrab A, Dez MJ, Heredia FJ (2002) Characterisation of Moroccan unifloral honeys by their physicochemical characteristics. Food Chem 79(3): 373-379.
- Chirife J, Zamora MC, Motto A (2006) The correlation between water activity and % moisture in honey: Fundamental aspects and application to Argentine honeys. J Food Eng 72(3): 287-292.
- Silva LR, Videira R, Monteiro AP, Valentao P, Andrade PB (2009) Honey from Luso region (Portugal): Physicochemical characteristics and mineral contents. Microchem J 93(1): 73-77.
- Khalil MI, Sulaiman SA, Gan SH (2010) High 5-hydroxymethylfurfural concentrations are found in Malaysian honey samples stored for more than one year. Food Chem Toxicol 48(8-9): 2388-2392.
- Frankel S, Robinson GE, Berenbaum MR (1998) Antioxidant capacity and correlated characteristics of 14 unifloral honeys. J Apicultural Res 37(1): 27-31.
- Bogdanov S, Jurendic T, Sieber R, Gallmann P (2008) Honey for Nutrition and Health: A Review. J Am College Nutr 27(6): 677-689.
- Ouchemoukh S, Loualiche H, Schweitzer P (2007) Physicochemical characteristics and pollen spectrum of some Algerian honeys. Food Control 18(1): 52-58.

 Research Article


