 Research Article
Abstract
There are generally accepted risk factors for fatal CVD: age, gender, smoking, systolic BP, lipid factors and residence. Since 1971 CVD (mortality) has been reduced exponentially in the Finnish whole population, but time-related changes in the CVD subtypes (CVD.s) [CHD, other cardiac (Card.o), Cerebro-Vascular (Vasc.cbr) and other vascular (Vasc.o)] have been different. Area-related relative CHD (mortality) (CHD.i/CHD.mean) has been rather stable during 1964-83. This study is assessing regional (CVD.s) proportions of total mortality (CVD.s/Tot) in 1969-2016 and area-related associations in (CVD.s/Tot)’s between periods 1969-1992 “(69-92)” and 1993-2016 “(93-16)”, as well as area-related associations of (CHD/Tot) with (CVD.s/Tot)’s during the period 1969-2016. The data are from Statistics Finland.
Results (ns: non-significant; *: p < 0.05; **: p < 0.01; ***: p < 0.001): Between periods (69-92) and (93-16) the highest relative change occurred in (Card.o/Tot) (42 %), lowest in (CHD/Tot) (13 %). Inter-regional stability: Regional variation of (CVD.s/ Tot).(93-16) was explained by (regressions of) their respective values of “(69-92)” as follows: (CHD/Tot) by 74.2 % ***, (Card.o/Tot) by 6.4 % (ns), (Vasc.cbr/Tot) by 52.0 % *** and (Vasc.o/Tot) by 71.6 %***. Variation of (CHD/Tot).(69-16)” was explained negatively by (Card.o/Tot).(69-16) (24.9 % *), (Vasc.cbr/Tot).(69-16) (20.5 %, p = 0.052) and (Vasc.o/Tot).(69-16) 59.4 %***.
Conclusions: (CVD.s/Tot)’s showed highly significant periodical inter-areal stability with exception of (Card.o/Tot) (ns). Inter-areal variation of (CHD/ Tot) explained significantly negatively (Card.o/Tot) and (Vasc.o/Tot) and nearly significantly (Vasc.cbr/ Tot). Obviously separate risk factors, as well as medical treatments, can work differently on different (CVD.s)’s. Continuation of regional analyses is needed.
Keywords: Regional; periodical; CHD; CVD; CVD subgroups
Abbreviations: (Card. o): other than Ischaemic Cardiac Disease/Mortality–Non- CHD Cardiac Disease/Mortality; CHD: Coronary Heart (Cardiac Ischaemic) Disease/ Mortality; Coefficient of Variation: SD/Mean; CVD: Cardio-Vascular Disease/ Mortality; (CVD.s): Subgroup of CVD; NS: Non-Significant; (*): p < 0.1; *: p < 0.05; **: p < 0.01; ***: p < 0.001; Tot: Total Mortality (of both genders); (Vasc.cbr): Cerebro- Vascular Disease/Mortality; (Vasc.o): other vascular than Cerebro-Vascular Disease/ Mortality.
Introduction
There are generally accepted risk factors for fatal CVD: age, gender, smoking, systolic BP, lipid factors and residence [1]. A plenty of efforts have been expended on reducing smoking, systolic BP and lipid values since 1972 [2] and medical treatments (which are not included in this survey). Nearly for five decades CVD (mortality) has been reduced exponentially in the Finnish whole population, but changes in the CVD subtypes (CVD.s) [CHD, other cardiac (Card.o), Cerebro-vascular (Vasc.cbr) and other vascular (Vasc.o)] have been different [3]. Proportional changes of CVD subgroups (CVD.s/CVD) have different: Before 2000 (CHD/CVD) increased, (Card.o/CVD) and (Vasc.o/CVD) decreased and (Vasc. cbr/Tot) was nearly unchanged. After 2000 (CHD/CVD) decreased, (Card.o/CVD) and (Vasc.o/CVD) increased and (Vasc.cbr (CVD) was nearly unchanged [3]. Inter-provincial relative CHD (mortality) (CHD.i/CHD.mean) has been rather stable during 1964-83 [4]. The aim of this article is to survey regional (CVD.s/Tot)’s and their area-related associations between periods 1969-1992 “(69-92)” and 1993- 2016 “(93-16)” as well as associations of (CHD/Tot).(69- 16) with other (CVD.s/Tot).(69-16)’s and (CVD.s/Tot).(69-16)´s in order to clarify the role of environmental factors (residence) in (CVD.s/Tot)’s and correlations between (CHD/Tot) and other (CVD.s/Tot)’s.
Materials and Methods
Data for this survey are in free access from Statistics Finland. [5]. Death groups selected are “01-54 Total”: “Tot”, “27-30 Diseases of the circulatory system excl. alcohol-related (I00-I425, I427-I99)”: “CVD”, “27 Ischaemic heart diseases (I20-I25)”: “CHD”, “28 Other heart diseases excl. rheumatic and alcohol-related (I30-I425, I427-I52)”: “Card.o”, “29 Cerebrovascular diseases (I60-I69)”: “Vasc. cbr” and “30 Other diseases of the circulatory system (I00-I15, I26-I28, I70-I99)”: “Vasc.o”. Because age-adjusted data were not available, this article is assessing the whole population of Finland without age-adjusting. Because of fluency (CVD/Tot) the sum of (CVD.s/Tot) is sometimes included in concept (CVD.s/Tot). (CVD.s/ Tot) proportions (%) have been obtained by dividing the respective Figures by Exel and multiplying the result by 100 (Table 1). After that periodical and inter-periodical parameters are computed (Tables 2-4). In calculations have been used program“IBM SPSS Statistics, Version 25”.
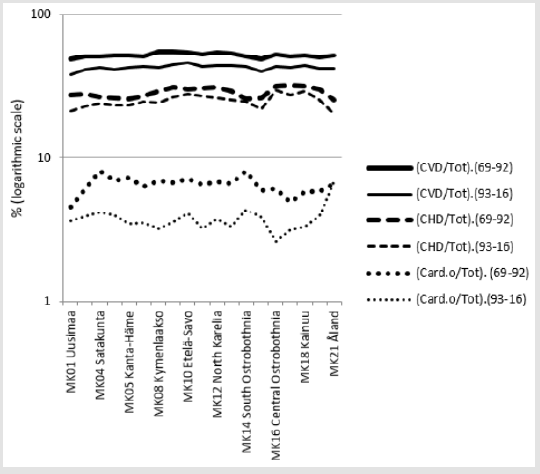
Figure 1: Variation of (CVD/Tot), (CHD/Tot) and (Card.o/Tot) in Finland, Mainland Finland and Finnish Regions during 1969-2016.
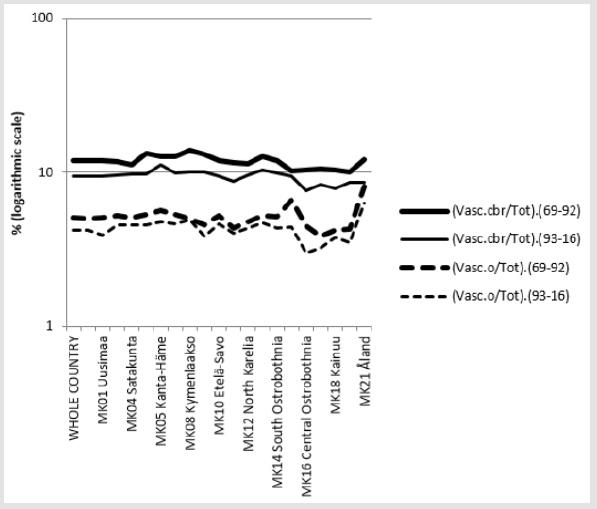
Figure 2: Variation of (Vasc.cbr/Tot) and (Vasc.o/Tot) in Finnish Regions during 1969-2016.
General observations: Table 2 shows that in 1969-2016 (CHD/Tot) constituted by its 27 %-units more than 50 % of (CVD/ Tot), which composed 47 % of Tot (earlier more than 50 %). The next largest group was (Vasc.cbr/Tot) by 10.6 %-units, then about equally (Card.o/Tot) by 5.2 %-units and (Vasc.o/Tot) by 4.7 %-units. The coefficient of variation of (CVD.s/Tot)’s was highest in (Vasc.o/Tot) (Table 2). Difference of periodical means of (CVD.s/ Tot)’s was highest in (CHD/Tot) by 3.7 %-units, but proportional changes were higher in (Card.o/Tot) (42.1 %), (Vasc.cbr/Tot) (20.2 %), (Vasc.o/Tot) (16 %) than in (CHD/Tot) (13 %) (Figures 1 & 2).
Variation of (CVD.s/Tot)’s between periods. Regional variation of (CVD/Tot).(93-16) and (CVD.s/Tot).(93-16) were explained by (regressions of) their respective values of “(69-93)” as follows: (CVD/Tot) by 57.3 %*** (Figure 3), (CHD/Tot) by 74.2 % *** (Figure 4), (Card.o/Tot) by 6.4 % (ns) (Figure 5), (Vasc.cbr/Tot) by 52.0 % *** (Figure. 6) and (Vasc.o/Tot) by 71.6 %*** (Figure 7). Association of (CHD/Tot) with other (CVD.s/ Tot)’s in 1969-2016: Table 4 shows R squares (%) of regressions of regional (CHD/Tot). (69-16) by (CVD/Tot).(69-16) and (CVD.s/Tot).(69-16)’s. In period 1969-2016 regional (CHD/Tot) was explained positively by (CVD/ Tot) (34.2 % **) and negatively by (Card.o/Tot) (24.9 %*), (Vasc. cbr/Tot) (20.5 %,p =0.052) and (Vasc.o/Tot) 59.4 %*** (Table 4 and Figure 8-11). Remarkable is that in Åland with the lowest (CHD/Tot) had high, even increasing, (Card.o/Tot) (Fig.1).
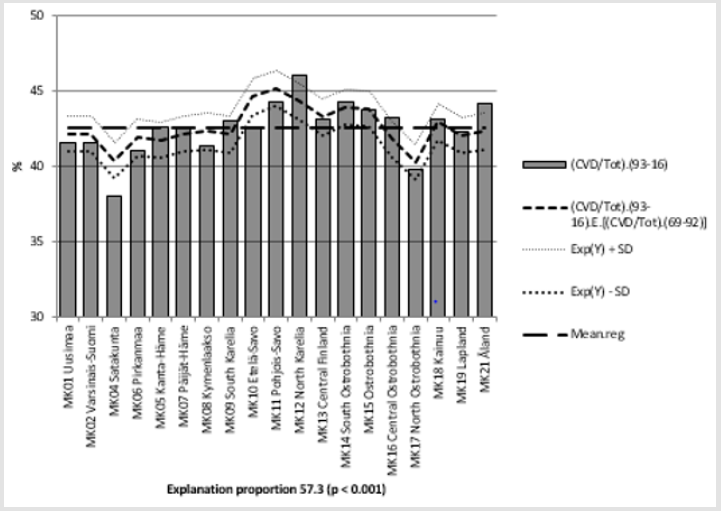
Figure 3: (CVD/Tot).(93-16) and its regression by (CVD/TOT). (69-92) and regional mean of (CVD/Tot). (93-16).
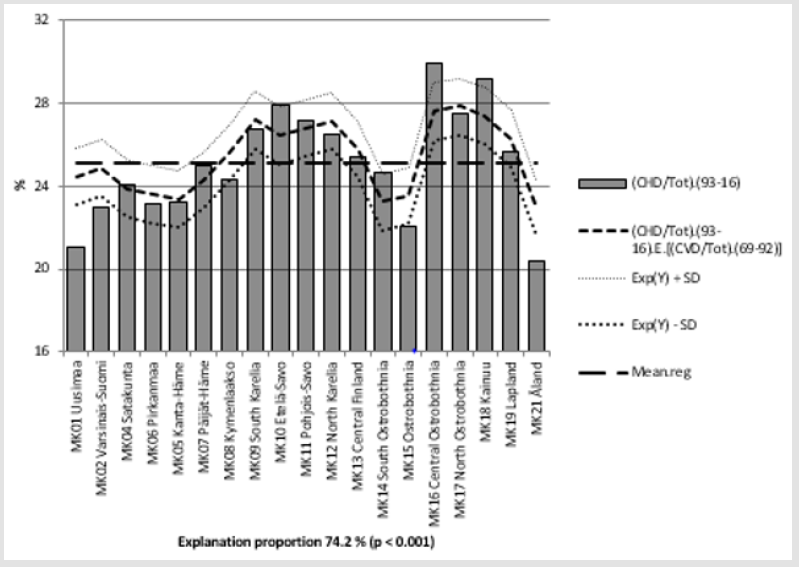
Figure 4: (CHD/Tot).(93-16) and its regression by (CHD/TOT).(69-92) and regional mean of (CHD/Tot).(93-16).
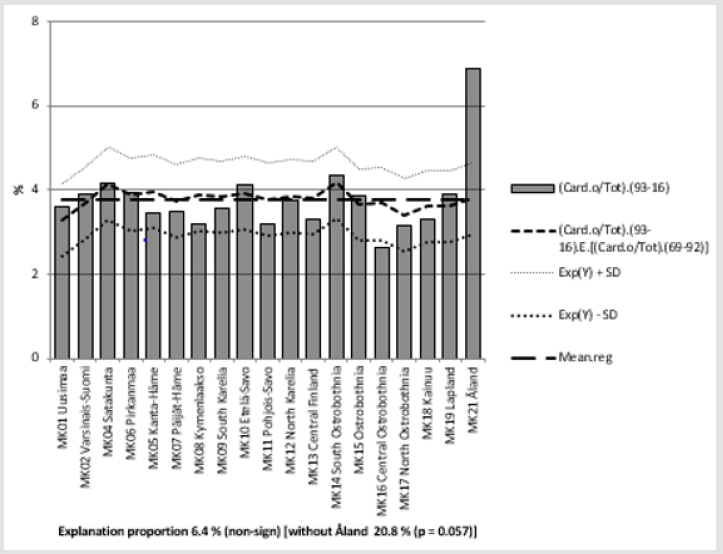
Figure 5: (Card.o/Tot).(93-16) and its regression by (Card.o/TOT).(69-92) and regional mean of (Card.o/Tot).(93-16).
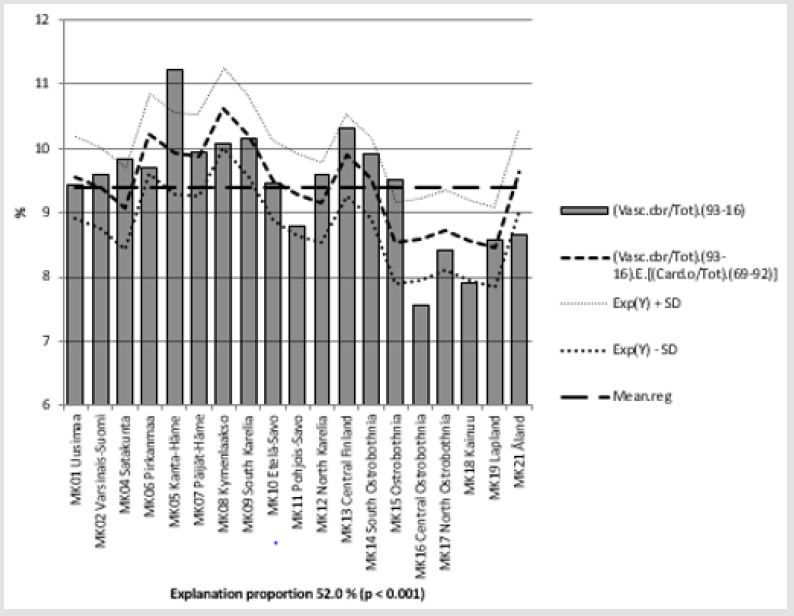
Figure 6: (Vasc.cbr/Tot).(93-16) and its regression by (Vasc.cbr/TOT).(69-92) and regional mean of (Vasc.cbr/Tot). (93-16).
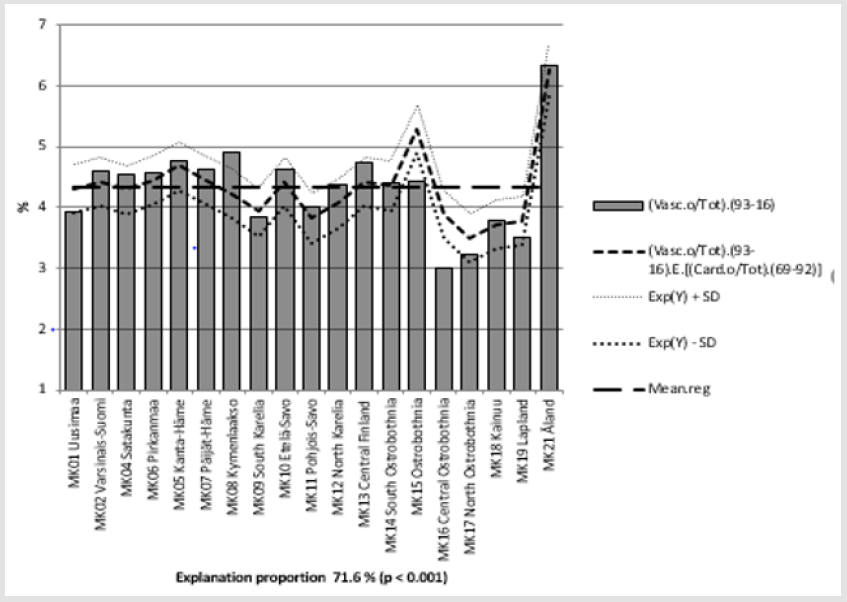
Figure 7: (Vasc.o/Tot).(93-16) and its regression by (Vasc.o/TOT).(69-92) and regional mean of (Vasc.o/Tot). (93-16).
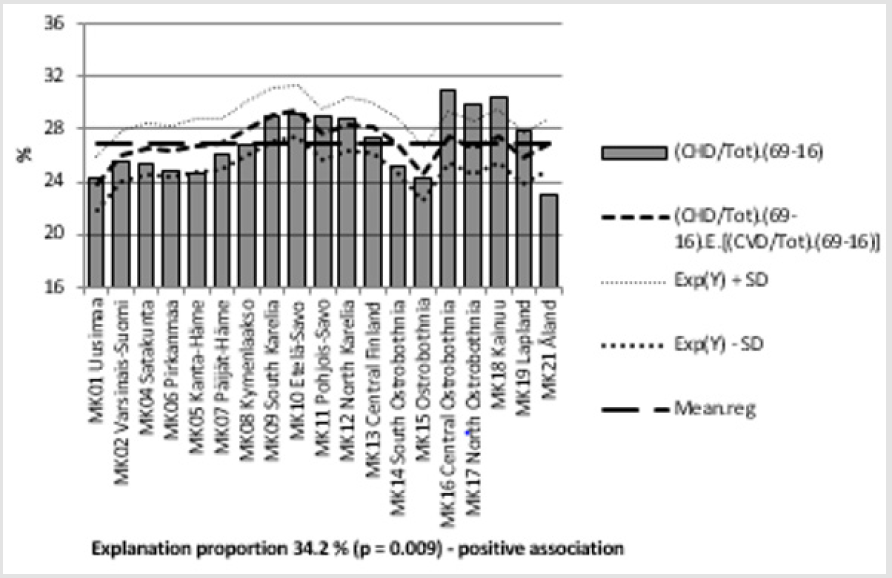
Figure 8: (CHD/Tot). (69-16) and its regression by (CVD/TOT).(69-16) and regional mean of (CHD/Tot). (69-16).
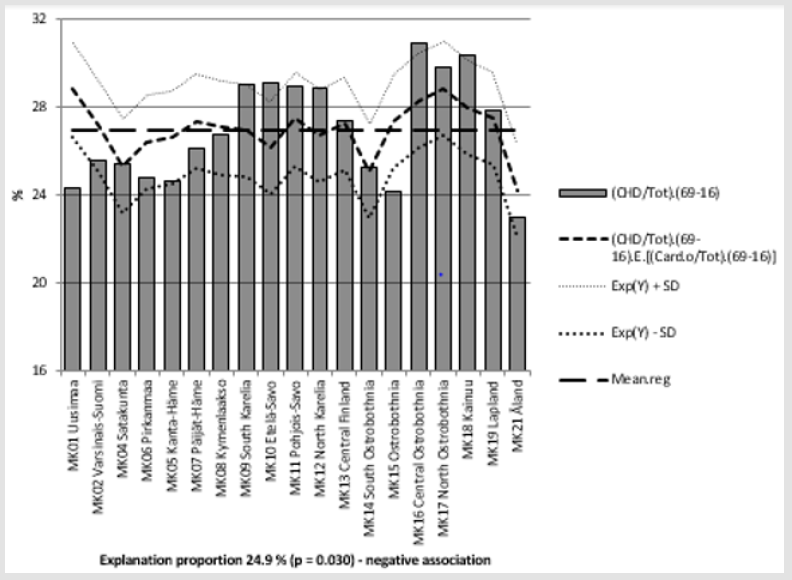
Figure 9: (CHD/Tot). (69-16) and its regression by (Card.o/TOT).(69-16) and regional mean of (CHD/Tot). (69-16).
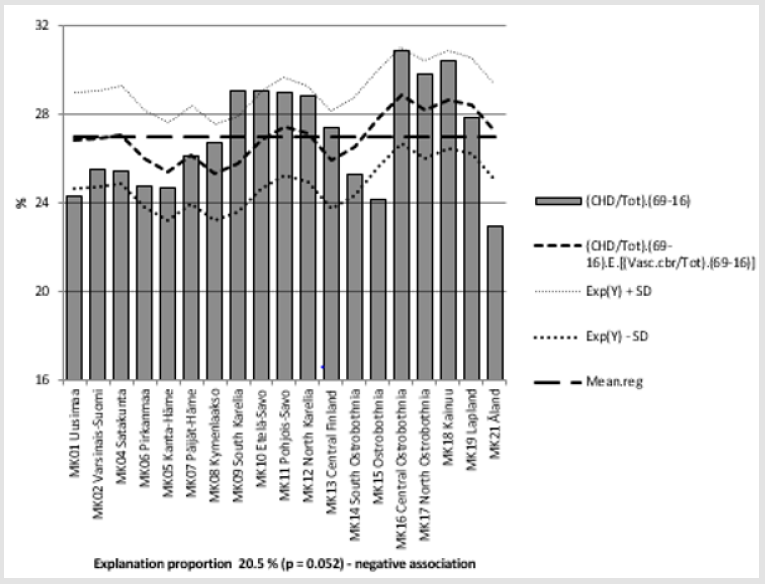
Figure 10: (CHD/Tot). (69-16) and its regression by (Vasc.cbr/TOT).(69-16) and regional mean of (CHD/Tot). (69-16).
Figure 11: (CHD/Tot). (69-16) and its regression by (Vasc.cbr/TOT).(69-16) and regional mean of (CHD/Tot). (69-16).
Discussion
Proportional death-rates (x/Tot) was preferred to (1/100,000) because of generally known differences in regional age-group profiles for balancing the bias caused by different regional mean age.
Earlier has been shown high area-related stability in relative
CHD (mortality) (CHD.i/CHD.mean) during 1964-83 in Finland
[4]. In this study area-related variation of (CHD/Tot) in 1969-92
explained variation in 1993-2016 by 74.2 % ***, respectively (Vasc.
cbr/Tot) by 52.0 % ***, (Vasc.o/Tot) by 71.6 %*** and (Card.o/Tot)
non-significantly by 6.4 % (Figure 3-7, Table 3).
Permanent regional factors seem to have been very important
in other (CVD.s/Tot) (Figures 3,4,6,7), but less in (Card.o/Tot)
(Figure 5), which has obviously been more associated with dynamic
factors. Possible effects of genetic factors seem to be weakest in
(Card.o/Tot).
Periodical variation of (CHD/Tot).(69-16) was explained positively
by (CVD/Tot) (34.2 % **) (Fig.8), obviously because (CHD/
Tot) constitutes more than a half of it (Table 2), but negatively by
all other (CVD.s/Tot)’s: significantly by (Card.o/Tot) (24.9 % *)
(Figure 9), and by (Vasc.o/Tot) 59.4 %*** (Figure 11) and nearly
significantly by (Vasc.cbr/Tot) (20.5 %, p = 0.052) (Fig. 10), (Table
3). Inverse correlation of (CHD/Tot) with (CHD.s/Tot)’s can be
seen best in Figures 1 and 2. Faster time-related decrease in other
(CVD.s)’s than in CHD [3] can depend on different progression of
the diseases. The endpoint of this study was death. Remarkable is
that low and deceasing (CHD/Tot) in Åland (Figure 4) was associated
with high and increasing (Card.o/Tot) (Figure 5).
Time-related inverse association of (CHD/CVD) with other
(CVD.s/CVD)’s [3] and area related reciprocal association of
(CHD/ Tot) with other (CVD.s/Tot)’s (Tabl. 4) are not satisfactorily
explained here. Obviously separate risk factors, as well as medical
treatments, can work with different power on different (CVD.s)’s,
Non-CVD and Tot (e.g. [6]) and modify the ratio of (CVD.s/Tot) ‘s.
Additional regional analyses by (1/100,000) data are even useful,
because they on the other side smooth the bias in the (1/Tot)
studies caused by variation in Non-CVD. Studies by age-adjusted
data could help to make more useful conclusions than this or the
above suggested surveys.
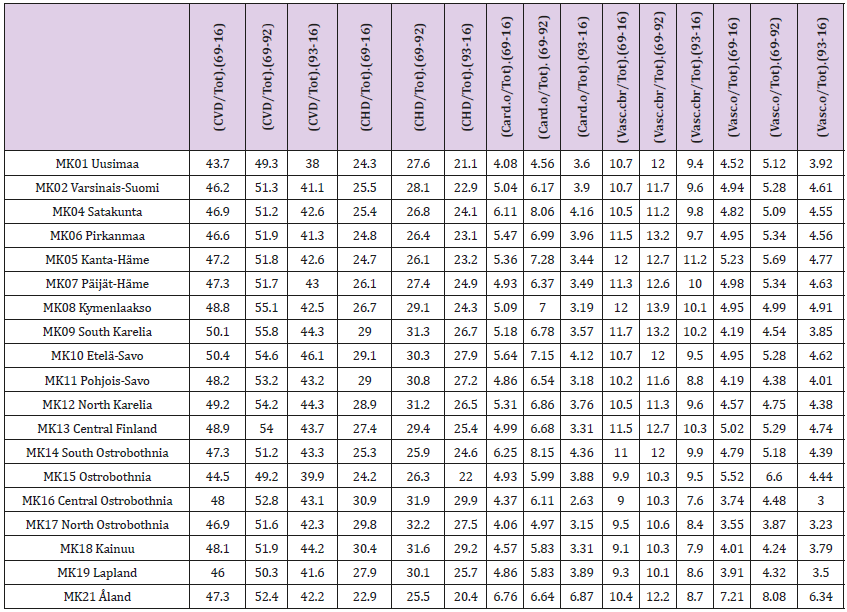
Table 1: Finnish regions and CVD, CHD, (Card.o), (Vasc.cbr) and (Vasc.o) proportions of total mortality in periods of 1969-2016, 1969-1992 and 1993-2016.
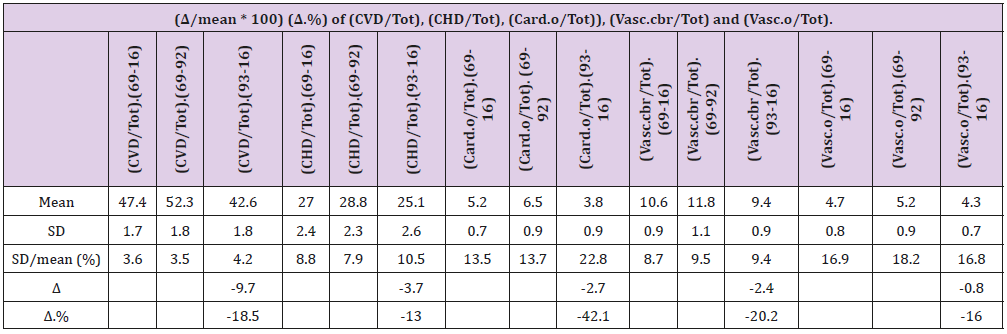
Table 2: Mean, SD, coefficient of variation (SD/mean), difference of periodical means of (1969-92) and (1993-2016) (Δ) and proportional change.
Tabl. 2 shows regional variation of (CVD/Tot) and (CVD.s/Tot)’s during periods 1969-2016, 1969-92 and 1993-2016. During 1969- 2016 in the group of (CVD.s/Tot) the highest proportion showed (CHD/Tot) by its 27 %-units, which constituted more than 50 % of (CVD/Tot), which represented 47 % (1969-92 more than 50 %) of Tot. The next largest group was (Vasc.cbr/Tot) by 10.6 %-units, then about equally (Card.o/Tot) by 5.2 %-units and (Vasc.o/Tot) by 4.7 %-units (Fig. 1 and Fig. 2). In 1969-2016 the highest coefficients of variation of (CVD.s/Tot)’s were in (Vasc.o/Tot) (16.9 %) and (Card.o/Tot) (13.5 %). Separate values of periods 1969-92 and 1993-2016 are in Tabl.2. Difference of periodical means of (CVD.s/Tot)’s was highest in (CHD/Tot) by 3.7 %-units, but proportional changes were higher in (Card.o/Tot) (42.1 %), (Vasc.cbr/Tot) (20.2 %), (Vasc.o/Tot) (16 %) than in (CHD/Tot) (13 %).

Table 3: R squares (%) of regressions of regional (CVD/Tot).(93-16) and (CVD.s/Tot).(93- 16)’s by their respective parameters from 1969-92.
Note: ns: non-significant; ***: p < 0.001.

Table 4: R squares (%) of regressions of regional (CHD/Tot).(69-16) by (CVD/Tot).(69-16) and (CVD.s/Tot).(69-16).
Note: (*): p < 0.1; *: p < 0.05; **: p < 0.01; ***: p < 0.001/.
Conclusion
(CVD.s/Tot)’s showed highly significant periodical inter-areal stability with exception of (Card.o/Tot) (ns). Inter-areal variation of (CHD/ Tot) explained significantly negatively (Card.o/Tot) and (Vasc.o/Tot) and nearly significantly (Vasc.cbr/Tot). Obviously separate risk factors, as well as medical treatments, can work differently on different (CVD.s)’s. Continuation of regional analyses is needed.
Acknowledgement
I am grateful to Professor Osmo Hänninen and late veterinary
surgeon Seppo Haaranen for several discussions.
P.S. Since 2005 via the change in WHO’s coding rules reduced
pneumonia as an underlining cause of death.” The cases mainly
moved to dementia and cerebrovascular diseases” [5].
References
- Giannuzzi P, Wood DA (Eds.). (2007). Eur J Cardiovasc Prev & Reh 14(2) score points on pages E12 - E14.
- Puska P, Vartiainen E, Laatikainen T, Jousilahti P, Paavola M (Eds.). (2019) The North Karelia Project: From North Karelia To National Action.
- Töysä T (2019) Myocardial Degeneration, Subtypes of CVD and Non- CVD-Associations with Fertilization, Selenium Availability. Biomed J Sci & Tech Res.
- Toysa T, Hänninen O (2015) Agro Geology and CHD in Finland. J Agriculture 1(2): 006.
- Statistics Finland > English > Health > 020_11bt_2017 --Deaths by underlying cause of death (54-group short list) and region 1969-2017.
- Toysa T (2018) Associations of K/Mg fertilization ratio with non-CHD mortality in Finland during 1952-99. Biomed J Sci &Tech Res 5(3)-. BJSTR.MS.ID.001216. DOI: 10.26717/ BJSTR.2018.05.001216.
