 Research Article
Abstract
The relationship between estimated glomerular filtration rate (eGFR) and arterial stiffness is uncertain. The objective was to evaluate the association between eGFR and arterial stiffness in Caucasian subjects with intermediate cardiovascular risk. A crosssectional study including 2251 subjects with eGFR ≥ 60ml/min per 1.73m2. Arterial stiffness was measured with pulse pressure (PP), brachial-ankle pulse wave velocity (baPWV) and cardio-ankle vascular index (CAVI). Renal hyperfiltration (RHF) was defined with the highest age group–specific quartile of eGFR. We used multivariate logistic regression analysis to evaluate the associations between arterial stiffness and glomerular filtration, which were further tested using propensity score matching analysis between participants with or without RHF. Subjects with higher eGFR (4th quartile) compared to those with lower eGFR (1st quartile) had an OR=1.63 (p<0.001) of having an elevated baPWV and an OR=1.95 (p<0.001) of having an elevated PP. After multivariate adjustment, each 10ml/min per 1.73m2 increase in eGFR was associated with a 28% higher odd ratio of having elevated PP (OR:1.28;95% CI:1.15–1.42). RHF was significantly associated with a 47% increased risk of elevated PP (p=0.003), but not with baPWV (p=0.347) or CAVI (p=0.515). The results obtained in the paired cohort were similar. RHF was associated with elevated PP, but not with baPWV or CAVI, which suggests that elevated PP may be an early indicator for detection of RHF.
Keywords: Pulse Pressure; Brachial Ankle Pulse Wave Velocity; Cardio Ankle Vascular Index; Glomerular Filtration Rate; Arterial Stiffness; Cardiovascular Risk
Abbreviations: baPWV: Brachial-Ankle Pulse Wave Velocity; CAVI: Cardio-Ankle Vascular Index; PP: Pulse Pressure; RHF: Renal Hyperfiltration
Introduction
There is evidence that the reduction in estimated glomerular filtration rate (eGFR) increases the risk of arterial stiffness and cardiovascular disease (CVD) [1,2], and that CVD is the major cause of morbidity and mortality in subjects with decreased eGFR [3,4]. It is also known that renal hyperfiltration (RHF) is an early sign of renal damage, it increases mortality [5], and is associated with diseases such as diabetes mellitus [6-8], impaired fasting glucose [9] and hypertension [10]. Similarly, pulse pressure (PP), brachialankle pulse wave velocity (baPWV) and cardio-ankle vascular index (CAVI) are indicators of arterial stiffness and predictors of CVD [11-15]. Arterial stiffness and RHF share multiple common pathogenic pathways, including glycation end products, reduction of nitric oxide and oxidative stress [16,17]. Furthermore, from a physiological perspective, RHF can stimulate collagen accumulation in the arterial wall, increasing arterial stiffness [16]. The increased stiffness of the large arteries impairs dampening of PP, allowing greater pulsatile energy to reach the microvasculature, where it may cause damage in organs with low impedance, such as the brain and kidneys [18].
However, few studies have analysed the association between RHF and arterial stiffness, and the results obtained have been contradictory. One of these studies reported that eGFR was inversely associated with pulse wave velocity (PWV) [19], another found no differences in PWV between the group with RHG and the normofiltering group [20]. Finally, Lin L et al. [21] found an association between RHF and arterial stiffness evaluated with PP and baPWV. Therefore, the objective of this study is to analyse the relationship between eGFR and arterial stiffness, evaluated with PP, baPWV and CAVI, in subjects with normal or increased filtering from a Caucasian population cohort with intermediate cardiovascular risk.
Methods
Study Design and Population
This trial was a cross-sectional study of subjects recruited to the improving interMediAte RisK management (MARK) study (NCT01428934) [22]. The current study focuses on the baseline visit. In this multicenter project, study population selection was performed by random sampling, from individuals who met the inclusion criteria and were attended by general practitioners from July 2011 to June 2013 at six health care centers from three autonomic communities in Spain. Subjects were recruited into the study from those aged 35 to 74 years with intermediate cardiovascular risk. This study analyzed 2251 of the 2495 subjects recruited in the MARK study. For the present analysis, we excluded individuals with incomplete information on serum creatinine (n=24), CAVI or baPWV (n=127) and those with eGFR less than 60 ml/min per 1.73m2 (n=93). The study was approved by the Clinical Research Ethics Committees of the Primary Care Research Institute Jordi Gol, Health Care Area of Salamanca and Palma of Mallorca. All participants were informed of the objectives and procedures of the study and signed the informed consent form to participate. The study was conducted following the recommendations of the Declaration of Helsinki [23].
Variables and Measurement Instruments
A detailed description regarding how the clinical data were collected, how the anthropometric measurements were performed, and how the analytical parameters were obtained has been published elsewhere [22]. Office blood pressure measurement involved three measurements of systolic blood pressure (SBP) and diastolic blood pressure (DBP), using the average of the last two measurements, with a validated OMRON model M10-IT sphygmomanometer (Omron Health Care, Kyoto, Japan), by following the recommendations of the European Society of Hypertension [24]. Body weight was determined twice with an approved electronic scale (Seca 770, Medical scale and measurement systems, Birmingham, United Kingdom) after proper calibration (accuracy±0.1 kg). Readings were rounded to 100g. Height was measured with a stadiometer (Seca 222), recording the average of two measures. Waist circumference (WC) was measured following the recommendations of the Spanish Society for the Study of Obesity in 2007 [25].
CAVI was measured using a VaSera VS-1500® device (Fukuda Denshi) [13,26]. CAVI values are calculated automatically by estimating the stiffness parameter β with the following equation: β = 2ρ x 1/(Ps-Pd) x ln (Ps/Pd) x PWV2, where ρ is blood density, Ps and Pd are SBP and DBP in mmHg, and PWV is measured between the aortic valve and the ankle [27]. The mean coefficient of variation of the CAVI measurement is less than 5%, small enough to allow for clinical use of the index, confirming that CAVI has a favorable reproducibility [26]. baPWV was estimated using the equation: baPWV=(0.5934×height (cm)+14.4724)/tba (tba is the time interval between the arm and ankle waves) [28]. Measurements were performed with the patient in the supine position after resting for 10 minutes in a quiet room at a stable temperature. Participants should not have smoked or exercised within the hour prior to the test. The average value between both ends of CAVI and baPWV were considered for the study. Venous blood sampling was performed between 08:00 and 09:00 after the individuals had fasted and abstained from smoking and the consumption of alcohol and caffeinated beverages for the previous 12 hours. Fasting plasma glucose (FPG) (mg/dl), HbA1c (%), creatinine, cholesterol and triglycerides concentration were determined using standard enzymatic automated methods. High density lipoprotein cholesterol after apo B containing lipoprotein precipitation. Low density lipoprotein (LDL) cholesterol was determined by the Friedewald formula.
The assessment of eGFR was based on the CKD–Epidemiology Collaboration (CKD–EPI) equation expressed in ml/min per 1.73m2; Women: Cr ≤ 0.7mg/dl, eGFR = 144 × (Cr/0.7)-0.329 × (0.993) age; Cr > 0.7mg/dl, eGFR = 144× (Cr/0.7) -1.209 × (0.993) age and men: Cr ≤ 0.7 mg/dl, eGFR = 141 × (Cr/0.7)-0.411 × (0.993) age; Cr > 0.7mg/ dl, eGFR = 141× (Cr/0.7) -1.209 × (0.993) age [29].Participants were divided into four age groups (<45, 45–54, 55–64 and ≥ 65 years). The age group–specific quartiles of eGFR were determined (Tables 1-4), which demonstrates age group–specific cutoff points of eGFR quartiles). RHF was defined with the highest age group–specific quartile of eGFR. The upper quartile of CAVI (9.49), of baPWV (16.15) and PP (60.87) were defined as elevated. The investigators performing the different tests were blinded to the clinical data of the patient. All assessments were made within a period of 10 days.
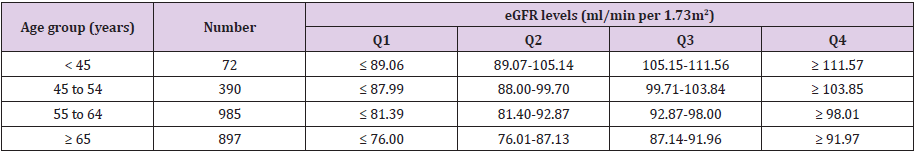
Table 1: eGFR distributions in each age group.
Note: eGFR, glomerular filtration rate estimated.
Q1: the lowest quartile of eGFR; Q2: the second quartile of eGFR; Q3: the third quartile of eGFR; Q4: the highest quartile of eGFR.
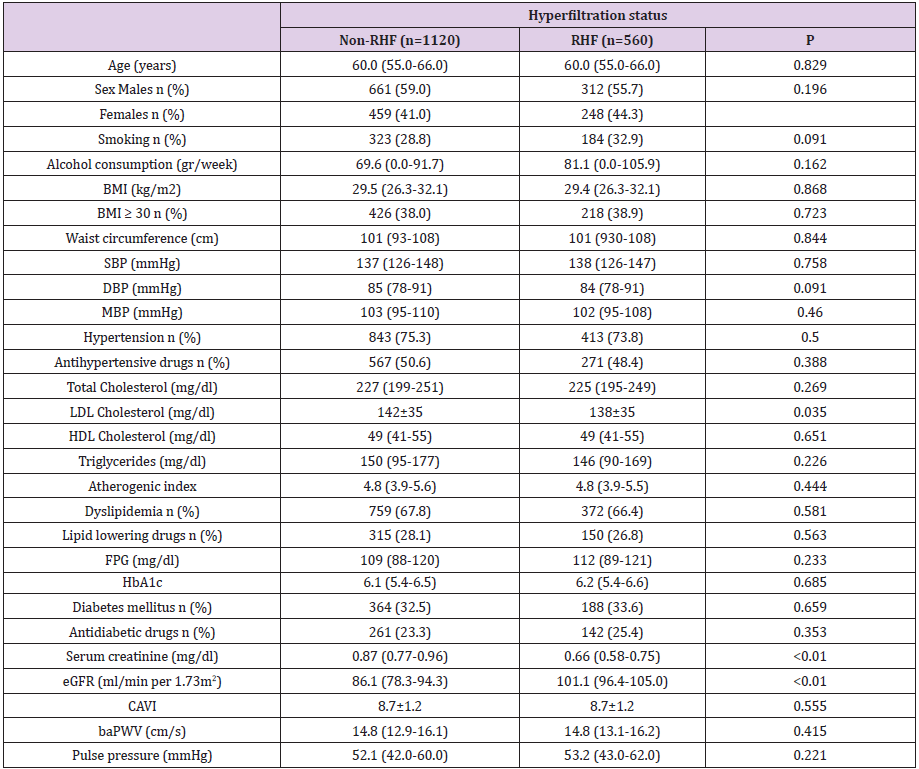
Table 2: Characteristics of participants with or without renal hyperfiltration (RHF) after propensity score matching.
Note: Data were means ±SD or medians (interquartile ranges) for continuous variables or numbers (proportions) for categorical variables. P values were calculated with the paired t-test or the Wilcoxon signed rank test for continuous variables, and the McNemar’s test or marginal homogeneity test for categorical variables. baPWV, brachial-ankle pulse wave velocity; BMI, body mass index; CAVI, cardio-ankle vascular index; DBP, diastolic blood pressure; eGFR, estimated glomerular filtration rate; FPG, fasting plasma glucose; HbA1c, glycosylated hemoglobin; HDL, high density lipoprotein cholesterol; LDL, low density lipoprotein; MBP, Mean blood pressure; RHF, Hyperfiltration status; SBP, Systolic blood pressure.
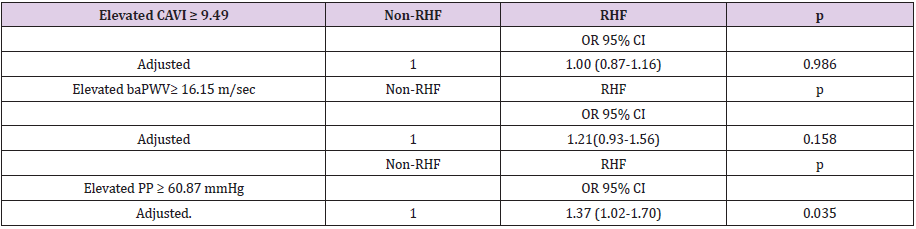
Table 3: Odds ratio of elevated CAVI, baPWV and PP comparing with or without renal hyperfiltration after propensity score matching.
Note: baPWV, brachial–ankle pulse wave velocity; CAVI, cardio-ankle vascular index; CI, confidence interval; eGFR, glomerular filtration rate estimated; OR, odds ratio; PP, Pulse pressure.
Adjusted for waist circumference, mean blood pressure, atherogenic index, alcohol consumption gr/week, smoking (0=Not and 1=Yes), antihypertensive drugs (0=Not and 1=Yes), antidiabetic drugs and lipid lowering drugs (0=Not and 1=Yes).
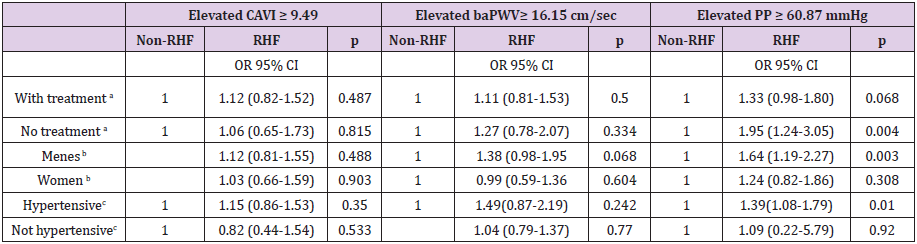
Table 4: Odds ratio of elevated CAVI, baPWV and PP comparing renal hyperfiltration with nonrenal hyperfiltration individuals.
Note: baPWV, brachial–ankle pulse wave velocity; CAVI, cardio-ankle vascular index; CI, confidence interval; eGFR, glomerular filtration rate estimated; OR, odds ratio; PP, Pulse pressure.
aAdjusted for age, gender (0=females 1= males), waist circumference, mean blood pressure, atherogenic index, alcohol consumption gr/week, smoking (0=Not and 1=Yes).
bAdjusted for age, waist circumference, mean blood pressure, atherogenic index, alcohol consumption gr/week, smoking (0=Not and 1=Yes), antihypertensive drugs (0=Not and 1=Yes), antidiabetic drugs and lipid lowering drugs (0=Not and 1=Yes).
cAdjusted for age, gender (0=females 1= males), waist circumference, atherogenic index, alcohol consumption gr/week, smoking (0=Not and 1=Yes), antidiabetic drugs and lipid lowering drugs (0=Not and 1=Yes).
Statistical Analysis
The general characteristics were demonstrated in the total of participants, by RHF status and according to quartiles of eGFR. Continuous variables were presented as means ± SD for normally distributed variables or medians (interquartile ranges) for the skewed variables. The means of two groups were compared using a t Student or U-MannWitheny test, and para la comparación de varios grupos were tested using Kruskal Wallis or Anova tests. All categorical variables were presented as numbers and proportions. Chi-square test was used for categorical variables. Covariance analysis was performed to evaluate the variables-adjusted mean levels of CAVI, baPWV and PP by eGFR quartiles and between the RHF and non-RHF groups. To estimate the odds ratios (ORs) of people with greater eGFR in relation with elevated CAVI, elevated baPWV and elevated PP, either in quartiles increase or each 10-U increase, multivariate logistic regression analysis were conducted. The confounders included in the models were: Model 1 age and gender (0=Male, 1=Female), model 2 add waist circumference, mean blood pressure, atherogenic index, alcohol consumption gr/week, smoking (0=Not and 1=Yes), add model 3 and antihypertensive drugs (0=Not and 1=Yes), antidiabetic drugs (0=Not and 1=Yes), and lipid lowering drugs (0=Not and 1=Yes).
To estimate the odds ratios (ORs) of the RHF and non-RHF groups with elevated CAVI, elevated baPWV and elevated PP, multivariate logistic regression analysis was conducted. The confounders included in the models were those used in previous models. To balance and minimize the intergroup differences, we conducted propensity score matching (PSM). Se utilizaron las variables edad, gender y diabetes mellitus type 2 (0=Not and 1=Yes), que presentaron diferencias significativas entre los sujetos con RHF y no RHF. Participants were matched using the nearest neighbor method, and 1:2 matching. Mediante PSM se obtuvieron dos grupos de 561 participants in the RHF group and 1122 in the non-RHF group. The matched data set was also analyzed using multivariate logistic regression models for the associations of RHF with elevated CAVI, baPWV and PP. The ORs and 95% confidence interval (CI), with adjustment for unmatched variables including waist circumference, mean blood pressure, atherogenic index, alcohol consumption gr/week, smoking (0=Not and 1=Yes), antihypertensive drugs (0=Not and 1=Yes), antidiabetic drugs (0=Not and 1=Yes), and lipid lowering drugs (0=Not and 1=Yes). To examine possible differences between groups, we performed three analyzes by subgroups, treated and untreated, men and women, hypertensive and non-hypertensive. The data were analysed using the IBM SPSS Statistics for Windows, Version 23.0 (IBM Corp, Armonk, NY). A value of p<0.05 was considered statistically significant.
Results
Overall clinical and demographic characteristics and by RHF status of the study population are summarized in Table 5. The mean age of the 2251subjects included in the study was 61.1±7.6 years. Subjects with RHF compared to those without RHF were younger, had lower LDL-cholesterol, creatinine and CAVI values and higher fasting glucose and HBA1c levels. In the RHF group, 32.9% were smokers, 33.6% diabetics and 44.3% women, while these percentages were lower in the non-RHF group. Clinical and demographic characteristics by eGFR quartiles are shown in Table 6. We found differences between eGFR quartiles in the following variables: age, DBP, MBP, waist circumference, total cholesterol, triglycerides, HDL-cholesterol, atherogenic index, the three measures of arterial stiffness analysed and the percentage of smokers, diabetics and persons on antihypertensive and antidiabetic drugs. Mean CAVI, baPWV and PP values adjusted by age, cardiovascular risk factors and drug use by GFR quartiles and RHF status are shown in Figure 1.
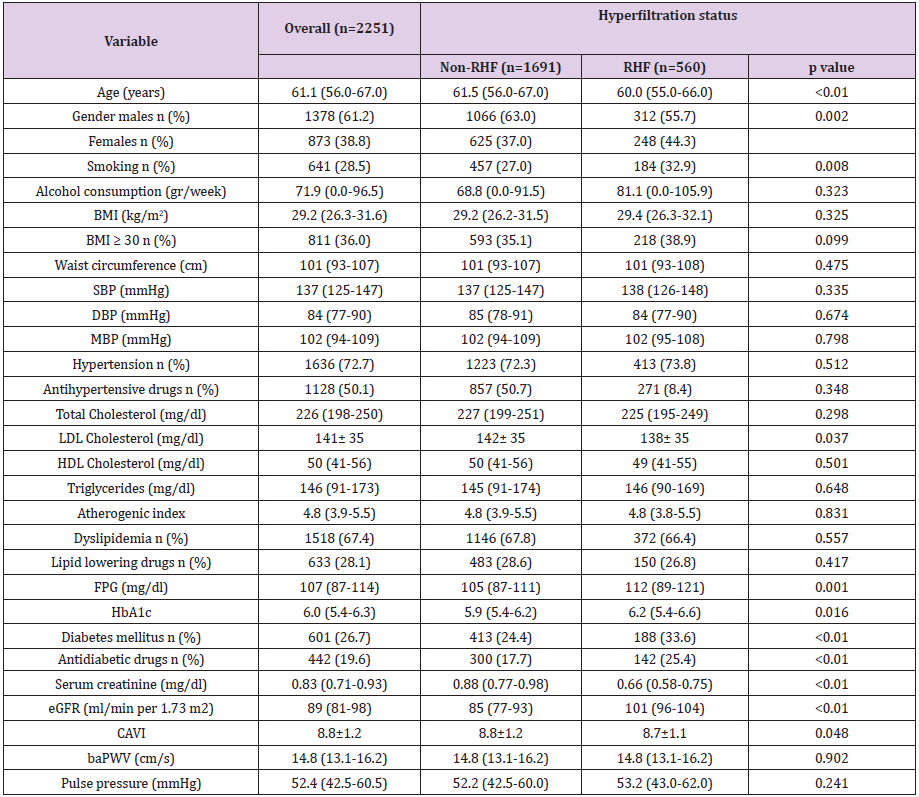
Table 5: Characteristics of study participants overall and with or without renal hyperfiltration.
Note: Data were means ± SD or medians (interquartile ranges) for skewed variables or numbers (proportions) for categorical variables. P values were calculated from t Student or U-MannWitheny for continuous variables and Chi-square test for categorical variables. baPWV, brachial-ankle pulse wave velocity; BMI, body mass index; CAVI, cardio-ankle vascular index; DBP, diastolic blood pressure; eGFR, estimated glomerular filtration rate; FPG, fasting plasma glucose; HbA1c, glycosylated hemoglobin; HDL, high density lipoprotein cholesterol; LDL, low density lipoprotein; MBP, Mean blood pressure; RHF, Hyperfiltration status; SBP, systolic blood pressure.
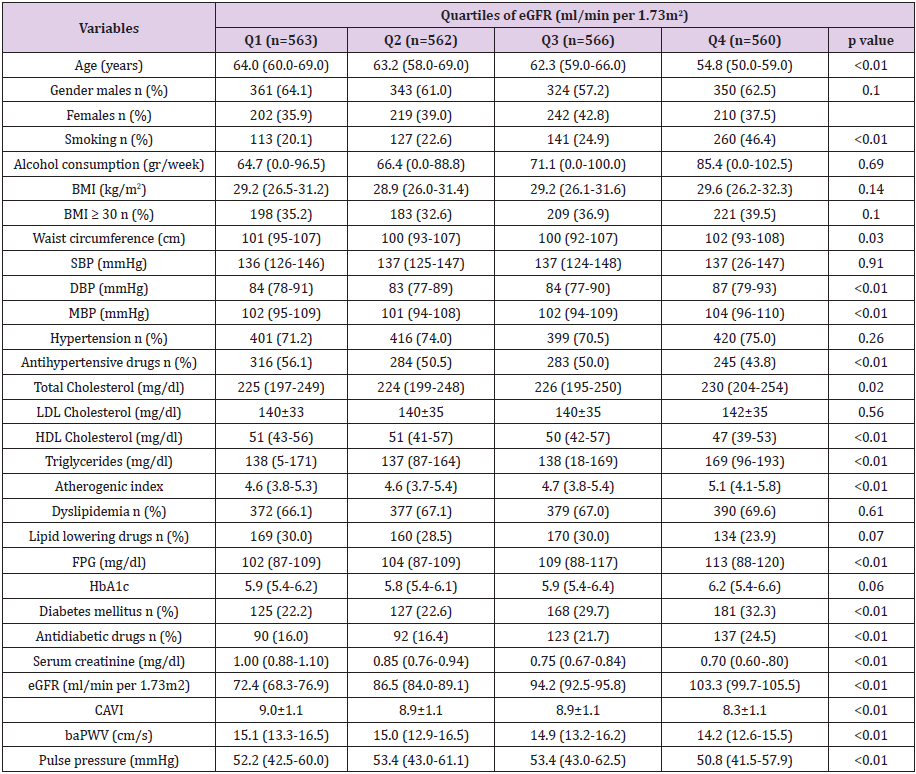
Table 6: Characteristics of study participants overall by quartiles of eGFR (ml/min per 1.73m2).
Note: Data were means ± SD or medians (interquartile ranges) for skewed variables or numbers (proportions) for categorical variables. P values were calculated from Kruskal Wallis or Anova tests for continuous variables and Chi-square test for categorical variables. baPWV, brachial-ankle pulse wave velocity; BMI, body mass index; CAVI, cardio-ankle vascular index; DBP, diastolic blood pressure; eGFR, estimated glomerular filtration rate; FPG, fasting plasma glucose; HbA1c, glycosylated hemoglobin; HDL, high density lipoprotein cholesterol; LDL, low density lipoprotein; MBP, Mean blood pressure; RHF, Hyperfiltration status; SBP, systolic blood pressure.
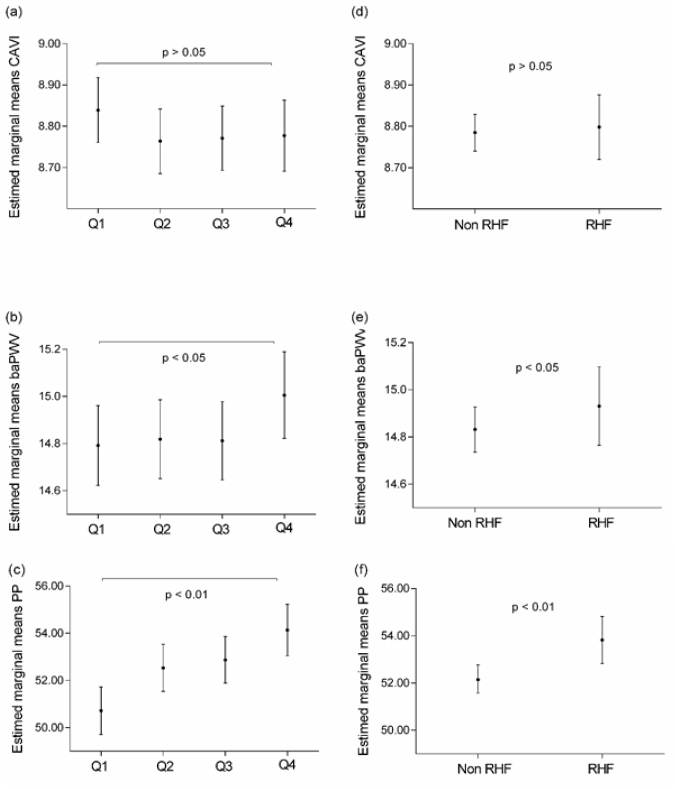
Figure 1: Marginal means of CAVI, baPWV and PP by eGFR quartiles (a, b and c) and by RHF and non-RHF status (d, e and f).
Subjects classified in the highest eGFR quartile and subjects with RHF had a higher mean baPWV (Fig. 1b and 1e) and higher mean PP (Fig. 1c and 1f) than those in the lowest quartile and non- RHF participants (p<0.05 and p<0.01, respectively). However, in no case were differences found with CAVI (Fig. 1a and 1d). In the logistic regression analysis, subjects with higher eGFR (4th quartile) compared to those with lower eGFR (1st quartile) had an OR=1.63 (p<0.001) of having an elevated baPWV and an OR=1.95 (p<0.001) of having an elevated PP (Table 7). When the variable eGFR was considered as a continuous variable instead of quartile categories, it was found that each 10ml/min per 1.73m2 increase in eGFR increases the risk of having elevated PP by 28% (OR=1.28; p<0.001), whereas the association with baPWV was lost (OR=1.09; p=0.109). Likewise, when the variable eGFR was dichotomized into RHF and non-RHF subjects, the association was only maintained in subjects with elevated PP (OR=1.47; p<0.003) (Table 8). After matching for propensity score, the RHF and non-RHF groups showed similar distributions of propensity score, implying that the differences in covariates between the two groups were minimal (Table 2).
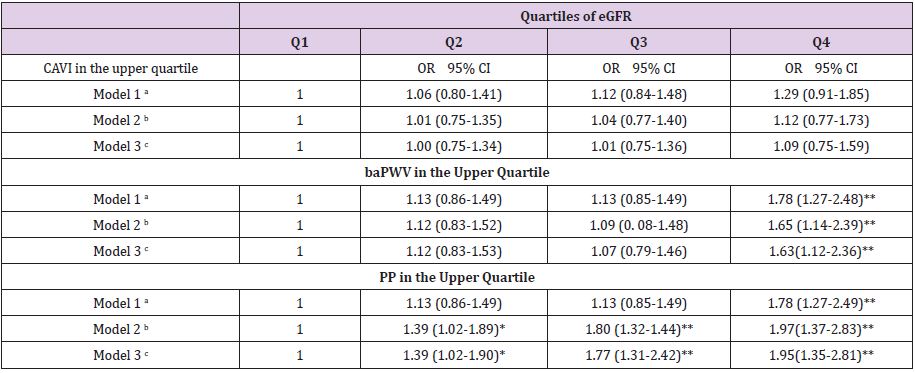
Table 7: Association of elevated CAVI, filtration rate baPWV and PP with estimated glomerular levels.
Note: baPWV, brachial–ankle pulse wave velocity; CAVI, cardio-ankle vascular index; CI, confidence interval; eGFR, glomerular filtration rate estimated; OR, odds ratio; PP, Pulse pressure.
aAdjusted for age and gender (0=females 1= males).
bAdjusted as model 1 and in addition, waist circumference, mean blood pressure, atherogenic index, alcohol consumption gr/week, smoking (0=Not and 1=Yes).
cAdjusted as model 2 and in addition, antihypertensive drugs (0=Not and 1=Yes), antidiabetic drugs and lipid lowering drugs (0=Not and 1=Yes).
*p< 0.05, **p<0.01
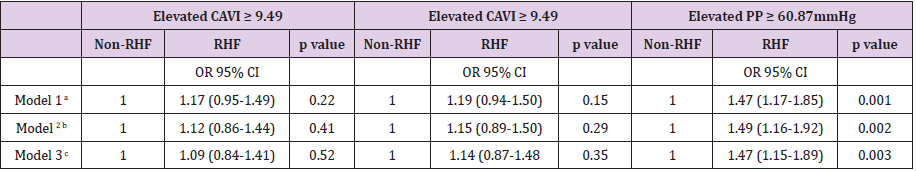
Table 8: Odds ratio of elevated CAVI, baPWV and PP comparing renal hyperfiltration with nonrenal hyperfiltration individuals.
Note: baPWV, brachial–ankle pulse wave velocity; CAVI, cardio-ankle vascular index; CI, confidence interval; eGFR, glomerular filtration rate estimated; OR, odds ratio; PP, Pulse pressure.
aAdjusted for age and gender (0=females 1= males).
bAdjusted as model 1 and in addition, waist circumference, mean blood pressure, atherogenic index, alcohol consumption gr/week, smoking (0=Not and 1=Yes).
cAdjusted as model 2 and in addition, antihypertensive drugs (0=Not and 1=Yes), antidiabetic drugs and lipid lowering drugs (0=Not and 1=Yes).
In selected subjects with propensity score, we performed a covariance analysis to evaluate the mean values of CAVI, baPWV and PP in RHF and non-RHF subjects. The results are similar to those found in the overall analysis (Figure 2) (Supplemental Digital Content 3). In selected subjects with propensity score, we performed different multivariate logistic regression models to see the associations of RHF with CAVI, baPWV and PP. After adjusting for variables not used in the propensity score (waist circumference, mean blood pressure, atherogenic index, alcohol consumption g/ week, smoking (0=No and 1=Yes), antihypertensive drugs (0=No and 1=Yes), antidiabetic drugs and lipid lowering drugs (0=No and 1=Yes)), we found that RHF was associated with elevated PP: OR 1.32; 95% CI 1.02-1.70 (Table 3). In the multivariate logistic regression analysis by subgroups, using the adjustment variables of model 3, the association between RHF and PP was significant in the subgroups of untreated subjects, subjects with hypertension and male subjects (Table 4).
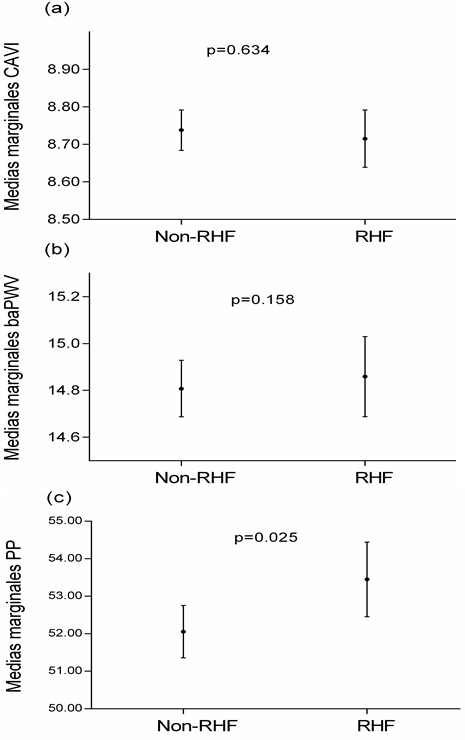
Figure 2: Marginal means of CAVI, baPWV and PP by RHF and non-RHF status (a, b and c).
Discussion
The results of this study suggest the RHF shows a significant association with arterial stiffness measured with PP, but not with baPWV and CAVI, in Caucasian subjects with intermediate cardiovascular risk and eGFR ≥60 ml/min per 1.73m2. Moreover, the participants with higher eGFR (included in the 4th quartile) compared to those with a lower eGFR (1st quartile used as the reference group) show an association with baPWV and PP. However, when the variable eGFR was considered as a continuous variable or when it was dichotomized into RHF and non-RHF subjects, the association was only maintained with PP [29,30]. To the best of our knowledge, this is the first study analysing the association of RHF with arterial stiffness, measured with PP, baPWV and CAVI, in subjects with intermediate cardiovascular risk. There is sufficient evidence that the three measures used in this study to evaluate arterial stiffness are good predictors of the decline in eGFR. Thus, higher PP, PWV and CAVI were associated linearly and independently with a more rapid decline in renal function [12,14,30,31]. The association was found in studies using the ambulatory arterial stiffness index [32,33].
Although the relationship between RHF and risk factors increasing arterial stiffness has been shown in diabetic [6,8], prediabetic [9], hypertensives [10] and obese subjects [34], the relationship between arterial stiffness and RHF has been little studied and the results found did not agree. Thus, Cherney et al. [20] e in type 1 diabetic subjects, found no differences in PWV between RHF y normofiltering groups. However, Lin et al. [21] found an association between RHF and arterial stiffness evaluated with PP and baPWV. The data from our study are similar to those found by Lin et al. [21] in the Chinese population. In this study, we found that participants with higher eGFR (4th quartile) compared to those with a lower eGFR (1st quartile) had a 63% higher risk of having elevated baPWV and a 95% higher risk of having elevated PP. These results suggest that the risk of increased arterial stiffness by eGFR quartiles differs depending on the measure used, which did not attain significance in the case of CAVI, probably related to the fact the CAVI assesses arterial stiffness independent of the blood pressure at the time of measurement [26,27].
However, baPWV and PP are “pressure-dependent” measures [35], and the increase in PP possibly precedes the appearance of the increase in baPWV. This could explain in part why relatively lower eGFR values (2nd and 3rd quartiles) were associated with a higher risk of elevated PP. In the analysis performed in this study and contrary to the results of Lin et al [21], it was observed that a 10-U increase in eGFR increased the risk of elevated PP but not of elevated baPWV. The discrepancies of our study with regard to baPWV are probably explained by the number of subjects analysed (9136 vs 2251), the mean age of the sample (58 vs 61 years), the percentage of males included (61% vs 38%), the characteristics of the subjects analysed (general population vs subjects with intermediate CV risk) and ethnic group (Chinese vs Caucasian). Finally, we did not find any study that performed these analyses with CAVI, which, according to our results, is not related to elevated eGFR or RHF.
The pathophysiological mechanisms of the association between arterial stiffness and RHT are not well established. Thus, increased activity of the renin-angiotensin-aldosterone system and the sympathetic nervous system may contribute [17,36], by stimulating collagen accumulation in the arterial wall and increasing arterial stiffness. Furthermore, arterial stiffness and RHF share multiple common pathogenic pathways, including glycation end products, reduction of nitric oxide and oxidative stress [16,17]. In addition, arterial remodelling is seen in the initial stage of chronic kidney disease and facilitates progression of the disease [34]. Experimental studies have shown that RHF is a mechanism to regulate renal damage after the onset of the lesions [37]. Our study was conducted in subjects with eGFR ≥ 60ml/min per 1.73m2 with intermediate cardiovascular risk, so they had associated cardiovascular risk factors (hypertension, diabetes, dyslipidaemia or obesity), which may influence arterial structure and induce remodelling and hardening [38], in addition to the previously mentioned mechanisms. We should also underline that arterial stiffness, and, as a consequence, the increase in pulse pressure in the microcirculation of the kidney, may contribute physiologically to RHF.
Alternatively, the association observed between PP and eGFR may be substantially mediated by arterial stiffness and not exclusively by vascular resistance. This would imply assuming that the relationship between arterial stiffness and renal function is not a one-way relationship. The renal microvessels are characterized by their low resistance and low impedance [38]. These flow characteristics make the renal microcirculation more susceptible to variable oscillations in systolic and diastolic blood flow [14]. This theory is supported by clinical studies that indicate that the association between PWV and eGFR would explain the increase in renal artery pulsatile index and renal resistive index [18]. In addition, it has been shown in patients with preserved renal function that high PWV or PP are independent predictors of the decline in eGFR [14,39]. Therefore, it remains unclear whether renal hyperfiltration is the determinant of increased arterial stiffness or whether increased arterial stiffness mediates the transmission of excessive pulsatile energy to the vulnerable renal microcirculation. Well-designed prospective studies using new imaging techniques are thus needed to approximate renal haemodynamics to help to elucidate this association.
This study has various limitations that should be considered. First, eGFR was estimated using the CKD-EPI equation based on serum creatinine and not on direct measurements. However, the CKD-EPI equation has been used in large epidemiological studies. Second, the nature of the study prevents causal interference from being drawn, so that prospective studies are necessary to confirm the association between high eGFR and arterial stiffness. Third, our study included subjects between 35 and 74 years of age with intermediate cardiovascular risk, and therefore these results may not be applicable to the general population.In conclusion, we found that RHF was independently associated with arterial stiffness measured with PP, but not with baPWV or CAVI, in Caucasian subjects with intermediate cardiovascular risk, which suggests that elevated PP may be an early indicator for detection of RHF.
Acknowledgement
We are grateful to all professionals participating in the MARK study. Lead author for this group: Rafel Ramos, Research Unit, Primary Health Care, Girona, Jordi Gol Institute for Primary Care Research (IDIAP Jordi Gol), Catalonia, Spain, E-mail: rramos.girona. ics@gencat.net. Coordinating Center: Rafel Ramos, Ruth Martí, Dídac Parramon, Anna Ponjoan, Miquel Quesada, Maria Garcia-Gil, Martina Sidera and Lourdes Camós, Research Unit, Primary Health Care, Jordi Gol Institute for Primary Care Research (IDIAP Jordi Gol), C/Maluquer Salvador, 11, 17002-Girona, Catalonia, Spain. Fernando Montesinos, Ignacio Montoya, Carlos López, Anna Agell, Núria Pagès of the Primary Care Services, Girona, Catalan Institute of Health (ICS), Catalonia, Spain. Irina Gil, Anna Maria-Castro of the Primary Care Services, Girona, Institut d’Assistència Sanitaria (IAS), Catalonia, Spain. Fernando Rigo, Guillermo Frontera, Antònia Rotger, Natalia Feuerbach, Susana Pons, Natividad Garcia, John Guillaumet, Micaela Llull and Mercedes Gutierrez of the Health Center Primary Care San Augustín, Ibsalut Balears, Spain. Cristina Agudo-Conde, Leticia Gómez-Sanchez, Carmen Castaño-Sanchez, Carmela Rodriguez-Martín, Benigna Sanchez-Salgado, Angela de Cabo-Laso, Marta Gómez-Sánchez, Emiliano Rodriguez-Sanchez, Jose Angel Maderuelo-Fernandez, Emilio Ramos-Delgado, Carmen Patino-Alonso, Jose I Recio-Rodriguez, Manuel A Gomez-Marcos and Luis Garcia-Ortiz, Primary Care Research Unit of The Alamedilla, Salamanca, Spain, Castilla and León Health Service–SACYL.
References
- Gansevoort RT, Correa Rotter R, Hemmelgarn BR, Jafar TH, Heerspink HJ, et al. (2013) Chronic kidney disease and cardiovascular risk: epidemiology, mechanisms, and prevention. Lancet 382(9889): 339-352.
- Hermans MM, Henry R, Dekker JM, Kooman JP, Kostense PJ, et al. (2007) Estimated glomerular filtration rate and urinary albumin excretion are independently associated with greater arterial stiffness: the Hoorn Study. Journal of the American Society of Nephrology: JASN 18(6): 1942-1952.
- Warnock DG, Delanaye P, Glassock RJ (2017) Risks for All-Cause Mortality: Stratified by Age, Estimated Glomerular Filtration Rate and Albuminuria. Nephron 136(4): 292-297.
- Nitsch D, Grams M, Sang Y, Black C, Cirillo M, et al. (2013) Associations of estimated glomerular filtration rate and albuminuria with mortality and renal failure by sex: a meta-analysis. BMJ 346: f324.
- Park M, Yoon E, Lim YH, Kim H, Choi J, et al. (2015) Renal hyperfiltration as a novel marker of all-cause mortality. Journal of the American Society of Nephrology: JASN 26(6): 1426-1433.
- Jerums G, Premaratne E, Panagiotopoulos S, MacIsaac RJ (2010) The clinical significance of hyperfiltration in diabetes. Diabetologia 53(10): 2093-2104.
- Tonneijck L, Muskiet MH, Smits MM, Van Bommel EJ, Heerspink HJ, et al. (2017) Glomerular Hyperfiltration in Diabetes: Mechanisms, Clinical Significance, and Treatment. Journal of the American Society of Nephrology.
- Sun ZJ, Yang YC, Wu JS, Wang MC, Chang CJ, et al. (2016) Increased risk of glomerular hyperfiltration in subjects with impaired glucose tolerance and newly diagnosed diabetes. Nephrol Dial Transplant 31(8): 1295-1301.
- Melsom T, Mathisen UD, Ingebretsen OC, Jenssen TG, Njolstad I, et al. (2011) Impaired fasting glucose is associated with renal hyperfiltration in the general population. Diabetes care 34(7): 1546-1551.
- Palatini P (2012) Glomerular hyperfiltration: a marker of early renal damage in pre-diabetes and pre-hypertension. Nephrol Dial Transplant 27(5): 1708-1714.
- Ford ML, Tomlinson LA, Chapman TP, Rajkumar C, Holt SG (2010) Aortic stiffness is independently associated with rate of renal function decline in chronic kidney disease stages 3 and 4. Hypertension 55(5): 1110-1115.
- Safar ME, Plante GE, Mimran A (2015) Arterial stiffness, pulse pressure, and the kidney. American journal of hypertension 28(5): 561-569.
- Satoh N, Shimatsu A, Kato Y, Araki R, Koyama K, et al. (2008) Evaluation of the cardio-ankle vascular index, a new indicator of arterial stiffness independent of blood pressure, in obesity and metabolic syndrome. Hypertension research 31(10): 1921-1930.
- Sedaghat S, Mattace Raso FU, Hoorn EJ, Uitterlinden AG, Hofman A, et al. (2015) Arterial Stiffness and Decline in Kidney Function. Clinical journal of the American Society of Nephrology 10(12): 2190-2197.
- Vlachopoulos C, Aznaouridis K, Stefanadis C (2010) Prediction of cardiovascular events and all-cause mortality with arterial stiffness: a systematic review and meta-analysis. Journal of the American College of Cardiology 55(13): 1318-1327.
- Palombo C, Kozakova M (2016) Arterial stiffness, atherosclerosis and cardiovascular risk: Pathophysiologic mechanisms and emerging clinical indications. Vascular pharmacology 77: 1-7.
- Helal I, Fick Brosnahan GM, Reed Gitomer B, Schrier RW (2012) Glomerular hyperfiltration: definitions, mechanisms and clinical implications. Nature reviews Nephrology 8(5): 293-300.
- Woodard T, Sigurdsson S, Gotal JD, Torjesen AA, Inker LA, et al. (2015) Mediation analysis of aortic stiffness and renal microvascular function. Journal of the American Society of Nephrology 26(5): 1181-1187.
- Schillaci G, Pirro M, Mannarino MR, Pucci G, Savarese G, et al. (2006) Relation between renal function within the normal range and central and peripheral arterial stiffness in hypertension. Hypertension 48(4): 616-621.
- Cherney DZ, Sochett EB, Lai V, Dekker MG, Slorach C, et al. (2010) Renal hyperfiltration and arterial stiffness in humans with uncomplicated type 1 diabetes. Diabetes care 33(9): 2068-2070.
- Lin L, Peng K, Du R, Huang X, Sun W, et al. (2017) High glomerular filtration rate is associated with arterial stiffness in Chinese population. Journal of hypertension 35(2): 385-391.
- Marti R, Parramon D, Garcia Ortiz L, Rigo F, Gomez Marcos MA, et al. (2011) Improving interMediAte risk management. MARK study. BMC Cardiovasc Disord 11: 61.
- (2013) World Medical Association Declaration of Helsinki: ethical principles for medical research involving human subjects. JAMA 310(20): 2191-2194.
- Brien E, Asmar R, Beilin L, Imai Y, Mancia G, et al. (2005) Practice guidelines of the European Society of Hypertension for clinic, ambulatory and self blood pressure measurement. Journal of hypertension 23(4): 697-701.
- Salas Salvado J, Rubio MA, Barbany M, Moreno B (2007) [SEEDO 2007 Consensus for the evaluation of overweight and obesity and the establishment of therapeutic intervention criteria]. Med Clin (Barc) 128(5): 184-196.
- Shirai K, Utino J, Otsuka K, Takata M (2006) A novel blood pressure-independent arterial wall stiffness parameter; cardio-ankle vascular index (CAVI). Journal of atherosclerosis and thrombosis 13(2): 101-107.
- Shirai K, Hiruta N, Song M, Kurosu T, Suzuki J, et al. (2011) Cardio-ankle vascular index (CAVI) as a novel indicator of arterial stiffness: theory, evidence and perspectives. Journal of atherosclerosis and thrombosis 18(11): 924-938.
- Yamashina A, Tomiyama H, Takeda K, Tsuda H, Arai T, et al. (2002) Validity, reproducibility, and clinical significance of noninvasive brachial-ankle pulse wave velocity measurement. Hypertension research 25(3): 359-364.
- Levey AS, Stevens LA, Schmid CH, Zhang YL, Castro AF, et al. (2009) A new equation to estimate glomerular filtration rate. Ann Intern Med 150(9): 604-612.
- Peralta CA, Jacobs DR, Katz R, Ix JH, Madero M, et al. (2012) Association of pulse pressure, arterial elasticity, and endothelial function with kidney function decline among adults with estimated GFR >60 mL/min/1.73 m(2): the Multi-Ethnic Study of Atherosclerosis (MESA). American journal of kidney diseases 59(1): 41-49.
- Kubozono T, Miyata M, Ueyama K, Nagaki A, Hamasaki S, et al. (2009) Association between arterial stiffness and estimated glomerular filtration rate in the Japanese general population. Journal of atherosclerosis and thrombosis 16(6): 840-845.
- Ratto E, Leoncini G, Viazzi F, Vaccaro V, Falqui V, et al. (2006) Ambulatory arterial stiffness index and renal abnormalities in primary hypertension. Journal of hypertension 24(10): 2033-2038.
- Eriksen BO, Stefansson VT, Jenssen TG, Mathisen UD, Schei J, et al. (2017) High Ambulatory Arterial Stiffness Index Is an Independent Risk Factor for Rapid Age-Related Glomerular Filtration Rate Decline in the General Middle-Aged Population. Hypertension 69(4): 651-659.
- Ogna A, Forni Ogna V, Bochud M, Guessous I, Paccaud F, et al. (2016) Association between obesity and glomerular hyperfiltration: the confounding effect of smoking and sodium and protein intakes. European journal of nutrition 55(3): 1089-1097.
- Briet M, Boutouyrie P, Laurent S, London GM (2012) Arterial stiffness and pulse pressure in CKD and ESRD. Kidney international 82(4): 388-400.
- Licht CM, De Geus EJ, Penninx BW (2013) Dysregulation of the autonomic nervous system predicts the development of the metabolic syndrome. The Journal of clinical endocrinology and metabolism 98(6): 2484-2493.
- Neuringer JR, Brenner BM (1992) Glomerular hypertension: cause and consequence of renal injury. Journal of hypertension Supplement: official journal of the International Society of Hypertension 10(7): S91-S97.
- Fesler P, Du Cailar G, Ribstein J, Mimran A (2010) Glomerular hemodynamics and arterial function in normal individuals. Journal of hypertension 28(12): 2462-2467.
- Georgianos PI, Sarafidis PA, Liakopoulos V (2015) Arterial Stiffness: A Novel Risk Factor for Kidney Injury Progression? American journal of hypertension 28(8): 958-965.
