 Research Article
Abstract
Introduction: Both body mass index (BMI) and waist circumferences (WC) can be used to predict the clinical outcome of diseases.
Study Objectives: The main objectives of the present study were to investigate the impacts of both BMI and WC on kidney function tests.
Methods and Subjects: This is a retrospective study in which files of diabetic patients were reviewed. A total of 250 files reviewed of which 195 were included. An excel sheet was used to enter the raw data for all patients. The data were analyzed using SPSS version 20. Data were presented as means and standard deviations for continuous variables, and frequencies and percentages for categorized variables. The relationships between variables were computed using T test. The impact of study variables was investigated by One Way Anova test. The significance was considered at α≤0.05. Study findings: Basic findings included high glucose level (about 241 mg/dl), BMI (about 32 kg/m2), and WC (about 98 cm). Sodium mean concentration was 139.44±17.46 mEq/L. The meal level of potassium was 15.10±59.63 mmol/L. The mean of chloride level was 10.23±3.87 mEq/L. The mean level of urea was 17.32±6.46 mg/dl. The mean level of creatinine was 1.93±0.27 mg/dl. The results showed that both BMI and WC predicted the alterations of kidney function tests, except potassium levels were predicted by BMI, but not by WC.
Conclusion: Obesity as measured by BMI or WC predicts the occurrence of diabetes and alterations in kidney function tests. WC did not impact the levels of potassium.
Keywords: Diabetes; BMI; WC; Kidney function test; Glucose; Potassium; Creatinine
Introduction
Diabetic kidney disease (DKD) is a very a severe complication of diabetes associated with microvascular changes and reduction of glomerular filtration rate (GFR), it is also characterized by proteinuria (albuminuria) [1,2]. Up-40% of diabetic patients develop DKA [3]. Obesity is an increasing problem at international level and has been associated with health impacts [4]. Some epidemiological studies reported that the prevalence of overweight and obesity in adults of Taiwan reached approximately 44% [5]. BMI is an index describing both weight and height of a person to provide an approximation of a fat in the body. It is computed by dividing weight (kgs) by height (squared meters). According to BMI, a person can be: underweight (<18.5 kg/m2), normal weight (18.5 to 24.9 kg/m2), overweight (25 to 29.9 kg/m2), and obese (≥30 kg/m2) [6-8] Although body mass index (BMI) is considered as an acceptable measure for obesity categorization at international level, its accuracy in obesity has been questioned through several studies [9-11]. It has been shown that men who have their WC ≥ 102 cm and women with WC ≥ 88 cm were more likely to be overweight. WC between 94 to 102 cm in men, and 80-88 cm in women should be advised not to gain weight [12].
Study Objectives
The main objectives of the present study were to investigate the impacts of both BMI and WC on the clinical outcomes of kidney function tests.
Methods and Subjects
A retrospective study was conducted in which files of diabetic patients were reviewed. A total of 250 files reviewed. Appropriate files were 195 and included in the study. Files of diabetic patients were included if complete information including BMI, WC, and kidney function tests existed. An excel sheet was created to enter the raw data for all patients. The data were analyzed using SPSS version 20. Data were presented as means and standard deviations for continuous variables, and frequencies and percentages for categorized variables. The relationships between variables were computed using T test. The impact of study variables was investigated by One Way Anova test. The significance was considered at α≤0.05.
Results
General Characteristics of Study Participants
Table 1 summarized the general characteristics of study participants. The mean age of study participants was 57.33±11.92 years. The frequency of males was 102 (52.3%). The mean of BMI was 31.81±.
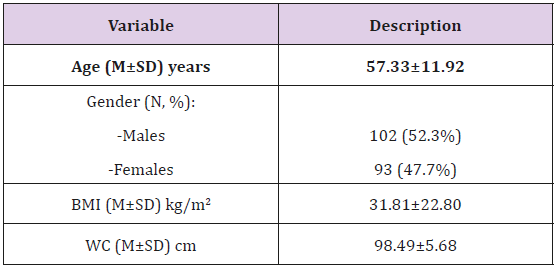
Table 1: General characteristics of study participants.
Biochemical Profile of Study Participants
As shown in Table 2, a group of biochemical tests related to kidney function among diabetic patients was analyzed. Glucose level was 241.72±83.81 mg/dl. Sodium mean concentration was 139.44±17.46 mEq/L. The meal level of potassium was 15.10±59.63 mmol/L. The mean of chloride level was 10.23±3.87 mEq/L. The mean level of urea was 17.32±6.46 mg/dl. The mean level of creatinine was 1.93±0.27 mg/dl. 22.80 kg/m2, and that of WC was 98.49±5.68 cm.
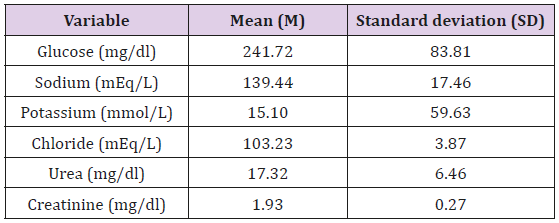
Table 2: Biochemical profile of study participants.
The Relationship between BMI and Biochemical Profile of Study Participants
As demonstrated in Table 3, the relationships between BMI and biochemical tests were investigated using T test. There were strong relationships between BMI and variables included (p=0.000).
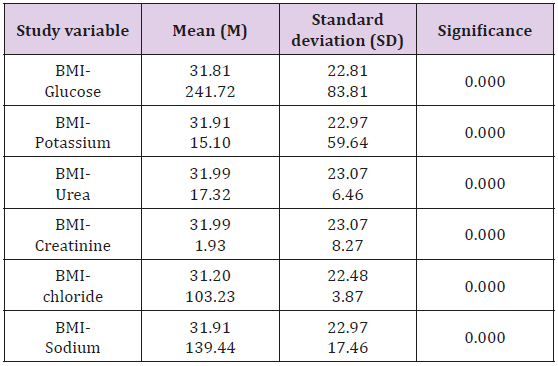
Table 3: The relationship between BMI and Biochemical profile of study participants.
The Relationship between WC and Biochemical Profile of Study Participants
As illustrated in Table 4, the relationships between WC and biochemical tests were investigated using T test. There were strong relationships between WC and variables included (p=0.000).
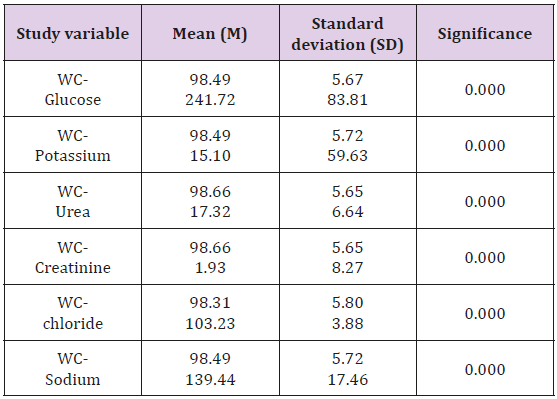
Table 4: The relationship between BMI and Biochemical profile of study participants.
The impact of BMI on biochemical tests among study participants
As shown in Table 5, there was a significant impact of BMI on all biochemical tests included among diabetic patients (p=0.000).
The Impact of WC on Biochemical Tests Among Study Participants (One Way Anova)
As it is demonstrated in Table 6, the impact of WC on biochemical tests among study participants with diabetes was investigated using One Way Anova. The results showed that WC significantly impacted all variables included (p<0.001), except potassium (p=0.216).
Discussion
The presented study investigated the impacts of both BMI and WC on renal function tests among diabetic patients. The mean level of BMI was about 32 kg/m2. WC mean level was about 98 cm. these findings denoted that study participants were more likely to be obese as indicated by other studies [6-8,12]. In general terms, the present study showed that diabetic patients have disturbed profiles of kidney function tests including potassium levels and creatinine (Table 2). This is in line with other studies in which abnormal kidney function tests were detected among diabetics [2,13]. The relationships between BMI and kidney function tests among diabetic patients were statistically significant (p=0.000, for all variables) (Table 3). These findings indicated that obesity as reflected by BMI is a risk factor for developing abnormalities of renal function. These findings agree with previous studies [1,2,13].
The results of the present study showed that WC has significant relationships with all kidney function tests (p=0.000) as shown in Table 4. These results also confirmed that BMI and WC are both significant parameters for assessment of obesity. Previous studies showed the importance of WC in predicting obesity and predicting abnormal kidney function tests among diabetics [1,3]. Using One Way Anova test, we evaluated the impact of both BMI (Table 5), and WC (Table 6) on kidney function tests of diabetic patients. The results showed that Both have significant impacts on all included variables (p≤0.001), except the impact of WC on potassium that was not significant (p=0.216). These results can be explained in view of reported studies such as [1,3,14]. These studies agreed that obesity, as measured by BMI or WC, is a significant predicting of both diabetes and alterations in kidney function tests.
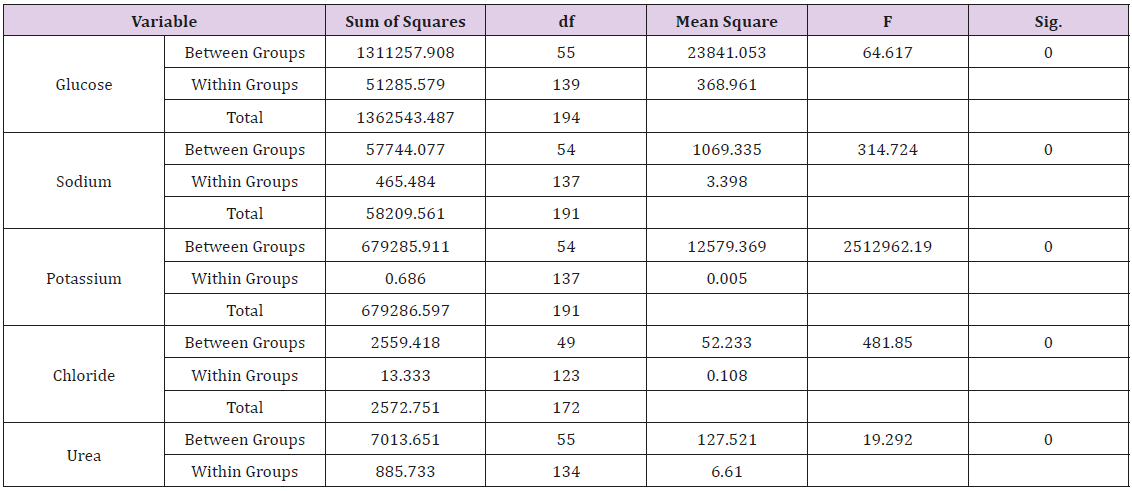
Table 5: The impact of BMI on biochemical tests among study participants (One Way Anova).
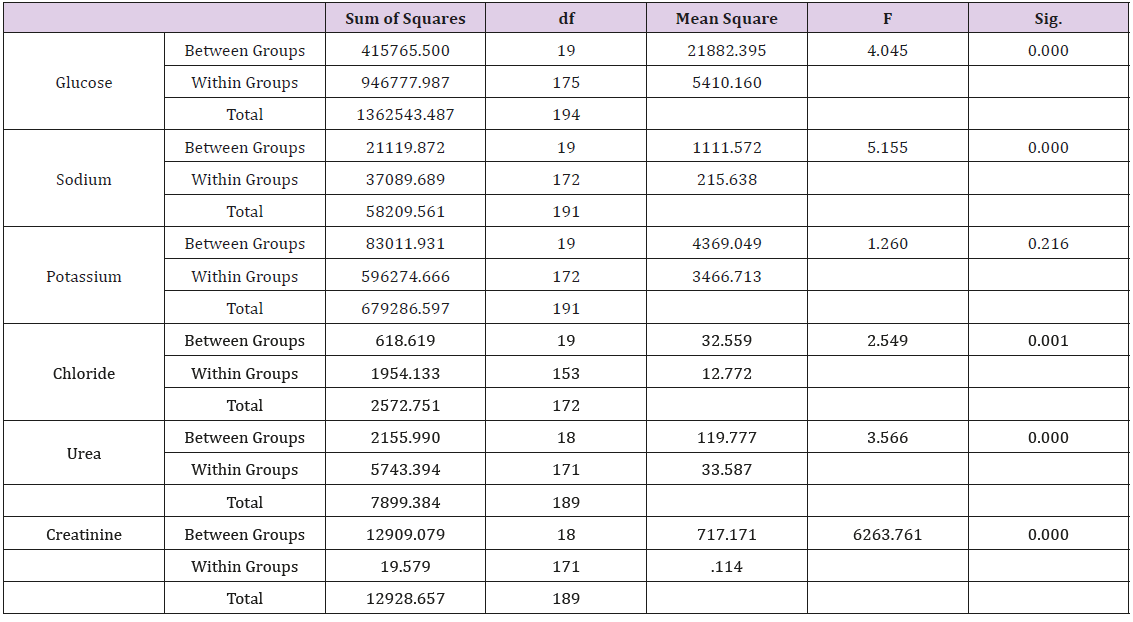
Table 6: The impact of WC on biochemical tests among study participants (One Way Anova).
Conclusion
Obesity as measured by BMI or WC predicts the occurrence of diabetes and alterations in kidney function tests. WC did not impact the levels of potassium.
References
- Macisaac RJ, Ekinci EI, Jerums G (2014) Markers of and risk factors for the development and progression of diabetic kidney disease. Am J Kidney Dis 63(2): S39-62.
- Ryan Eyn Kidd Man, Alfred Tau Liang Gan, Eva Katie Fenwick, Preeti Gupta, Mark Yu Zheng Wong, et al. (2018) The Relationship between Generalized and Abdominal Obesity with Diabetic Kidney Disease in Type 2 Diabetes: A Multiethnic Asian Study and Meta-Analysis. Nutrients 10(11): 1685.
- Gheith O, Farouk N, Nampoory N, Halim MA, Al-Otaibi T (2016) Diabetic kidney disease: Worldwide difference of prevalence and risk factors. J Nephropharmacol 5(1): 49-56.
- Tian-Jong Chang, Cai-Mei Zheng, Mei-Yi Wu, Tzu-Ting Chen, Yun-Chun Wu, et al. (2018) Relationship between body mass index and renal function deterioration among the Taiwanese chronic kidney disease population. Scientific reports 8(1): 6908.
- Yeh CJ, Chang HY, Pan WH (2011) Time trend of obesity, the metabolic syndrome and related dietary pattern in Taiwan: from NAHSIT 1993–1996 to NAHSIT 2005–2008. Asia Pac J Clin Nutr 20: 292-300.
- (2000) Obesity: preventing and managing the global epidemic. Report of a WHO consultation. World Health Organ Tech Rep Ser894: i-xii, 1-253.
- (2004) WHO Expert Consultation. Appropriate body-mass index for Asian populations and its implications for policy and intervention strategies. Lancet 363(9412): 157-163.
- Hales CM, Fryar CD, Carroll MD, Freedman DS, Ogden CL (2018) Trends in Obesity and Severe Obesity Prevalence in US Youth and Adults by Sex and Age, 2007-2008 to 2015-2016. JAMA 319(16): 1723-1725.
- Peterson MD, Al Snih S, Stoddard J, Shekar A, Hurvitz EA (2014) Obesity misclassification and the metabolic syndrome in adults with functional mobility impairments: Nutrition Examination Survey 2003-2006. Prev Med 60: 71-76.
- Caleyachetty R, Meunnig P, Kengne AP (2016) Misclassification of cardiometabolic health when using body mass index categories. Int J Obes (Lond) 40(8): 1332
- Tomiyama AJ, Hunger JM, Nguyen-Cuu J, Wells C (2016) Misclassification of cardiometabolic health when using body mass index categories in NHANES 2005-2012. Int J Obes (Lond) 40(5): 883-886.
- Lean ME, Han TS, Morrison CE (1995). Waist circumference as a measure for indicating need for weight management. BMJ (Clinical research ed.) 311(6998): 158-161.
- Christopher Jepson, Jesse Y Hsu, Michael J Fischer, John W Kusek, James P Lash, et al. (2018) Incident Type 2 Diabetes Among Individuals With CKD: Findings from the Chronic Renal Insufficiency Cohort (CRIC) Study. m J Kidney Dis 73(1): 72-81.
- Cordain L, Eaton SB, Sebastian A (2005) Origins and evolution of the Western diet: health implications for the 21st century. The American journal of clinical nutrition 81(2): 341-354.
