 Research Article
Abstract
Rural areas often have exceeding low First Responder Densities (FRD) which is the crux of poor pre-hospital care that a trauma victim receives, resulting in unacceptable high rural trauma mortality (4-12 folds). Well-executed pre-hospital care generally leads to a reduction in motor vehicle mortalities, yet no mathematical model currently exists that gives a reliable estimate of FRD that a community need. Health policy officials struggle in identifying the best approach to implement a sustainable and pragmatic program and hence need a method to allocate the resources appropriate for the cause. Our study objectives were to quantify the relationship between FRD and multiple unrelated state census data point and develop a model that estimates an FRD needed to reduce motor vehicle mortality rates. Data was collected from census databanks for all 50 states and subset into urban and rural (population less than 500,000). Tweleve rural variables used in the analysis include population density, FRD, total state area (sq. km), number of total hospitals, hospital density (/km), total rural road density, poverty density, median household income, and motor vehicle accident mortality rate. We used a multiple regression analysis to estimate FRD and a simple regression to determine the relationship between FRD and motor vehicle mortality rate. The top model estimating FRD included hospital density, poverty density, and median household income (Adj. R-Sq. = 0.96; P<0.001). FRD was positively associated with hospital density, poverty density, and median household income. FRD was negatively associated with motor vehicle mortality rate (Adj. R-Sq. = 0.54; P<0.001). These models hold the potential for determining rural areas lacking the appropriate level of pre-hospital care, primarily in the United States. Once these areas are determined, the data can be used to justify the need to increase funding towards pre-hospital education and FRD. Specifically, this study will enable us to engage policy makers towards allocating resources for education towards programs like the Million Life Fighter Initiative, Federal Emergency Management Agency, National Transportation Authority, American College of Surgeons and others in prehospital care.
Introduction
Surgical intervention, especially trauma surgery, has gained traction in the public health community in the recent past, with factors such as surgeon density starting to gain consideration in medical and scientific research [1-4]. Even more important than the eventual surgical intervention, however, is the pre-hospital care that the trauma victim receives by way of first responderslimited in this study, to firefighers and EMS personnel. In fact, most trauma-related deaths happen in the field in almost all settings and accidents5. Furthermore, multiple studies have shown that prompt and well executed pre-hospital care by first responders can lead to a reduction in mortality, in both urban and rural settings [6-8]. Even though the importance of first responders is widely agreed upon by the healthcare and public health community, no mathematical model currently exists that gives a reliable estimate of the number of first responders a certain community needs at a given period.
Such modeling has been seen in other fields, including healthcare delivery. The World Health Organization (WHO) presented such a model in 2008 that predicted and modeled the supply, need and demand for physicians in various regions around the world by year 2015. The WHO model was able to forecast a physician shortage in the Africa region by year 2015 and provide a quantifiable rationale to advocate for increased focus on providing physicians in the Africa region [9]. Such modeling, however, has yet to be developed for first responders and emergency medical technicians. We believe that the lack of such a model is due to the unavailability of data to evaluate the impact that currently active first responder training programs have had on their respective communities. As such, we propose a pilot model aimed at quantifying the appropriate number of first responders needed in a geographic area. Although our model can be flexibly applied to different settings, we chose to focus on Motor Vehicle Accidents (MVAs) in the rural United States, since data for MVAs are relatively readily available and rural fatality rates for a wide variety of injuries, including MVAs, have been found to be twice as high as urban rates [10-12].
Many organizations including the Million Life Fighter Initiative have concentrated their efforts on bridging the gap between urban and rural MVA mortality rates. This study might help them understand the appropriate resource allocation (for things such as first responder education and training) to improve mortality outcomes in rural areas.
Methods
Data Collection
Our main goal was to solely address first responder density in rural areas and exclude urban centers where first responder density is inflated. To address this issue, we subset the data into urban and rural for each state. We classified urban centers as those cities which had greater than 500,000 population within the city limit boundary. The corresponding data for that city was then removed from the total data set for that particular state to obtain a total rural area data set. If there was more than one city with greater than 500,000 people, all data from those urban cities was totaled and then subtracted from the total data set. Despite the potentially variable geological aspect of city limits, we used city limit boundary due to the ability to reduce our data set into rural or urban across all variables nationwide. Some cities might fall below the 500,000 population within citylimit threshold but combined with other cities forms a large metropolitan area that is above 500,000 people.
This is a limitation of the study along with boundary and future research would focus on more regional effects (i.e. sub city boundary) where combined population effects (i.e. small area population density) regardless of boundary can be addressed. Due to the infrastructural differences in Hawaii and Alaska compared to continental states, the analysis was limited the lower 48 states (Figure 1).
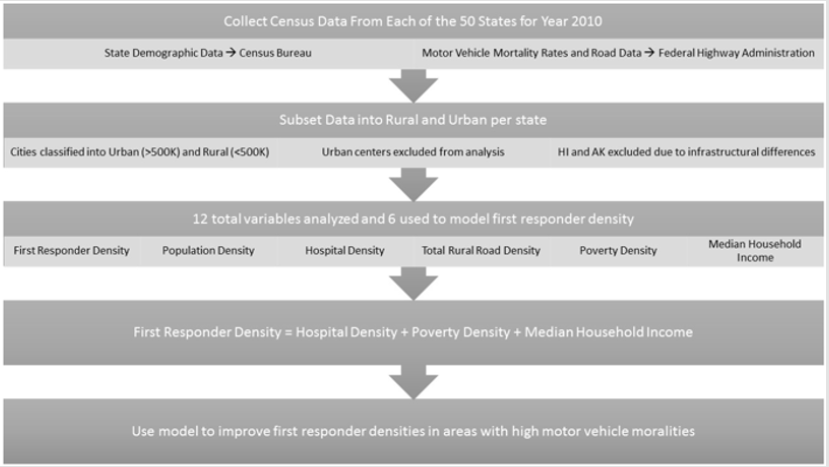
Figure 1: Data collection flow and methodology.
Population Demographic Data
To address the issues of low first responder density and the relationship to MVA we gathered census data from each state for the year 2010. We collected state demographic data from the US Census Bureau [17] as well as information on motor vehicle mortality rates. The 2010 census data was used so that we could obtain a complete data set with the most current data set.
Federal Income and Poverty
Income and poverty data were collected from the US Census Bureau Small Area Income and Poverty database [13]. Poverty is defined as family whose total income is less than the calculated US threshold based on the size of the family and childred under 18 years old. When the total family income is below the standard threshold for that year, they are considered living in poverty for that year of census data. Income data was collected by county and reduced to exclude those areas which had urban areas greater than 500,000 people. Poverty density was calculated using the total number of people in poverty across all age groups divided by the total state area (i.e. state rural area). Median household income represents the average county median household income for that state excluding the urban center areas. Median household income can provide an overall income status index of that area while poverty just represents the total amount of people who are at the lower end of the financial spectrum. Thus, median household income and poverty density can provide insight into the overall and lower end finical status of an area.
Federal Highway Data
Total rural road data was collected from the Federal Highway Administration [14] 2010 highway statistics. Road data includes all roads that are not directly located within an urban (i.e. city streets) area. Data was collected by county and then reduced to exclude those areas that had urban centers greater than 500,000 people. Total road density was calculated by summing the total number of miles of roads divided by the total state area. Road speed limit was not used in the study due to the high variability in speed limits across the nation and the inconsistency for people to follow recommended speed limits. Future research focused on a regional basis, however, could include average speed or speed limits as a potential variable.
Predictor Variables
Initially, we collected 12 variables that include: state total area (km2), total population, number of drivers over the age of 75, number of drivers under the age of 25, number of surgeons, number of EMTs, number of firefighters, number of hospitals, number of deaths related to motor vehicle accidents, total length of roads, number of people in poverty, and median household income, for each state. From these variables, we calculated density and per-capita estimates that include total population density, surgeon density, hospital density, first responder density (firefighters + EMS), total rural road density, and poverty density, as well as motor vehicle deaths per 100,000 people. First responder density and hospital density were scaled to represent the number of first responders and hospitals per 1000 km2.
Statistical Analysis
Initial data was right skewed (i.e. positive skewed) due to the high densities associated with more urban states or states who still have a relatively high rural area density. The variables were natural log transformed to achieve a normality prior to data modeling. Comparisons among the full data set and first responder density were analyzed using Pearson’s Correlation Coefficient. Five variables including: population density, hospital density, total rural road density, poverty density, and median household income were significantly related to first responder density. We used these five variables as our explanatory variables. A multiple regression model was developed to estimate first responder density given our set of five independent variables. Stepwise selection was used to choose the best fit model. We used a simple linear regression to determine the direct relationship between first responder density and motor vehicle mortality rate. Our dependent variable was first responder density and our explanatory variable was motor vehicle mortality rate. Plots of the residuals showed approximate compliance with assumptions in both models. Data analysis was completed in SAS 9.4 using PROC CORR and PROC REG for the correlation and regression analysis respectively.
Results
Correlation Analysis
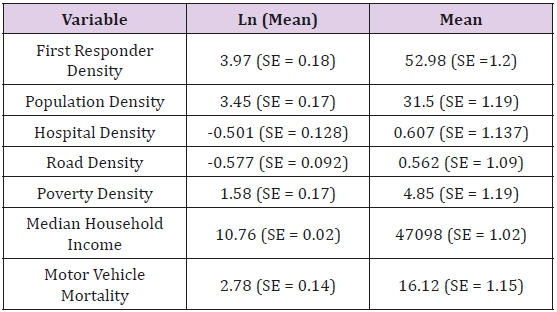
Table 1: The natural log mean and back transformed mean for our dependent variable (first responder density) and our independent predictor variables. Density estimates are found by dividing the total value by the state area. Values represent mean values across all 48 state for rural areas or the state minus urban centers greater than 500000 people.
The mean and Standard Error (SE) that correspond to each of the top six independent variables and first responder density are represented in Table 1. First responder density was positively correlated to hospital density (r = 0.909; P <0.001), population density (r = 0.78; P <0.001), total rural road density (r = 0.84; P <0.001), poverty density (r = 0.964; P <0.001), and median household income (r = 0.31; P<0.03). First responder density was significantly correlated to surgeon density (r = 0.777; P <0.001), however surgeon density was also highly correlated to hospital density (r = 0.948; P <0.001). Therefore, we did not include surgeon density in the multiple regression model to avoid multicollinearity. When looking at the simple direct relationship between responders and mortality, first responder density was inversely correlated to motor vehicle mortality rate (r = -0.741; P <0.001).
Multiple Regression Analysis
Stepwise model selection resulted in a significant three variable model estimating first responder density (F=359.5; df = 47; P <0.001). First responder density was positively related to hospital density (β= 0.38; SE = 0.086; P<0.001; Table 2), poverty density (β=0.755; SE = 0.063; P <0.001; Table 2), and median household income (β= 0.78; SE = 0.235; P = 0.002; Table 2). The variables that were selected explained 96% of the variation found in first responder density (Adj-R2 = 0.958). Not included in the top model was population density and total rural road density. Analysis of variance inflation factor indicated little multicollinearity.
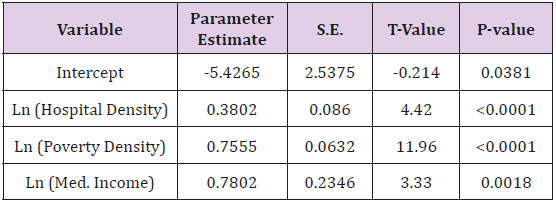
Table 2: The results of the stepwise model selection for a multiple regression model predicting first responder density from a set of 5 variables. The data were natural log transformed to achieve normality. The top variables estimate first responder density include: hospital density, poverty density, and median household income. The coefficient of determination was 0.958.
Simple Regression Analysis
The simple regression showed significant inverse relationship (β= -0.949; SE = 0.127; P <0.001; Figure 2) between motor vehicle mortality rate and first responder density (F = 56.03; df = 47; P < 0.001). First responder density explained 54% of the variation motor vehicle mortality rate (Adj-R2 = 0.539).
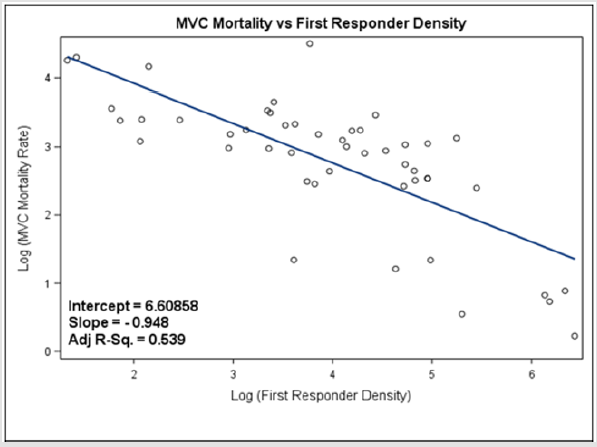
Figure 2: The simple regression between motor vehicle (MVC) mortality rate and first responder density. Most notable is the inverse relationship between mortality rate and the number of first responders.
Model Validation
From our data set, there was an average of 16 MVC mortalities per 100,000 people (Table 3). Using the simple linear equation from above to predict the number of first responders needed (i.e. first responder density = 6.61 - 0.948 x ln(MVC)), to achieve the average number of MCV mortalities, an area would need approximately 55 first responders per 1000 km2. These values follow the trend seen in the data as Wyoming had 4 first responders per 1000 km2 with an average MVC mortality of 28 per 100,000 people while Mississippi had 37 first responders per 1000 km2 with an average mortality of 22 per 100,000 people and Rhode Island had 622 first responders per 1000 km2 with an average of 6 deaths per 100,000 people.

Table 3: The approximate number of first responders needed in rural areas using the simple linear regression model. The first responder density needed represents the estimated density of first responders needed to achieve at least the national average in motor vehicle deaths.
Discussion
We presented two preliminary models: one that correlates first responder density to motor vehicle accident mortality and another that demonstrates the relationship between first responder density and 3 distinct variables. These are the first models developed to determine the first responder density required in a community to reduce prehospital mortality. The multiple regression model demonstrated that FRD is associated with hospital density, median household income and poverty rates. Logically, first responder density directly relates to median household income and hospital density. The wealth of a community directly correlates to access to a trauma center; thus, an increased median household income should mirror the hospital density of a region [15]. Likewise, the increased hospital density correlates to an increased surgeon density. A study conducting a retrospective analysis of a total of 3225 counties in the United States, showed that a higher density of surgeons in an area correlated directly with a significant reduction in MVA associated mortality.1 More specifically, this same analysis showed that an increase of 6.3 surgeons was correlated with 1 less MVA crash death [4].
We were surprised to find that poverty rates positively correlated to first responder density. Hospitals that disproportionately serve Medicaid patients are more likely to close because of decreased financial stability and lower quality of hospital care [13]. However, in areas with higher poverty rates, the public hospital serves as a key source of employment, such that more people are involved in the hospital [13]. Likewise, patients in poverty are more likely to present with a serious illness or trauma, reinforcing the need to bolster the trauma systems [5]. There are many limitations to this preliminary modeling. To eliminate urban centers, this study chose to eliminate cities of 500,000. However, this does not eliminate an area’s access compared to time. This specific weakness could be address by eliminating any areas that have access to a level I or II trauma center within 60 minutes [15]. Similarly, this study does not look at regional differences. Cities in the rural northeast are located in a region with increased hospital density compared to rural cities in West Texas [16]. Determining a stronger regional model with specific road density could strengthen this model.
This model, though preliminary, has the potential to help allocate state and federal funds to first responders [5,6]. Likewise, this model can drive education programs for healthcare professionals as well as lay person. Currently, the ACS is supporting “Stop the Bleed,” a novel education program dedicated to teaching lay people to stop a hemorrhage [9]. Similar methods could be used to train lay people in first responder. Improving on different funding and education models for first responders we may be able to reach our goal to decrease the incidence of motor vehicle accident mortality [4,7].
Conclusion/Future Directions
Our study concluded that the most relevant factors in predicting first responder density were hospital density, poverty density, and median household income. The rural road density and population density were not significant and therefore not included in the final model. The data were heavily skewed and were natural log transformed to effectively analyze the data. The data was likely skewed due to the relatively high population density in rural areas of north eastern states. Future modeling would subdivide the states into regions and develop region specific models that expand upon our preliminary models. Nevertheless, the model did have an interesting paradox in that first responder density increased with increases in poverty density and with median household income, two seemingly opposite parameters. This paradox might be attributable to how first responder programs are currently funded. At the State level, increased grant money for more poverty-stricken areas might be responsible for an increased first responder density. Areas with increased median household income, on the other hand, could signify more affluent areas thus more money invested in health care via large tertiary care centers or better funded hospital systems.
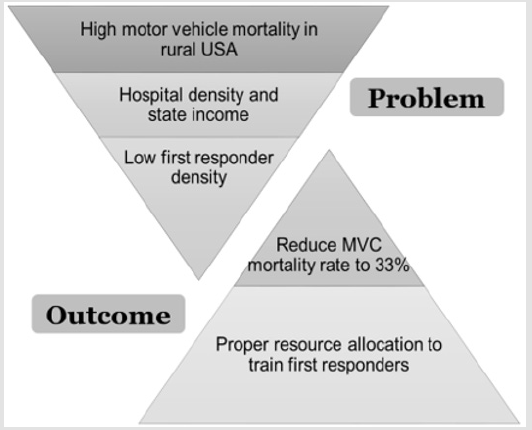
Figure 2: The results of this study will allow states to make informed decisions to reduce the motor vehicle mortality rates. These preliminary models allow for the proper allocation of resources needed to improve first responder densities and properly train first responders. Overall, these models will help reduce motor vehicle mortality rates in rural areas.
Overall, these models can be used to improve the pre-hospital care that a trauma victim receives in rural areas, specifically in the rural United States (Figure 3). This improvement in pre-hospital care has the ability to reduce motor vehicle mortality rates and our model predicts that a first responder density of 55/1000 km2 can achieve a MVC mortality rate of 16/100000 (the national average). Proper allocation of resources to increase the density of first responders, in addition to increasing training/education for first responders, can lower motor vehicle mortality rates in such rural areas (Figure 2). Results from this study will facilitate informed decision making towards improving resource allocation for first responder density, with the overall goal of reducing motor vehicle mortality rates in the rural United States.
Author Contributions
Mayank Aranke, Manisha Bhatia, Arpita Vyas and Dinesh Vyas were involved with the conception and development of the study. Grant Sorensen, Mayank Aranke, Manisha Bhatia, and Dinesh Vyas were involved with data collection; Grant Sorensen, Shengping Yang, and Dinesh Vyas were involved with data analysis and interpretation. Grant Sorensen, Mayank Aranke, Manisha Bhatia, and Dinesh Vyas were involved with writing the article. Dinesh Vyas, Arpita Vyas were involved with the approval of the final version.
References
- Aekka A, Abraham R, Hollis M, Boudiab E, Laput G, et al. (2015) Prehospital trauma care education for first responders in India. The Journal of surgical research 197(2): 331-338.
- Dinesh Vyas MD, Rohit Abraham MAT, Mayur Narayan MD, Arpita Vyas MD (2015) Strategically Leapfrogging Education in Prehospital Trauma Management: Four-Tiered Training Protocols. American Journal of Robotic Surgery 2(1): 9-15.
- Dinesh Vyas,Kaivalya Deshpande, BS, Arpita Vyas (2019) Global Health Epidemic (Earthquake to Road Traffic Accident): Innovative Disaster Pedagogy Harnessing Technology. Biomed J of Scientific and Technical Research 21(1): 15565- 15568.
- Chang DC, Eastman B, Talamini MA, Osen HB, Tran Cao HS, et al. (2011) Density of surgeons is significantly associated with reduced risk of deaths from motor vehicle crashes in US counties. J Am Coll Surg. 2011 May;212(5): 862-866.
- Mock C (2003) Improving prehospital trauma care in rural areas of low-income countries. J Trauma 54(6):1197-8. PubMed PMID: 12813343.
- Pons PT, Markovchick VJ (2002) Eight minutes or less: does the ambulance response time guideline impact trauma patient outcome? J Emerg Med 23(1): 43-48.
- Husum H, Gilbert M, Wisborg T, Van Heng Y, Murad M (2003) Rural prehospital trauma systems improve trauma outcome in low-income countries: a prospective study from North Iraq and Cambodia. J Trauma 54(6): 1188-1196.
- Peleg K, Pliskin JS (2004) A geographic information system simulation model of EMS: reducing ambulance response time. Am J Emerg Med 22(3): 164-170.
- Scheffler RM, Liu JX, Kinfu Y, Dal Poz MR (2008) Forecasting the global shortage of physicians: an economic- and needs-based approach. Bull World Health Organ 86(7): 516-523B.
- Eberhardt MS, Ingram DD, Makuc DM, et al. (2001) Urban and Rural Health Chartbook: Health, United States, 2001. Hyattsville, Md: National Center for Health Statistics.
- Baker SP, Whitfield RA, O’Neill B (1988) County mapping of injury mortality. J Trauma 28(6): 741-745.
- Baker SP, O’Neill B, Ginsburg MJ, Li G (1992) The Injury Fact Book. (2nd). NY: Oxford University Press Inc. New York, USA.
- (2010) Small Area Income and Poverty Estimates. State and County Estimates. US. Census Bureau.
- (2010) Federal Highway Administration (FHWA). Highway Statistic Series. Highway Statistic 2010.
- Carr BG, Bowman AJ, Wolff CS, Mullen MT, Holena DN, et al. (2017) Disparities in access to trauma care in the United States: A population-based analysis. Injury 48(2): 332-338.
- Ko M, Needleman J, Derose KP, Laugesen MJ, Ponce NA (2014) Residential segregation and the survival of U.S. urban public hospitals. Med Care Res Rev 71(3): 243-260.
- (2010) US Census Bureau. 2010 United States Census.
