 Mini Review
Abstract
To uncover the physiological phenomena during sleep, we have done the heart rate variability measurement for a sub-healthy female subject as a case study. The measurement was transformed into frequency domain and represented in a 3D real time spectrum which produced by Visual Signal (VS) software. From the real time plot, we found a peculiar low frequency vibration of 0.01 Hz. In other words, there were vibrations occurred every 100 heartbeats. Such phenomenon may indicate a profound biological action. It may require more research for the explanation.
Introduction
For this case study [1,2], we recruited one of our colleagues, a sub-healthy female of age 30, as the subject. Guided by ECG measurement specification, the subject was attached with electric sensors to record the heartbeat patterns during her sleeping period. The measurements took 6 hours.
Methods
The ECG spectrum can serve for digital signal analysis [3,4]. We extracted the RRI list. The vertical scale is the time of RR interval and the horizontal the measuring time. On this plot, we excerpted only one hour from the whole data. From the RRI list, we did Fourier Transform in the real time mode. The middle figure on Figure 1 shows a 3D like frequency spectrum in real time. The vertical scale is the frequency spectrum, and the amplitude is displayed in color depth. The figure was created by Visual Signal software (VS, designed by AnCAD, Taipei, Taiwan, ROC). On the lowest figure in Figure 1, we amplified the lower frequency region for the frequency scale by showing its log scale.
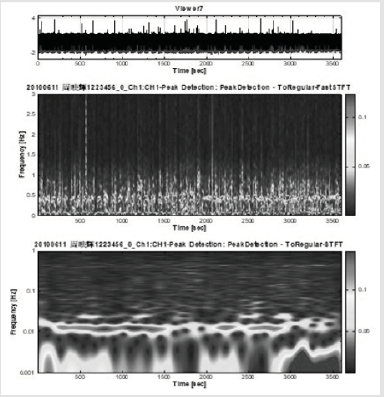
Figure 1: The upper plot shows the RRI spectrum. The middle plot shows the frequency spectrum in real time. And the lower one is the log scale on the frequency axis.
Research Tool
The Visual Signal is a digital signal processing tools, designed by Dr. Wang, to manipulate the experimental data and display the data in 2D or 3D figure. Based on the principle of digital signal processing, VS transforms digital signals from time domain into frequency domain or back and forth with different strategies. The VS has been largely used in the research with ECG, EMG, EEG and so on.
The Very Low Frequency Phenomenon on RRI
At the low frequency region, on the lowest picture of Figure 1, there was a peculiar rhythm appeared. We can see a horizontal train standing at around 0.01 Hz. In other words, there had to be a vibration happened every 100 seconds during the sleeping state. We could not guess what caused such phenomenon. This phenomenon was not recorded on any medical textbooks. We report this finding to invite more research for the explanations. The heart rate variability is a new field in medical diagnosis field after all [5].
Conclusion and Suggestions
The low frequency component revealed by VS may be a personal problem or perhaps a general phenomenon. To solve the riddle requires more research with engineers and medical doctors working together. The interval peaks perhaps reveal some biological truth worthy of unveiling.
References
- Zhu G, Wang C, Liu F, Tang L, Zheng J (2018) Age-related network topological difference based on the sleep ECG signal. Physiol Meas 39(8): 084009.
- Christensen MA, Dixit S, Dewland TA, Whitman IR, Nah G, et al. (2018) Sleep characteristics that predict atrial fibrillation. Heart Rhythm 15(9): 1289-1295.
- Jeon S, Oh S, Cho SJ, Lee YJ, Kim SJ (2019) Association between snoring and heart rate variability in adolescents: effects of gender and insufficient sleep. Sleep Breath.
- Garcia JE, Shrestha M, Howard SR, Petersen P, Dyer AG (2019) Signal or cue: the role of structural colors in flower pollination. Curr Zool 65(4): 467-481.
- (1996) Heart Rate Variability, European Heart Journal 17: 354-381.
