 Research Article
Abstract
Objective: RFID requirements specifications on test methods for the assessment of the performance of RFID systems in health care settings are limited. This paper proposes a systematic and detailed approach to analyze and assess the performance of an RFID system in the context of the particular healthcare setting in which it will be deployed. The ultimate aim is evaluating the merits of Radio Frequency Identification technology (RFID) in analysing to what extent the transfusion blood chain within an academic hospital setting complies to European and Dutch guidelines and regulations on preservation of Red Blood Cells (RBCs).
Methods: The compliance of the RFID technology to functional requirements was assessed by data validity and completeness tests. Within the first set of tests, the RFID tags were tested on their generation of accurate location, time and temperature data in a laboratory and simulated controlled field setting. Within the second set of tests, the accuracy of the data concerning timestamp, temperature and location data generated by the tags was assessed within a real field setting that resembled the actual healthcare setting of RFID deployment.
Results: The active tags were able to monitor the whole range of temperatures that RBCs could achieve in the transfusion chain. Second, based on the accuracy test concerning the speed of temperature adjustment, it was assumed that the tags were able to adjust to new temperature circumstances more quickly than the RBCs themselves, and were therefore considered fast enough to measure temperature changes. The completeness of the RFID generated datasets concerning location, time and temperature of the RBCs varied from 90% to 100%; data sets from only 13 tags were missing after they had left a certain location within the facility.
Conclusions: The data generated by the active tags used in this study was of sufficient quality for monitoring the RBCs’ temperatures and whereabouts inside our hospital setting. This study shows that data quality studies should precede full implementation of RFID to assess the feasibility of using similar technology in particular healthcare settings.
Keywords: Radio Waves; Automatic Data Processing; Blood Transfusion; Geographic Information Systems; Temperature; RFID; Technology; Data Quality
Introduction
Radio Frequency IDentification (RFID) is an emerging technology within hospital settings that can improve patient safety, operational, logistic processes and clinical procedures. RFID has for example shown to reduce retained surgical instruments errors as one of the most serious preventable complications in operating room settings, [1] improve detection of surgical sponges during surgery to prevent retaining of gauze sponges inside the body causing complications [2], and traceability of mixed intravenous medication from the beginning to the end of the process of prescription-validation-dosing-preparation-administration [3] significantly improve hand hygiene compliance [4] and monitoring of hospitalized patients or detect and prevent them from bed falls [5-6], and to improve standardization and documentation of key steps within the blood collection and transfusion process in blood banks and hospitals [7].
RFID systems contain 2 basic components: tags and readers. Tags are attached to people or objects and transfer their data to readers using radio waves. An active tag contains a battery and is able to collect and transfer data, such as temperature, humidity, location and its identity, without necessarily being activated by the electromagnetic field generated by a reader. In contrast, a passive tag does not contain a battery and is only able to transmit data while being activated by the electromagnetic field generated by the reader [8]. In comparison to other current identification technologies, RFID seems to be the most promising. For instance, barcodes on medical products have the disadvantage that they require active user interaction and that they must be read in a straight line [9]. Moreover, multiple barcodes on products, including those codes containing irrelevant information from previous steps in the process, might generate incorrect information when the wrong barcode is being scanned further in the process [10]. RFID has the advantage of transmitting data for multiple objects simultaneously, through physical barriers and from a distance. RFID tags can also hold more and more up-to-date information and can generate more accurate data in relation to information systems depending on hand-based data entry [10].
In general, new information and communication technologies might bring new risks to patient health or data quality issues through for example errors in computer software. Studies on pilot testing of RFID systems within hospital settings show, for instance, harmful electromagnetic interference on medical equipment and concerns about the potentials and obstacles to the adoption of these technologies [11-15]. Several factors within a hospital setting might influence the performance (needs) of a RFID system . First, environmental factors, like aluminium films, liquid, metal and concrete walls might influence the performance and quality of data generated by a RFID system [11]. When for example radio waves broadcasted by RFID tags are blocked by fluids, such as Red Blood Cell products (RBCs), the data may not reach the reader resulting in incomplete data. Second, RFID systems themselves might influence the performance of physical objects in their environment through for example electromagnetic interference (EMI) on medical equipment [12-15]. EMI subsequently might jeopardize the care processes and compromise patient safety. Finally, the specific aims of implementing a RFID technology set specific requirements on the data to be generated [11].
The aim of this study is to report on the results concerning the assessment of the accuracy and completeness of location, time and temperature data generated by an active RFID system used for the tracking and tracing of RBCs inside an academic hospital. The steps followed in this validation study are part of a framework we developed earlier based on a literature review concerning RFID implementation strategies in healthcare. This framework can be used for assessing the potential influence of environmental factors within health care settings on the performance of a (to be implemented) RFID system and vice versa [11]. The framework consists of 9 phases, including the development of an RFID implementation plan, RFID and medical equipment interference tests, data accuracy- and data completeness tests to be run in laboratory, simulated field and real field settings. The specific steps concerning the phases of this framework dealing with these kinds of data accuracy and completeness tests are displayed in Figures 1&2. In the validation study reported here, we explain how we performed the data accuracy and data completeness tests in a laboratory, simulated field and the real field setting of the blood transfusion chain: the Operating Room (OR) theatre and Intensive Care Unit (ICU) of an academic hospital.
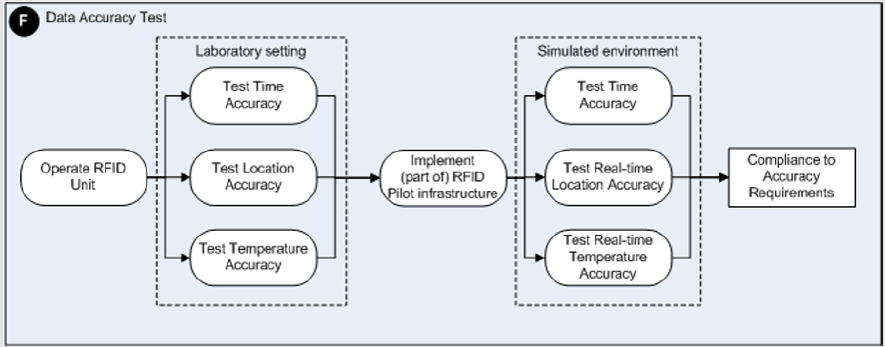
Figure 1: A schematic overview of the detailed steps to be taken to perform RFID data accuracy assessments.

Figure 2: A schematic overview of the detailed steps to be taken to perform RFID data completeness assessments.
An assessment study on possible Electromagnetic Interference (EMI) by RFID on medical equipment within our academic hospital setting, representing phase E of our framework, showed that RFID technology might indeed induce potentially hazardous incidents in medical devices in a controlled trial setting on-site [12]. The last phase I of our framework concerns the actual evaluation of the added value of a RFID technology in the context of the aims set for introducing an RFID system. After the data validation study described in this paper, we evaluated whether the management of blood transfusion chain concerning RBCs complied to European and Dutch guidelines by tracking and tracing these RBCs with our RFID system inside our hospital.
Methods
Background
This study was performed within the Academic Medical Center (AMC), a large university hospital in Amsterdam, The Netherlands. The AMC is a 1002 bed hospital including 21 outpatient clinics, 34 inpatient clinics, 5-day care units, employing 960 full time equivalent clinicians in total. The study was conducted at the OR complex and the ICU and was part of the project ‘RFID in health care’. This project was initiated and sponsored by the Dutch Ministry of Health, Welfare and Sport. The main reason for introducing RFID in the AMC is to assess the quality of the blood transfusion chain itself inside the hospital setting in reference to intra-hospital guidelines based on European and Dutch guidelines concerning the storage, transport and distribution conditions of RBCs [16]. These guidelines prescribe the following:
a) erythrocyte concentrates have to be preserved within an environment with a temperature between 2°C and 6°C
b) erythrocyte concentrates have to be transfused within 1 hr after they have left a validated cooling system
c) erythrocyte concentrates have to be transfused within 24 hrs once they have exceeded a temperature of 10°C
d) unused erythrocyte concentrates are to be returned to the blood transfusion laboratory within 24 hrs after they left the transfusion laboratory.
RFID System
The selected active RFID system (Eureka RFID, Avonwood, UK) has a 125 kHz reader (68x10E-3 μT at 1m) that forces data transmission by any tag in its proximity. The active RFID tags have an operational frequency of 868 MHz at 2μW. RFID active tags containing a temperature sensor will be used for tracking and tracing of the RBCs.
On one side of the tag a copper pin is pointing out. This pin senses the temperature at its surface and guides the temperature to the actual sensor positioned inside the tag. Temperature data can be stored on the tag itself or immediately be broadcasted, in combination with other data- like a RBC’s location, to the reader at predefined timestamps or when being inside the field of the reader that forces data transmission by the tag in its proximity. Within this validation study, tags were placed inside plastic containers that were attached to the blood bags surfaces with the copper pins placed towards the blood bags surfaces.
After data transmission by a tag, the receiver sent data concerning the tag’s identification, its current location, the current time, the current temperature sensed by the temperature sensor and possible other data, like for example its battery status, through the local area network (LAN) to a central Oracle 10g database. Every 8 minutes, a temperature sensor would additionally record temperature data in its memory for final storage in this database.
Data Requirements
The requirements concerning time, temperature and location data to be generated by the RFID system data were set with reference to the intra-hospital guidelines concerning the storage, transport and distribution conditions of RBCs and concerned the following:
a. The RFID tags should be able to record and broadcast temperatures with an accuracy of 0.5 ˚C, with a maximum difference of 1.0 ˚C compared to the actual temperature and within the range of - 10.0˚C to plus 30.0˚ C
b. The temperature sensors should adjust to new temperature circumstances more quickly in relation to the temperature adjustment of the object being sensed,
c. the RFID system should be able to discriminate between RBCs located in different rooms inside the hospital building
d. the RFID system should be able to track the movements of RBCs between these rooms in the right sequence. For the tracking and monitoring of RBCs in real time
e. location and temperature data and their corresponding timestamp data should be recorded with an accuracy of 0,5 second maximum difference compared to the actual times.
The temperature ranges were chosen on the basis of the prescribed temperatures for environments where RBCs have to reside in natural circumstances. RBCs have to be preserved within an environment of 2.0 ºC up to 6.0 ºC at all times but might reside in environments of room temperature during transport or just before transfusion. The specification of the required accuracy concerning location data was inferred from the different activities that take place inside different hospital rooms, i.e. transport at corridors, storage inside storage rooms and transfusions at the OR and ICU. The specification of the required accuracy of the corresponding timestamps was to realize the generation of data about the whereabouts and conditions of RBCs as close to reality as possible.
Data Accuracy Tests in A Laboratory and Simulated Controlled Field Setting
Laboratory Setting: The RFID tags were tested on their generation of accurate location, time and temperature data in a laboratory setting first. Figure 1 displays the steps defined in the framework and to be taken in relation to the RFID data accuracy assessments to be performed. The accuracy of time and location data was tested with 15 randomly chosen tags of a total of 37 tags and 2 readers. To simulate a ‘gate’ way, we installed the 2 readers on one doorway. In testing the accuracy of the location and time data generated, test persons carried up to 15 tags in different positions through the gate. The accuracy of the temperatures generated by 17 tags, randomly chosen out of a total of 37, was tested in water baths with temperatures similar to temperatures of the environments where RBCs reside in real-life circumstances. These 17 tags were placed in water baths of stable predefined temperatures of 3.2ºC and 23.0ºC during periods of 2 and 6 hours respectively. The temperatures generated by these tags were compared to the temperature recordings of 3 official calibrated temperature data loggers. During the indicated periods of 2 and 6 hours, the water baths showed stable temperatures.
After the 2- and 6-hours’ time intervals, the temperature data were downloaded from the tags and compared to recordings of the three temperature loggers. Median values of temperatures were recorded and their ranges were calculated and analyzed. The values concerning the accuracy of the temperatures generated by 17 tags are displayed in Figure 3. During the second temperature test 13 tags randomly chosen out of a total of 37, were assessed for their accuracy concerning real-time temperature measurements and real-time broadcasts of temperature data. The tags were placed in water baths of stable pre-defined temperatures of 1.0, 2.0, 5.0, 12.0, 16.0, 23.0 and 37.0°C. After the tags reached a stable temperature, the temperature data generated and broadcasted by the 13 tags were read by a reader and compared to temperatures indicated by a quicksilver thermometer. Average values and their ranges were calculated and analyzed. The values concerning the accuracy of the temperatures generated by these 13 tags are displayed in Table 1.
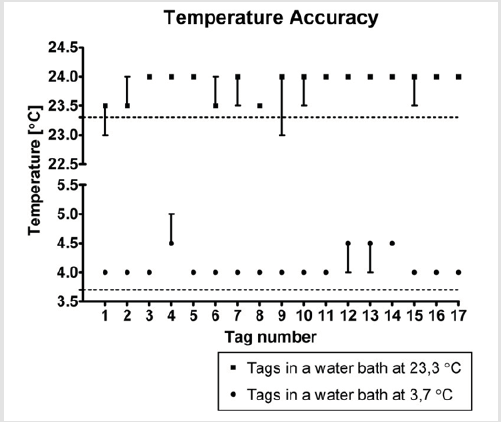
Figure 3: Median values and ranges concerning the temperatures recordings of 17 randomly chosen RFID temperature tags in relation to the temperature’s measurements by the data loggers.
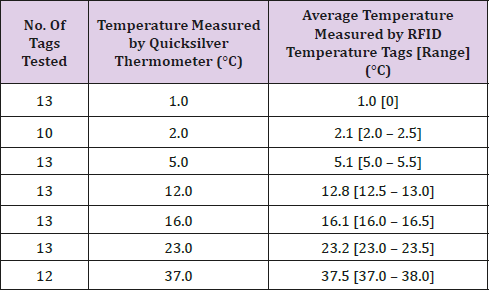
Table 1: The temperatures generated and broadcasted by the tags and their average values and ranges in relation to temperatures measured by the quicksilver thermometer in water baths varying from 1.0°C to 36.0°C.
Simulated Controlled Field Setting: Second, the accuracy of time stamp and location data generated by 10 tags randomly chosen out of a total of 37, and the entire RFID infrastructure was tested within a simulated controlled field setting. During 10 predefined test rounds data concerning time stamps and locations were recorded by hand and compared with the RFID data stored in the Oracle 10g database. Likewise, the temperature data of 16 tags randomly chosen out of a total of 37, were tested for their accuracy concerning their speed of adjustment to changing temperature circumstances in a controlled field setting. After the tags, placed on a table within the blood transfusion laboratory with an environment temperature of 23ºC, had reached a stable temperature, they were moved to a refrigerator with a temperature of 4ºC. The realtime data broadcasted by the tags were read by a reader every 8 minutes and compared to the recordings of an official calibrated temperature logger and the temperatures indicated by a quicksilver thermometer. Median values of temperatures were recorded, and their ranges were calculated and analyzed. The values concerning the speed of adjustments to changing temperature generated by these 16 tags are displayed in Figure 4.
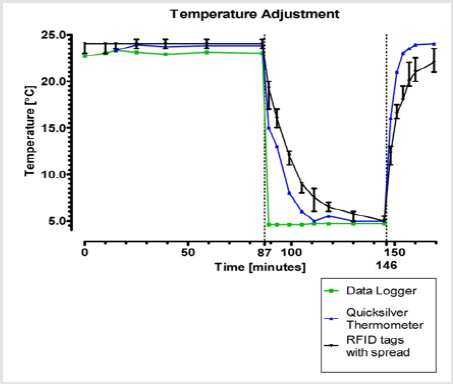
Figure 4: Median temperatures and their ranges recorded by 13 randomly selected RFID temperature tags concerning their speed of adjustment to changing temperature circumstances and their relation to the temperatures measured by a data logger and a quicksilver thermometer.
Data Completeness Tests in A Real-Life Setting
During the larger research study, 37 temperature tags containing a temperature sensor were randomly attached to RBCs and used for tracking and tracing of the RBCs. Figure 2 displays the framework elaborating on the steps of the framework to be taken in relation to the RFID data completeness assessments to be performed. In total, 1.005 RBCs were reserved and dispersed for all patients undergoing surgery. Two hundred forty-three (243) of the RBCs were reserved for cardiothoracic surgery and tracked with an RFID tag. The main reasons that RBCs were not tagged, were
a) shortage of tags during the research study, because tags were still circulating outside the transfusion laboratory after being detached from the RBC before transfusion and were therefore not delivered in time for reuse and
b) shortage of time for attaching tags to RBCs in cases of large RBCs deliveries and emergencies. 4,6 million records with a total database size of 700 megabytes (MB) containing identification, time stamp, location and temperature data of 243 tracked RBCs were recorded in the Oracle 10g database and cleaned before performing the analyses.
Data Cleaning
Before the analysis on the completeness of the RFID generated datasets could be performed, the following data cleaning steps were carried out. First, bouncing effects were managed to avoid data overlapping and gaps in timelines. Bouncing effects are caused by two readers recording data while the tag is passing in one direction but transiently appearing at one and the other reader. Second, because our research focused on the tracking of RBCs being transported between rooms and on monitoring temperature changes, only the last and first records of a dataset containing the same location and temperature data were maintained. All other data records were removed. When no change in temperature of an RBC had been recorded at a specific OR for instance, only the first and last record containing time, location temperature data and temperature data within the same temperature range at that specific location were maintained for the analyses. When the temperature of an RBC had increased or decreased, the first and last records containing data on this rise or fall in temperature were maintained for the analyses. In our setting, a tagged RBC within reach of an RFID reader could for instance produce up to 10.000 records containing the same location and temperature data with different time stamps during a period of 24 hours.
After data cleaning, 4.607 records with a total database size of 1 megabyte (MB) containing identification, time stamp, location and temperature data of the 243 tracked RBCs were included for the analysis of data completeness. Missing data possibly resulting from transient tag drops were taken into account during the assessment of the completeness of the location, time stamp and temperature datasets. For these RFID generated datasets, the percentages concerning their completeness were calculated.
Results
Accuracy of Real-Time Location and Time Data in A Laboratory Setting
The accuracy tests of time and location data were performed by having 2 test persons carry randomly chosen tags through a doorway covered with two readers. The results showed accurate data generated by the tags concerning their location and times. During these tests the 2 different rooms that were ‘created’ with the 2 readers could be discriminated from each other. Also, no bouncing effects or tag drops were experienced during these tests. The tags generated corresponding time stamp data with an accuracy of at least one hundredth of a second (hand- recording).
Accuracy of Temperature Data Recordings by Tags in A Laboratory Setting
Seventeen (17) tags out of 37 tags were assessed on their accuracy of recorded temperature data. Figure 3 displays the median values and ranges concerning the temperature recordings of these 17 RFID temperature tags in relation to the temperature’s measurements by the data loggers. All 3 data loggers measured a water temperature of 23.3°C, without a range, in the water bath at room temperature during a 2 hours period. During this period, the tags measured a median temperature of 23.9°C (with a range of 23.0°C to 24.0°C), 0.6°C higher than the water temperature measured and recorded by the data loggers. Thirteen tags showed a median value of 24.0°C: 9 without a range, 3 with a range of 23.5°C to 24.0°C and 1 with a range of 23.0°C to 24.0°C. The 4 other tags showed a median value of 23.5°C: 2 with a range of 23.5°C to 24.0°C, 1 with a range of 23.0°C to 23.5°C and 1 without a range.
Next, the 3 data loggers recorded a water temperature of 3.7°C, without a range, in a water bath with a refrigerator temperature (3.2°C) during a 6 hours period. During this period, the same 17 tags each stored 45 values with a median temperature of 4.1°C, with a range of 4.0°C to 5.0°C, 0.4°C higher than the water temperature measured and recorded by the data loggers. Thirteen tags showed a median value of 4.0°C without a range. The 4 other tags showed a median value of 4.5°C: 2 with a range of 4.0°C to 4.5°C, 1 with a range of 4.5°C to 5.0°C and 1 without a range.
Accuracy of Real-Time Temperature Data Measurements and Broadcasts in A Laboratory Setting
Thirteen tags of a total of 37 were assessed on their accuracy concerning real-time generated and broadcasted temperature data in water baths varying in temperatures from 1.0°C to 37.0°C. The maximum difference between the temperature measured by the quicksilver thermometer and the temperature measured by tags was 1.0°C. On average the temperatures measured and broadcasted by the selected tags were higher than the temperatures measured by the quicksilver thermometer. Table 1 displays the temperatures generated and broadcasted by the tags and their average values and ranges in relation to temperatures measured by the quicksilver thermometer.
Accuracy of Real-Time Location and Time Data in A Controlled Field Setting
The accuracy of location and time stamp data was tested in a controlled field setting by two persons hand recording the location and time of 10 randomly chosen tags that were moved around the OR. The location and time data generated by 10 randomly chosen RFID tags recorded in the Oracle database corresponded to the data that was registered by hand with a maximum difference of 2 seconds. This difference resulted from the registration of location and time data by hand, which were less accurate than the RFID generated data. These two persons were not able to register time and location data as precise as the RFID system itself. Also no bouncing effects were seen.
Accuracy of The Speed of Adjustment of Real-Time Temperature Data Measurements and Broadcasts to Changing Temperature Circumstances in A Controlled Field Setting
Sixteen RFID temperature tags out of a total of 37, were assessed on their speed of adjustment to changing temperature circumstances concerning their real-time temperature data measurements and broadcasts. Figure 4 displays the median temperatures of these 16 tags and the ranges concerning their speed of adjustment to changing temperature circumstances in relation to the temperatures measured by the data logger and the quicksilver thermometer. During the first stable temperature period of 1 hour and 27 minutes the data logger measured temperatures with a range of 22.7°C to 23.1°C, the quicksilver thermometer with a range of 23.3°C to 23.8°C. The RFID temperature tags showed a median temperature of 24.0°C with a range from 23.0°C up to 24.5°C within this same time period. The temperature measured by the RFID temperature tags on average was 1.1°C higher compared to the temperatures measured by the data logger. Next, the temperature registered by the data logger declined to 4.6°C instantly when moved to the refrigerator. The quicksilver thermometer reached a stable temperature of 5.0°C after 24 minutes after being put into the same refrigerator. The RFID temperature tags reached a stable median temperature of 5.75°C after 43 minutes. The difference of 1.15°C measured by the data logger (4.6°C) and the RFID temperature tags (5.75°C) equals the mean difference of measurements by the data logger and RFID tags in the first stable temperature time period. The average speed of adjustment of RFID temperature tags to new temperature circumstances in the first 18 minutes was -0.83°C per minute (-15.0°C / 18 min. = -0.83°C). The average speed of adjustment in the next 25 minutes was -0.13°C per minute (-3.25°C / 25 min. = -0.13°C).
Completeness of Location, Time and Temperature Data in The Real-Life Clinical Setting
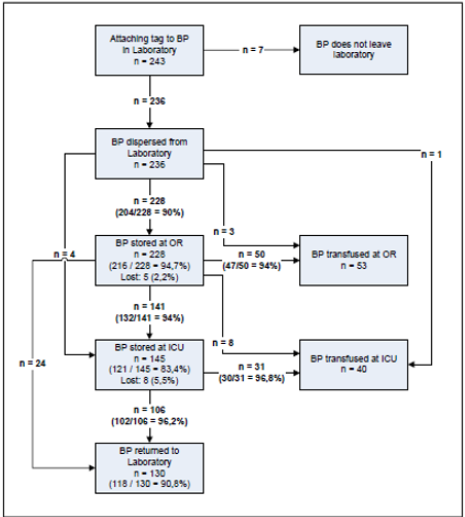
Figure 5: Schematic overview of the routing of tagged RBCs. Every step in the overview shows the completeness of recorded data that was generated by the tracking and tracing of 243 tagged RBCs.
Figure 5 provides a schematic overview of the routing of tagged RBCs through the transfusion chain of the hospital. For every transition step in this route, the completeness of data generated by the tagged RBCs is given.A total of 236 tagged RBCs (236 / 243 = 97%) left the blood transfusion laboratory. Another 7 tagged RBCs (7 / 243 = 3%) did not leave the blood transfusion laboratory because of procedural reasons. First, 228 of the in total 236 (228 / 236 = 97%) tagged RBCs that left the blood transfusion laboratory were transported to the official cooling system in the storage room at the OR complex. The data sets were complete in 204 cases (204 / 228 = 90%) concerning location, temperature and departure and arrival times. For the other 24 tagged RBCs, 10% of the data sets concerning location, temperature and departure and arrival times were incomplete. In parallel, 3 tagged RBCs were transported to an operating room, another tagged RBC to the ICU for immediate transfusion and 4 other tagged RBCs to the storage room of the ICU to be transfused later. These 8 tagged RBCs all showed complete data sets concerning temperature, location and departure and arrival times.
Next, at the OR storage 216 tagged RBCs (216 / 228 = 95%) generated complete data sets concerning location, temperature and arrival and departure times. The 228 RBCs stored at the OR were subsequently transported for transfusion to the OR or stored at the ICU. Forty-seven tagged RBCs (47 / 50 = 94%) transported to the OR for transfusion and 132 (132 / 141 = 94%) tagged RBCs transported to the ICU for storage, produced complete data sets concerning location, temperature and arrival and departure times. Eight tagged RBCs transported to the OR for transfusion and 24 RBCs that were returned to the blood transfusion laboratory, produced complete data sets concerning location, temperature and departure and arrival times. Finally, 5 (5/ 228 = 2%) tagged RBCs no longer produced data sets after they had left the OR storage room. A total of 145 tagged RBCs was stored in one of the 3 storage rooms at the ICU. First, 121 tagged RBCs (121 / 145 = 83%) showed complete data concerning location, temperature and arrival and departure times during their storage at the ICU. The 145 tagged RBCs stored at the ICU were transported for transfusion to the ICU or returned to the blood transfusion laboratory. Thirty (30 / 31 = 97%) of these RBCs transfused at the ICU and 102 (102 / 106 = 96%) tagged RBCs that returned to the blood transfusion laboratory generated complete data sets concerning location, temperature and arrival and departure times respectively. For the remaining 8 (8 /145 = 6%) tagged RBCs all data containing location, temperature and arrival and departure times was missing after they had left the ICU storage room.
Finally, 130 RBCs (130 / 243 = 54%) returned to the blood transfusion laboratory unused: 21 directly from the OR vs. 106 after they had been stored at the ICU. For 118 of these products (118 / 130 = 91%) complete data sets concerning location, temperature and departure and arrival times were available. Another 93 RBCs (93 / 243 = 38%) were finally transfused: 53 at the OR vs. 40 at the ICU. The final destination of the other 13 RBCs (13 / 243 = 5%) remained unclear.
Discussion
Based on a literature review on current insights of RFID implementations in healthcare, we previously developed a framework describing a systematic approach of 9 phases that can be used for assessing the feasibility and impact of using a RFID technology on its health care environment and vice versa [11]. In this paper, the validation study on the accuracy and completeness of location, time and temperature data generated by an active RFID system to be used for the tracking and tracing of RBCs inside the AMC is described. The outcomes of this validation study allowed us to determine whether our RFID system was capable of generating data of such a quality that it could be used in analysing to what extent the transfusion blood chain within the AMC complies to European and Dutch guidelines and regulations on preservation of blood products. The tests concerning the accuracy of location and time data generated by active RFID tags showed minimum differences compared to hand-recorded time and location data.
The tests on the accuracy of temperature data generated by the tags revealed that both real-time recorded temperature data were on average 0.26ºC and 0.5ºC higher compared to the temperature data measured by data a logger and a quicksilver thermometer respectively. The tags adjusted with an average speed of -0.42°C per minute when moved from an environment of 23°C to an environment of 5°C. The data generated by the active tags used in this study were accurate enough for monitoring the RBCs’ temperatures within our hospital setting. The active tags were able to monitor the whole range of temperatures that RBCs could achieve in the transfusion chain. Second, based on the accuracy test concerning the speed of temperature adjustment, it can be assumed that the tags were able to adjust to new temperature circumstances more quickly than the RBCs themselves. Overall, the completeness of the RFID generated datasets concerning location, time and temperature of the RBCs varied from 90% to 100%; data sets from 13 tags were missing after they had left a certain location within the facility. This completeness rate of the real-time location, time and temperature data generated by the RFID tags and the RFID infrastructure was achieved by fine tuning the RFID infrastructure after performing the activities of every phase described in the previous developed framework [11].
Though our data completeness rate was high, it might still have been influenced by environmental circumstances under which the study in the real-life hospital setting took place which we did not take into account in the laboratory and simulated controlled environment tests. First, the signals of tags broadcasting identification and realtime location, time and temperature data might have been blocked by the RBC itself or other local circumstances like, for instance, by a person carrying the blood bag. Such blocked signals might not have reached the RFID receiver and this might have resulted in a loss of blood bag identification and real-time location, time stamp and temperature data. Second, conservative tuning of readers signals forcing tags to transmit their data can prevent signal overlap with other nearby readers and possible harmful electromagnetic interference on medical equipment [11]. At the same time, this might result in weak signal coverage inducing poor activation of tags, causing loss of transmission of identification and real-time location, time and temperature data.
The results from this study only hold for the specified RFID technology and its environment of implementation, the supported part of the blood transfusion chain process in our specific hospital setting. First, RFID systems differ on characteristics such as signal frequency and power. Due to the particularities of this specific setting, for example the presence of certain medical devices, the location of room doors in the OR and ICU complexes, the specific use of tags to track RBCs, a different RFID system might not have produced similar results concerning the accuracy and completeness of location, time and temperature data generated by the tags and the tagged RBCs. Second, the same RFID technology may perform differently dependent upon the setting of implementation. Our RFID system which proved to generate rather accurate and complete datasets in our setting, may behave differently when installed in another clinical department or health care institute, due to the attenuation effects of building structures as one example.
Then, the RFID technology used in this study might not work properly when being used for tracking and tracing of other objects, frozen plasmas or blood biosamples for instance, which need RFID tags that are able to resist temperatures between -30°C and -80°C [17]. In other circumstances, RFID tags might need to be able to resist electromagnetic irradiation produced by medical devices such as Computer Tomography or Magnetic Resonance Imagining for instance [18]. RFID systems differing in characteristics and varying environments of RFID implementation both might affect signal penetration and coverage and might cause variations in tag blocks or data transmission failures by tags. Third, when the use of RFID serves another purpose, unique identification and accurate real time location of medication and patients [19], or of clinicians and patients in a healthcare facility [20] for instances, the required data quality might differ from the requirements set for data accuracy and completeness in this validation study or be much easier to accomplish. When RFID would be used to track medical devices, an RFID tag would be attached to each piece of equipment and RFID readers would have to be strategically located throughout the area of operations where this equipment is used. In this way, any medical device could be traced merely on the basis of the location data generated by the tag.
These three scenarios exemplify that RFID system implementations should always be preceded by data accuracy and completeness tests within the context of the processes being supported. Our validation study illustrates the need of such principle. Another limitation of this study might be the data quality test method itself, because it is not a fully tested and proved method at this stage. As mentioned earlier the data quality assessment tests are part of our framework. This also accounts for the EMI-tests that were performed before these data quality tests took place. For these EMI-tests we used a method already been applied in performance tests concerning technology comparable to RFID, i.e. mobile phones. Methods prescribing how to perform data quality tests concerning RFID systems themselves were yet not available at the time we conducted our pre-installation assessment study concerning the performance of our RFID system in the AMC setting.
Conclusion
This study shows that the tested RFID technology is capable of generating accurate location, temperature and time data in a specific health care setting. The completeness of RFID generated data may yet depend on the building structure, the objects being tracked, (physical objects within) the specific health care setting and characteristics of the technology itself. Therefore, RFID implementations in specific health care settings should be accompanied by EMI, signal coverage-, reader interference- and tag performance tests, as well as data accuracy and data completeness testing in laboratory, simulated field and real life settings. Further research is needed in order to establish a clear understanding of those circumstances that influence the performance of RFID systems in various health care settings. Insight into the impact of specific circumstances on the performances of various RFID systems and vice versa might create generalizable best practices of the use of RFID within specific health care settings that might then benefit from the added value of RFID the most.
RFID performance tests as prescribed in different phases as of our framework prove to be a solid foundation for assessing those environmental circumstances influencing the performance of RFID systems and vice versa systematically, at least in hospital settings. The RFID performance assessment tests concerning data quality that we present could at least act as a reference model for conducting data quality tests on RFID systems in other hospitals.
Authors’ Contributions
RvdT, LWDP and MWJ designed the study, RvdT performed the measurements, the data analysis and drafted the manuscript. MWJ coordinated and supervised the designing of the study, the data analyses, and the drafting of the manuscript. All authors read and approved the final manuscript.
Funding
This research was funded by the Dutch Ministry of Health, Welfare and Sport and the Ministry of Economic Affairs, the Academic Medical Center, Capgemini, Geodan, Oracle and Intel. They had no influence whatever on the content of this manuscript.
Acknowledgement
The authors would like to thank Sanquin, the Blood Transfusion Laboratory, the Operating Complex and Intensive Care unit for their participation in the study.
References
- Schnock KO, Biggs B, Fladger A, Bates DW, Rozenblum R, et al. (2017) Evaluating the impact of Radio Frequency Identification retained surgical instruments Tracking on Patient Safety: Literature Review. J Patient Saf. 2017 Feb 22.
- Lazzaro A, Corona A, Iezzi L, Quaresima S, Armisi L, et al. (2017) Radiofrequency-Based Identification medical device: an evaluable solution for surgical sponge retrieval? Surg Innov 24(3): 268-275.
- Perez MM, Gonzalez GV, Dafonte C (2017) The development of an RFID solution to facilitate the traceability of patient and pharmaceutical data. Sensors (Basel) 17(10): 2247.
- Dufour JC, Reynier P, Boudjema S, Soto Aladro A, Giorgi R, et al. (2017) Evaluation of hand hygiene compliance and associated factors with a radio-frequency-identification-based real- time continuous automated monitoring system. J Hosp Infect 95(4): 344-351.
- Balaguera HU, Wise D, Ng CY, Tso HW, Chiang WL, et al. (2017) Using a medical Intranet of Things System to prevent bed falls in an acute care hospital: a pilot study. J Med Internet Res 19(5): e150.
- Potter P, Allen K, Costantinou E, Klinkenberg WD, Malen J, et al. (2017) Evaluation of sensor technology to detect fall risk and prevent falls in acute care. J Qual Patient Saf 43(8): 414-421.
- Sandler SG, Langeberg A, DeBandi L, Gibble J, Wilson C, et al. (2007) Radiofrequency identification technology can standardize and document blood collections and transfusions. Transfusion 47(5): 763-770.
- Alsinglawi B, Liu T, Nguyen QV, Gunawardana U, Maeder A, et al. (2016) Passive RFID localisation framework in smart homes healthcare settings. Stud Health Technol Inform 231: 1-8.
- Cmiljanic N, Landaluce H, Perallos A, Arjona L (2017) Influence of the distribution of tag IDs on RFID memoryless anti-collision protocols. Sensors (Basel) 17(8): 1891.
- Coustasse A, Meadows P, Hibner T (2015) Utilizing Radiofrequency Identification Technology to improve safety and secure management of blood bank supply chains. Telemedicine and e- Health 21(11): 938-944.
- Remkovan der Togta, Piet JM Bakker, bMonique WM Jaspers (2011) A Framework for performance and data quality assessment of active Radio Frequency IDentification (RFID) Systems in Health care Settings. J of Biomed Inform 44(2): 372-383.
- van der Togt R, van Lieshout EJ, Hensbroek R, Beinat E, Binnekade JM, (2008) Electromagnetic interference from radio frequency identification inducing potentially hazardous incidents in critical care medical equipment. JAMA 299(24): 2884-2890.
- Ying Y, Fischer D, Hölscher U (2009) Electromagnetic Interference with RFID Readers in Hospitals. In: Dössel O, Schlegel W C (eds) World Congress on Medical Physics and Biomedical Engineering 872-875.
- Seidman SJ, Guag JW (2013) Adhoc electromagnetic compatibility testing of non-implantable medical devices and radio frequency identification. Biomed Eng Online 12:71.
- Seidman SJ, Bekdash O, Guag J, Mehryar M, Booth P, et al. (2014) Feasibility results of an electromagnetic compatibility test protocol to evaluate medical devices to radio frequency identification exposure. Biomed Eng Online 13:110.
- Standaard bloedproducten, Sanquin.
- Nanni U, Spila A, Riondino S, Valente MG, Somma P, et al. (2011) RFID as a new ICT tool to monitor specimen life cycle and quality control in a biobank. Int J Biol Markers 26(2): 129-135.
- Steffen T, Luechinger R, Wildermuth S, Kern C, Fretz C, et al. (2010) Safety and reliability of Radio Frequency Identification Devices in Magnetic Resonance Imaging and Computed Tomography. Patient Saf Surg 4(1):2.
- Martínez Pérez M, Vázquez González G, Dafonte C (2016) Safety and traceability in patient healthcare through the Integration of RFID Technology for intravenous mixtures in the prescription-validation-elaboration-dispensation-administration circuit to day hospital patients. Sensors (Basel) 16(8): pii: E1188..
- Ouyang Y, Shan K, Bui FM (2016) An RF-based wearable sensor system for indoor tracking to facilitate efficient healthcare management. Conf Proc IEEE Eng Med Biol Soc 4828-4831.
